The impact of the diameter to height ratio
on the compressibility parameters of
saturated finegrained soils
Rosine Larissa, TN and TomaSabbagh, TM
Title
The impact of the diameter to height ratio on the compressibility
parameters of saturated finegrained soils
Authors
Rosine Larissa, TN and TomaSabbagh, TM
Type
Article
URL
This version is available at: http://usir.salford.ac.uk/43477/
Published Date
2015
USIR is a digital collection of the research output of the University of Salford. Where copyright
permits, full text material held in the repository is made freely available online and can be read,
downloaded and copied for noncommercial private study or research purposes. Please check the
manuscript for any further copyright restrictions.
THE IMPACT OF THE DIAMETER TO HEIGHT RATIO ON THE
COMPRESSIBILITY PARAMETERS OF SATURATED FINE-GRAINED
SOILS
T. Nguedia Rosine
1, T. Toma Sabbagh
21
Ph.D. student, Civil Engineering Research Group, The University of Salford, School of Computing, Science and Engineering, Newton Building, Salford, Greater Manchester, M5 4WT, UK
2
Lecturer, Civil Engineering, The University of Salford, School of Computing, Science and Engineering, Newton Building, Salford, Greater Manchester, M5 4WT, UK
Abstract
Compressibility parameters of fine-grained soils are mainly influenced by soil mineralogy, moisture content and soil diameter to height ratio (D/H). The British and American standards suggested that to obtain accurate engineering properties; it is necessary to use D/H ratio of 4 and 2.5 respectively to eliminate friction between the soil and the structure. In the current study, various D/H ratios were adopted ranging from 0.5 to 11. The D/H ratios effect on some compressibility parameters such as coefficient of consolidation (cv), compression index (cc) and coefficient of volume compressibility (mv) were analysed. Additionally, the impact
of the D/H ratio on the acquire cv values were also presented where three methods were used namely: Casagrande, Taylor and
Inflection method. The scaling effects based on cv ratio [cv (√t) / cv (log t)] from Oedometer tests using different D/H ratios are
also presented. The results showed that Taylor’s method is the most appropriate way to achieve an accurate cv and an increase in
pressure leads to a reduction in cc and a gradual decrease in mv. The validation of the experimental results on a finite element
software package PLAXIS was completed.
Keywords: Compressibility, D/H ratio, Fine-grained soil, Friction
---***---
1. INTRODUCTION
The diameter to height (D/H) ratio criteria is used to reduce friction between the soil and structure. The American Standard suggested a minimum value of 2.5 with a value greater than four most suitable [5]. While the British Standard proposed a value of 4 with a cell diameter of 75mm and height 20mm are mostly applicable [10]. No available data were found to validate the D/H ratio proposed by the American Standard. Morris and Lockington [21] conducted a self-weight consolidation test on fine-grained marine, riverine and lacustrine soils with a diameter to height (D/H) ratio ranging from 1.9 to 4.1. The findings showed that the final void ratio were relatively comparable and was due to the sample particle sizes. Morris and Lockington neglected the effect of D/H ratio from the self-weight consolidation test. Berry and Reid [8] stated that the greater the soil thickness, the more likely friction will occur, and smaller soil sample have no friction.
During conventional consolidation test, the lateral pressure acting on the side walls of the sample container produce frictional resistance to the compression of the sample. Taylor [26] investigated the effect of side friction in consolidation tests and showed that the frictional force varies from 12-22% of the applied pressure for remoulded clay and 10-15% for undisturbed clay. Therefore, the thinner the sample the less side friction due to the small lateral surface area in contact with the wall of the Oedometer
apparatus. Leonards and Girault [19] used steel Oedometer cell and show that friction can significantly alter the result. Thus, by applying greased Teflon, it eliminates friction provided the D/H ratios exceed six. Sivrikaya and Togrol [25] investigated the effect of clay thickness on secondary compression. Sivrikaya and Togrol [25] designed a new Oedometer cell capable to measure the frictional effect between the specimen and the cell. The outcomes revealed that side friction does not remain constant with time but slightly increases at a decreased rate. Kolay and Bhattacharya [17] conducted consolidation tests on kaolin soil with Teflon large diameter (120mm) with a D/H ratio six. The comparison of the results of previous tests (D/H ratio 3) with Kolay's investigation showed that cv is affected
by the apparatus side friction and a correction factor for different consolidation characteristics was applied. The correction factor derived by Kolay and Bhattacharya [17] was to reduce side friction.
The effect of D/H ratio scale was not previously investigated on cc and mv. The importance of cc is in the direct
calculation of settlement of structures from the relationship of pressure and void ratio. It is used as its value does not change with a change in confining pressure for normally consolidated clays [1, 24]. On the other hand, mv is also the
_______________________________________________________________________________________
obtain a relationship with some design parameters. These parameters include internal friction angle, recompression index (cr), moisture content, liquid limit (LL) and specific
gravity (Gs).
On the other hand, the effect of D/H ratio on some engineering properties such as shear strength (τ), modulus of elasticity (E) and the stress-strain relationship was previously investigated. These design parameters were studied using Triaxial and Oedometer tests. Dirgeliene and Stragys [14] proposed a reduction in the standard D/H ratio in Triaxial test from 2 to 1 to eliminate friction. While Grisso et al. [15] showed that the D/H ratio of a Triaxial soil sample has little effect on the compacted soil as compared to smaller D/H ratio. On the other hand, during Triaxial testing, it was observed that at constant cell pressure, the modulus of elasticity decreases with an increase in the D/H ratio [18]. In the current study, the effect of D/H ratios on compressibility parameters is presented and it effect of cv
ratio [cv (√t) / cv (log t)]. More emphasis are employed in the
different method used to obtain cv and the how much impact
the D/H ratio has on the rate of consolidation of fine-grained soils. Numerical simulation was also carried out to model test results, using PLAXIS, to show the compatibility of the numerical analysis with the test. During numerical modelling, the Mohr-Coulomb (MC) model that is probably the most used in the modelling of consolidation tests was used. This model is mostly used due to their simplicity, and specific parameters are easily obtained.
2. EXPERIMENTAL PROCEDURE
The sample preparation and test set up as described in the British and American standard were adopted [9, 7]. A well-known consolidation test was carried out using the Oedometer apparatus. This test model the one-dimensional consolidation of subsoil when pressed by structures only in a vertical direction (the lateral strains are considered to be
negligible). The test was run over a period of 24 hours at certain load increments under double drainage condition under equal strain (where a porous stone was used for uniform strain loading). Data were obtained using a computerised system connected to each Oedometer test with an accuracy of ±0.1%. The system was able to read data from six channels simultaneously.
At each D/H ratio, the initial moisture content and void ratio were calculated from the tested fine-grained soil. The properties of the soils used (Table 1) were obtained as per the standard methods [4, 9, 3, 7, 6]. In order to get the undrained shear strength (cu), the soil was compacted at a
mould 100mm diameter and the vane size of 25mm was used. The vane was inserted at a depth of 10mm within the compacted soil with moisture content ranging from 35% to 61% with cu of 0.28 to 12kN/m2 respectively. The
[image:3.595.310.568.319.387.2]mineralogy analysis of the soil was obtained using X-ray diffraction (XRD), and the principal clay minerals present in the clay is shown in Table1.
Table 1: Soil Properties summary
LL PL PI Gs cu
(kN/m2 ) Mineralog y Kaoli n clay 63 % 32.4 % 30.6 % 2. 6
0.28 – 12
Kaolinite and Quartz Where; LL = liquid limit, PL = plastic limit, PI = plasticity index, Gs is specific gravity and cu = undrained shear
strength (kN/m2)
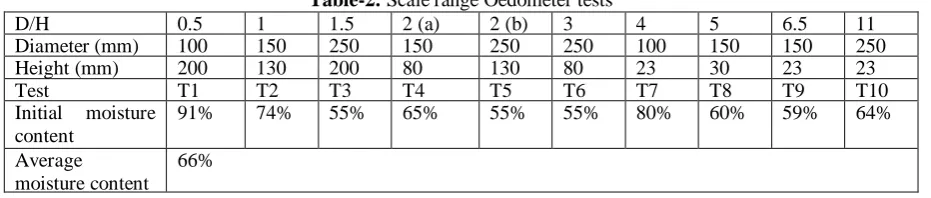
2.1 Diameter to Height Scale Range
A series of Oedometer tests were conducted at different D/H ratio as shown in Table 2. For valid comparison in the D/H ratio, the average of the initial moisture content was considered
Table-2: Scale range Oedometer tests
D/H 0.5 1 1.5 2 (a) 2 (b) 3 4 5 6.5 11 Diameter (mm) 100 150 250 150 250 250 100 150 150 250 Height (mm) 200 130 200 80 130 80 23 30 23 23 Test T1 T2 T3 T4 T5 T6 T7 T8 T9 T10 Initial moisture
content
91% 74% 55% 65% 55% 55% 80% 60% 59% 64% Average
moisture content 66%
2.2 Frictionless Boundary Condition
Previous researchers have shown that in order to reduce friction, Telfon grease is applied to the wall of the Oedometer apparatus by D/H ratio of 6. Kolay and Bhattacharya [17] used Telfon with kaolin soil and found that friction has an effect on cv. Moreover due to this side
friction in the consolidation test apparatus, the vertical pressure on any horizontal plane will decrease with sample depth. As side friction is a function of pressure, it is expected that the e-log p graph becomes flatter with an
[image:3.595.67.533.526.625.2]Fig-1: e-log p curve at different D/H ratios
2.3 Frictional Stress
Many studies have been performed to investigate the effect of sample thickness on both primary and secondary compression. Testing soil sample in the laboratory with considerable great thickness will involve friction problem. Sivrikaya and Togrol [25] revealed that the frictional stress does not remain constant during the test and slightly increases with a decrease in time for soil thickness of 60mm
and diameter 75mm (D/H 1.25). Friction was found to be most significant at low stresses where the clay soil is still over-consolidated [25]. In the current study, the clay is term normally consolidated, and Figure 1 shows friction was eliminated with reference to Healy and Ramanjaneya [16] statement. Sivrikaya and Togrol [25] derived an expression to obtain the frictional stress (τ) as shown in equation 1.
τ = 𝑇
𝜋𝐷𝐻 (1)
Where, D is soil diameter (mm); H is soil height (mm), and T is the load transmitted to the ring (N).
[image:4.595.93.504.434.667.2]Figure 2 shows the application of equation 1 in the current study. It was observed that at a pressure less than 150kPa, there is no significance difference in frictional stress. The observation was at all scales except at D/H 2(b), 6.5 and 5, where D/H 2(b) being greatly influenced. Figure 2 is contradictory to Sivrikaya and Togrol [25], where it is observed that the friction stress is most significant the high stresses for normally consolidated soils under primary consolidation. The difference in findings is due to D/H 1.25 used by Sivrikaya [25] on overconsolidated soils and 10 D/H ratios utilised in this study on normally consolidated soils. Hence, the present study at D/H 1 and 1.5 normally consolidated can directly be compared with D/H 1.25 over-consolidated which shows the difference in findings is due to the fine-grained soil state.
Fig-2: Frictional stresses at various D/H ratios
3. RESULTS
In this section, tests arise from the laboratory model, and numerical analyses are shown. A discussion emphasised in the response of fine-grained soils at different D/H ratio scale. Furthermore, its effect on compressibility parameters is presented.
3.1 Experimental Results
3.1.1 Stress-Strain Distribution
_______________________________________________________________________________________
pressure. Figure 3 shows a variation in strain at different D/H ratio under 55kPa and 110kPa. It displays the fluctuation in strain with D/H ratio observed at both loadings. The importance of D/H ratio, as stated in the
American standard, is confirmed. At D/H ratio less than 2.5, the curve is difficult to construe, thus provide an uncertainty in the curve fitting procedure in obtaining the coefficient of consolidation (cv).
a)
b)
Fig-3: Time-deformation relationship at: a) 55kPa and b) 110kPa
3.1.2 Effect of D/H Ratio Scale on cc and mv
Compressibility parameters investigated were: coefficient of consolidation (cv), compression index (cc) and coefficient of
volume compressibility (mv). The compressibility
parameters cc and mv are important in the calculation of
settlement of structures. cc is used to determine the primary
consolidation settlement of the normally consolidated soil. Normally consolidated soils are a type of soil whose present effective overburden pressure is the maximum pressure that the soil was subjected to in the past [8]. Thus, the soil in this study can normally be termed consolidated. A high cc value
indicates greater compressibility and higher consolidation settlements (Figure 4a). A fluctuation in cc value was
observed with D/H scale, as the load increases, cc reduces to
a value less than 0.1 as depicted in Figure 4a. At 55kPa, there was a sharp rise in cc and mv with the maximum value
observed at D/H 0.5 and D/H 11 respectively (Figure 4b). The lowest value is discerned at D/H 2(a & b) for cc and mv.
a)
b)
Fig-4: Effect of D/H ratio on some compressibility parameters: a) cc and b) mv
Data obtained shows a gradual drop in mv with pressure at
all D/H ratios except at D/H 0.5 and 5. mv was found to
reduce at 220kPa and increase at 276kPa by 72% and 60% respectively (Figure 4b). The findings validate that by Retnamony et al. [22], where mv was found to decrease with
an increase in pressure for kaolinite soil except at D/H 0.5 and 5 at 220 – 276kPa. Thus, D/H scale has an effect on soil compressibility; nevertheless, the outcome is less significant with the overall mv value being less than 0.006 m2/MN
exhibiting a very low compressibility.
3.1.3 Effect of D/H Ratio on the Ratio of [cv (√t) / cv
(log t)]
The values of cv were determined using Casagrande, Taylor,
and Inflection methods. Statistical analysis was carried out using SPSS for a total of 120 cv values at various D/H ratios.
The analysis demonstrates the statistical significance of the value of cv obtained using different methods. The outcome
showed a normality in cv values at all scale except at D/H 5.
At D/H 5, the values of cv were abnormal due to an outlier
found, which is due to the experimental curve not matching the theoretical curve. There is no substantial difference in cv
_______________________________________________________________________________________
difference of 0.003. Thus, the value of cv obtained using
either test method is not significantly different. Hence, Taylor’s method was found to be precisely more adequate to get cv where scale is a concern (Figure 5b) [26]. As
compared to Casagrande and Inflection method, cv was
affected by the curve fitting procedure [11, 13, 20]. The relationship in cv with pressure obtained using the three
method are depicted in Figure 5. The √t curve fitting process was a straightforward process as the primary consolidation part of the curve was easily identified. The issue with the remaining methods at D/H less than 2.5 especially at D/H 0.5 was that the secondary consolidation was not clearly observed rendering difficulty in deriving cv
from curve fitting procedure.
a)
c)
Fig-5: Applied pressure against the coefficient of consolidation (cv) obtained at a) Casagrande method, b) Taylor’s method and c)
Inflection method
Previous researcher’s showed that cv obtained using
Taylor’s method is higher than that attained using Casagrande method and Inflection method gives quite a similar result to that of Casagrande method [2, 12, 20, 23]. The reason being; Taylor’s method is affected by the initial compression (leading to an increase in cv) and in some cases
secondary compression (decrease in cv value). Casagrande
and Inflection method are mostly dependent on a certain amount of secondary compression being observed on the strain-deformation curve. In the current study, the opposite was found where the highest value in cv was attained using
the Inflection method, and Taylor’s method produced the lowest value. The cause of this is due to D/H scale at a
particular scale (D/H < 2.5). Figure 6 shows the ratio of cv √t / log t50, cv√t / log t60 and cv log t50 / cv log t60 with D/H
ratio scale. The outliers in Figure 6 are observed at D/H less than 2.5 and are due to the experimental curve not matching the theoretical curve. The outliers present the uncertainty in the curve fitting process at D/H < 2.5 and the validity of the recommended value by the standard. Therefore, D/H > 2.5 is adopted as per the standard and values showed to be closely packed together. Despite the outliers, the inflection and Casagrande method was found to correlate well as deduced by previous researchers.
_______________________________________________________________________________________
b)
c)
Fig-6: cv√t / log t ratio at various D/H ratio
3.2 Numerical Simulation
Finite element analyses were implemented to validate experimental results on the validity of D/H ratio scale on fine-grained soils. The D/H ratio model was completed using the Mohr-Coulomb model (MC). The finite element model (FEM) was firstly calibrated against the experimental data.
3.2.1 Finite Element Model
A geotechnical finite element program PLAXIS was used for the simulation of the fully saturated fine-grained soils at diverse D/H ratios. The one-dimensional model was axisymmetric and discretized using 16 nodes elements. The young’s modulus was assumed to be 1000 kN/m2
, and a default coefficient of permeability (k) was employed in
PLAXIS with value 5.5x10⁻⁷ m/s. The boundary conditions were set as permeable at both the top and bottom of the soil profile with the side being impermeable. In order to achieve comparative curve to the experimental data, the vertical load was applied in double increments.
3.2.2 Model Calibration
Table-3: Fine-grained soil used in calibration of model
Scale D/H 0.5 D/H 1 D/H 1.5 D/H 2(a) D/H 2(b) D/H 3 D/H 4 D/H 5 D/H 6.5 D/H 11
e 2.53 2.49 2.43 1.88 1.97 1.20 2.09 1.50 1.65 1.61 cu 12.00 12.00 12.00 12.00 12.00 12.00 12.00 12.00 12.00 12.00
γsat 14.33 15.00 14.40 15.20 15.40 17.00 17.30 15.90 15.70 15.8
Where; e is the void ratio, cu is the undrained shear strength (kN/m2), and γsat is the saturated unit weight (kN/m3).
a) b)
Fig-7: Comparison between experimental and numerical model at 110kPa for D/H 1; a) normalised FEM and b) experimental
model. Where; pexcess is the excess pore pressure and |u| is the soil deformation
3.2.3 Excess Pore Pressure Distribution
Practically, during consolidation under double drainage, an excess pore water pressure (Pexcess) is observed at the
mid-height of the soil matrix. Figure 8 shows the difference in excess pore pressure at various D/H ratios ranging from 0.5 to 11. It clearly shows that, as the D/H increases, Pexcess
concentration in the mid-height of the soil matrix increases. At D/H 0.5, Pexcess is observed at the top of the soil, which is
mainly due to the scale and applied pressure proportion to the soil profile. The proportion relates to the ratio of applied
pressure to scale on a fully saturated soil. Due to the pressure being 55kPa at D/H 0.5 under 24hours, the ratio of the pressure on the soil profile is trivial. However, as the pressure increase, Pexcess was observed at the bottom of the
Fig-8: Excess pore water pressure distribution under double drainage at different D/H ratio scale at 55kPa: a) D/H 0.5, b) D/H 1, c) D/H 1.5, d) D/H 2(a), e) D/H 2(b), f) D/H 3, g) D/H 4, h) D/H 5, i) D/H 6.5 and j) D/H 11
In addition, from the trends discerned in Figure 8, D/H yielded the highest excess pore pressure with the lowest being observed at D/H 11. However, the value of D/H 0.5 can be deemed less accurate as the trend does not correspond to the remaining scales. The flaws in trend at D/H 0.5 was observed experimentally where the highest cv
and cc values were noted at this magnitude. Nevertheless,
D/H 1 and 2 (a&b) showed to produce adequate results that are relatively comparable to the remaining scale. The maximum values of Pexcess at D/H 1.5 and D/H 2(a&b) are
more or less analogous by 81% and 98% respectively.
4. CONCLUSION
A study of the influence of D/H ratio on compressibility parameters was investigated. The significant influence of D/H ratio was noticed on cv but was insignificant in cc and
mv. It was previously studied that scale has an impact on cv
but not taking D/H ratio into account. D/H ratio was previously investigated at D/H 3 and 6 and showed it greatly affect cv and D/H greater than 6 recommended. The
Standards suggested 2.5 and 4. The current study on Kaolin clay showed that, at D/H greater than 1, adequate result in the compressibility parameters are obtained. Previous recommended D/H ratio values were in different soil sample thus the difference D/H ratio values. D/H 0.5 showed to be most problematic in obtaining the compressibility parameters, and this was observed numerical where the highest excess pore pressure was noted. In addition, Casagrande and Inflection method were strenuous as the experimental curve did not match the theoretical curve. Therefore, in the absence of friction that is not usually obtained in routine testing, it was observed that in terms of D/H ratio, cv is easily attained using Taylor's method.
REFERENCES
[1]. N. Abbasi, A.A. Javadi and R. Bahramloo. ‘Prediction of Compression Behaviour of Normally Consolidated fine-grained soils’ World Applied Science Journal, 2012, 18(1), Pp.6-14
[2]. M.S. Al-Zoubi. ‘Consolidation analysis by the Slope and Settlement Rate – Settlement Methods. Journal of Civil Engineering, 7(4), 2013, pp. 377-391
[3]. American Society For Testing And Materials, ‘D854’. ‘Standard test methods for specific gravity of soil solids by water pycnometer’, 2010
[4]. American Society For Testing And Materials, ‘D2216’. ‘Standard test methods for laboratory determination of water (moisture) content of soil and rock by mass’, 2010
[5]. American Society For Testing And Material, ‘D2435’. ‘Standard test method for one-dimensional consolidation properties of soils’, 2003
[6]. American Standard For Testing and Material, ‘D2571’. ‘Standard test method for field vane shear test in cohesive soils’, 2001.
[7]. American Society For Testing And Materials, ‘D4318’. ‘Standard test method for liquid limit, Plastic limit and plasticity index of soils’, 2010.
[8]. P.L. Berry and D. Reid. ‘An introduction to soil mechanics’, McGraw-Hill, 1987, Pp.100-137
[9] British Standard, BS1377: PART 2. ‘Methods of tests for soils for civil engineering purposes – Classification Tests’, 1990.
[10]. British Standard, BS1377: Part 5. ‘Methods of tests for soils for civil engineering purposes - Compressibility, permeability and durability tests’, 1990.
_______________________________________________________________________________________
[12]. G. Cortellazzo. ‘Comparison between laboratory and in situ values of the coefficient of primary consolidation cv’
Canadian Geotechnical Journal, 2002, 39, Pp.103-110 [13]. F.F Cour. ‘Inflection point method for computing cv’.
Journal of the soil mechanics and foundation Engineering Division, 1971, ASCE, 97 (5), Pp. 827-831
[14]. N. Dirgeliene, A. Jonas A and V. Stragys. ‘Effects of end conditions on soil shear strength parameters during Triaxial Testing’ 2007, Pp. 1-6, http://leidykla.vgtu.lt/conferences/MBM_2007/5pdf/Dirgelie ne.pdf
[15]. R.D. Grisso, C.E Johnson, A.C Bailey and T.A Nichols. ‘Influences of soil sample geometry on hydrostatic compaction’ American Society of Agricultural Engineers, DOI: 0001-2351/84/2706-1650$02.00, 1984, Pp.1650-1653 [16]. K.A Healy and G.S Ramanjaneya. ‘Consolidation characteristic of a Varved Clay’ Report, Department of Civil Engineering, University of Connecticut, 1970.
[17]. Kolay P. & Bhattacharya G. Remediation of the side friction in conventional oedometer tests by using large diameter consolidometer ring. International Journal of Geotechnical Engineering, 2(2), 2008, Pp.161-167
[18]. N.R Kotiya and M.G Vanza. ‘Effect of H/D ratio on stress-strain characteristics of clayey soil in Triaxial Test’
Indian Journal of Research, 2013, 2(7), ISSN – 2250-1991, 2, Pp.101-103
[19]. G.A Leonards and P. Girault. ‘A study of the one-dimensional consolidation test’ Proceedings fifth international conference on soil mechanics and foundation engineering, Vol.1, 1961
[20]. G. Mesri, T.W Feng and M. Shabien. ‘Coefficient of Consolidation by Inflection point method’ Journal of geotechnical and geoenvironmental engineering, 1999, Pp. 716-1212
[21]. P. Morris and D. Lockington. ‘Geotechnical Compressibility and consolidation parameters and correlations for remoulded fine-grained marine and riverine sediments’ Research Report, CRC for Sustainable Tourism, 2002, P.26
[22]. G. Retnamony, R.G. Robinson and M.A Mether. ‘Effect of clay mineralogy on the coefficient of consolidation’ Clay and Minerals, 1998, 46 (5), Pp. 596-600 [23]. R.G. Robinson. ‘Consolidation analysis with pore water pressure measurements’ Geotechnique, 1999, 49(1), Pp. 127-132
[24]. A. Singh and S. Noor. ‘Soil Compression Index Prediction Model for Fine-grained soils’ International Journal of Innovations in Engineering and Technology (IJLTET), 2012, 1(4), Pp.34-37
[25]. O. Sivrikaya and E. Togrol. ‘Measurement of side Friction between specimen and consolidation Ring with Newly Designed Oedometer Cell’ Geotechnical Testing Journal, 2006, 29 (1)