International Journal of Emerging Technology and Advanced Engineering
Website: www.ijetae.com (ISSN 2250-2459, ISO 9001:2008 Certified Journal, Volume 4, Issue 6, June 2014)
152
E-Box of Duct Optimisation and Thermal Analysis of Battery
Management System on Electrical Vehicle by Using CFD
Raghavendra N
1, Dr. M. C. Math
21
MTech Student, College of Visvesvaraya Technological University, Mysore, India
2Associate Professor, Dept. Of TPE, College of Visvesvaraya Technological University, Mysore, India
Abstract— The battery management system (BMS) monitors important battery parameters like state of charge, state of health, coolant flow for air or fluid and terminal voltage. In this research paper, attempt has made to convert three channels input to two channels input on the E-box duct to optimize the parameters, thereby removing the negative pressure areas and pressure drop in the flow path, In this work, flow analysis and thermal analysis is done to maximize the heat transfer in the system. A full system analysis is done for airflow and thermal performance of optimized system. BMS is created by using CATIA vR20 modelling software. The hex or hexahedral mesh is done for the full system and it has 324907 nodes and 208463 elements. CFD analysis tool was performed using the FLUENT v6.3.2.6 software to analysis of the thermal system for a hybrid electrical vehicle. Thermal analysis is carried out to analyze the heat flow patterns and temperature distribution of BMS used in electrical vehicle.
Keywords— Battery management system (BMS), Computational fluid dynamics (CFD), E-box, Electrical vehicle, Flow path, Fluent.
I. INTRODUCTION
In the mid-19th century, the first electric vehicle (EV) with non-rechargeable batteries came into existence. By the end of the 19th century, mass production of rechargeable batteries has taken place. Then, electric vehicles became fairly widely used. By the 1920s several hundred thousand electric vehicles have been produced which includes cars, vans, taxis, delivery vehicles and buses. However, up until the 1990s, their re-adoption into the mainstream car market was unsuccessful, primarily because their performance and price was higher than internal combustion (IC) engines [1]. In the 21st century, transportation and environment problems are the primary challenge for many countries, especially for India, China, America, and many other nations of the world.
The BMS system monitors important battery parameters like state of charge, state of health, coolant flow for air or fluid, ampere hour counting, terminal voltage and flowing current. Currently, most Hybrid Electric Vehicle battery packs / cells provided with air cooling system. Most of the vehicles have battery packs in the rear areas of the vehicle's cabin space.
A secondary fan blower system pulls conditioned, cabin air through the battery pack and pushes it into the trunk. The temperature of traction battery increases due to constant charging and discharging of the battery [2]. So, battery system needs an efficient cooling system otherwise the temperature will rise above the optimal operating temperature. This immediately affects the battery's ability to accept and deliver energy and ultimately reduces its life. Therefore, a BMS works as a safety system incorporated within the battery packs [3]. Whenever any abnormal conditions, such as over-voltage or overheating are detected, the BMS should notify the user and execute the preset correction procedure [4]. Comprehensive BMS should include the following functions [5]are ability to control battery charging and discharging, cell balancing and thermal management, data acquisition and safety protection, ability to determine and predict the state of the battery, delivery of battery status and authentication to a user interface, communication with all battery components and prolonged battery life.
II. BMSSPECIFICATION AND GEOMETRY
A. 2D drawings Before Modification and Optimized BMS
Figure 1. Front and side views of before modified BMS [6]
Figure 2. Front and side views of optimized BMS [6]
International Journal of Emerging Technology and Advanced Engineering
Website: www.ijetae.com (ISSN 2250-2459, ISO 9001:2008 Certified Journal, Volume 4, Issue 6, June 2014)
153 So, in this work, an attempted has made to enhance the internal spacing of the E-box of duct to get the smooth flow of air inside the system. So three ribs are replaced by two ribs as shown in Figure 2., which reduces the development of negative pressure areas and pressure drop in the E-box of duct along the flow path. Figure 3. shows the changes made by offsetting the rib and material removed for smooth fluid flow.
Figure 4. shows the three ribs / channels flow for the E-box of duct. It had a low internal spacing and each flow volume of the channel of the path was less and had more curvature. Figure 4. also shows the detailed dimensions of the BMS. Figure 5. shows the two channel flow for the E-box of duct in which three ribs are replaced by two ribs. It has a large internal spacing, and excess material was removed for smooth fluid flow due to this each flow volume of the channel is increased by 60%. It has less curvature. Figure 5. shows the detailed dimensions of the BMS after modification. Figure 6. shows the unchanged manifold which reduces the internal spacing and creates more internal friction. Figure 7. shows the modified manifold and it is slightly shifted away from rib. It enhances the internal spacing and creates less internal friction.
Figure 3. Front view of before modified and optimized BMS [6]
[image:2.612.324.565.138.342.2]Figure 4. shows the three ribs / channels flow for the E-box of duct. It had a low internal spacing and each flow volume of the channel of the path was less and had more curvature. Figure 4. also shows the detailed dimensions of the BMS. Figure 5. shows the two channel flow for the E-box of duct in which three ribs are replaced by two ribs. It has a large internal spacing, and excess material was removed for smooth fluid flow due to this each flow volume of the channel is increased by 60%. It has less curvature. Figure 5. shows the detailed dimensions of the BMS after modification.
Figure 4. Top view of before modified BMS [6]
[image:2.612.57.285.416.541.2]Figure 6. shows the unchanged manifold which reduces the internal spacing and creates more internal friction. Figure 7. shows the modified manifold and it is slightly shifted away from rib. It enhances the internal spacing and creates less internal friction.
[image:2.612.327.571.438.638.2]International Journal of Emerging Technology and Advanced Engineering
Website: www.ijetae.com (ISSN 2250-2459, ISO 9001:2008 Certified Journal, Volume 4, Issue 6, June 2014)
[image:3.612.66.273.136.293.2] [image:3.612.65.266.256.464.2]154 Figure 6. Manifold unchanged BMS [6]
Figure 7. Manifold modified BMS [6]
B. Dimensions of 3D modeling
The 3D geometry of BMS is created by using CATIA Software in the post processer. Motor controller (MC) is a rectangle plate seated on the wall of MC. Fins are provided below the wall of the MC. MC has the width of 247.06mm, length of 275.02mm and thickness of 7.50mm. Wall for MC has the width of 275.024mm, length of 247mm and thickness of 1.4mm. MC fin has the width of 233.56mm, length of 228.0mm, fin width of 1.98mm, pitch of 9.96mm, surface thickness of 2.0mm and thickness of 37.10mm. Battery link direct circuit (BLDC) is a rectangle plate seated on the Wall for BLDC. Fins are provided below the wall of the BLDC. BLDC has the width of 144.80mm, length of 202.4mm and thickness of 7.62mm. Wall for BLDC has the width of 144.87mm, length of 202.44mm and thickness of 1.24mm. BLDC Fin has the width of 105.01mm, length of 161.01mm, fin width of 1.98mm, pitch of 8.33mm and thickness of 25.17mm. Charger is a rectangle plate seated on the Wall for Charger. Fins are provided below the wall of the Charger.
Charger has the width of 217.40mm, length of 203.40mm and thickness of 6.0mm. Wall for Charger has the width of 217.40mm, length of 200.52mm and thickness of 1.2mm.Charger Fins has the width of 177.0mm, length of 193.56mm, fin width of 3mm, pitch of 7.23mm, surface thickness of 5.7mm and thickness of 40.7mm.
DCDC is a rectangle plate seated on Wall for DCDC. Fins are provided below the wall of the DCDC. DCDC has the width of 217.40mm, length of 200.50mm and thickness of 1.31mm. Wall for DCDC has the width of 217.40mm, length of 203.55mm and thickness of 1.20mm. DCDC Fin has the width of 177.0mm, length of 191.4mm, fin width of 3mm, pitch of 10.23mm, surface thickness of 5.7mm and thickness of 40.7mm. Figure 5. shows Duct with fluid body with E-box of duct from input end through casing of fluid body and at the end it has output 1 and output 2. It has the width of 647.22mm, length of 457.01mm, pitch of 10.23mm, surface thickness of 5.7mm, thickness of 138.6mm and rest of the dimension are shown in the figure. Inlet is a rectangle plate, has the width of 100.01mm, length of 100.00mm and thickness of 1.38mm. Fan is placed near to the inlet of E-box of duct is improve the airflow internally with reduces the overall internal temperature. Outlet 01 is a rectangle plate seated at outlet Exit fan, has the width of 136.77mm, length of 101.47mm and thickness of 1.24mm and Outlet 02 is a rectangle plate seated at outlet Exit fan, has the width of 104.32mm, length of 91.80mm and thickness of 1.24mm.
III. NUMERICAL METHODOLOGIES
A. 3D Modelling with Meshing
International Journal of Emerging Technology and Advanced Engineering
Website: www.ijetae.com (ISSN 2250-2459, ISO 9001:2008 Certified Journal, Volume 4, Issue 6, June 2014)
155 Considering the above boundary conditions to solve the problem till stable condition is reached. Finally, the solution in 3D model of BMS is simulated from fluent for pressure contours, velocity vectors, temperature Contour and Turbulent Kinetic Energy contour.
B. Calculations
1. Reynolds number by using below formula [3].
Re = (ρ X Ѵ X Dh ) / (µ) Hydraulic diameter in meters Dh = ((4 X Area)/Perimeter) Where,
A = Area of fan = 0.092 × 0.092 = 0.00846 m2 Perimeter = 2(0.092+0.092) = 0.368 m Therefore,
Dh = (4 X 0.00846)/ 0.368 = 0.092 m Velocity by using the below equation m = ρ× A × Ѵ
Where,
Mass flow rate (m) as an input=127.31CFM, 1CFM =1.699 m3/hr,
m = (127.31 × 1.699 × 1.225)/3600 = 0.0731kg/s, ρ = Density of air = 1.225 kg/m3
,
Ѵ = 0.0731 / (0.00846 × 1.225) = 7.08 m/s Hence,
Reynolds number is
Re = (1.225 X 7.08 X 0.092) / (1.789 X 10⁻⁵) Re = 44601.23 = 0.4450123×10⁵
2. Turbulent intensity I in %
I = 0.016 * (Re)-0.125 = 0.016 * (44601.23)-0.125 I = 4.18%
IV. POST PROCESSING ANALYSIS AND RESULTS OF BMS Figure 8. to15. shows the fluid flow behaviour pattern of the BMS like Pressure, Turbulent Kinetic Energy, Temperature and Velocity vector contour. Figure 5. shows that air fed by the inlet of E-box of duct is accelerated into the fluid domain through outlet 1 and 2. It also shows that maximum heat transfer is achieved due to high flow velocities, due to the high internal spacing and less internal friction which cause to create minute negative pressure, maximum pressure at inlet, reduced temperature and comparatively improved pressure at outlets.
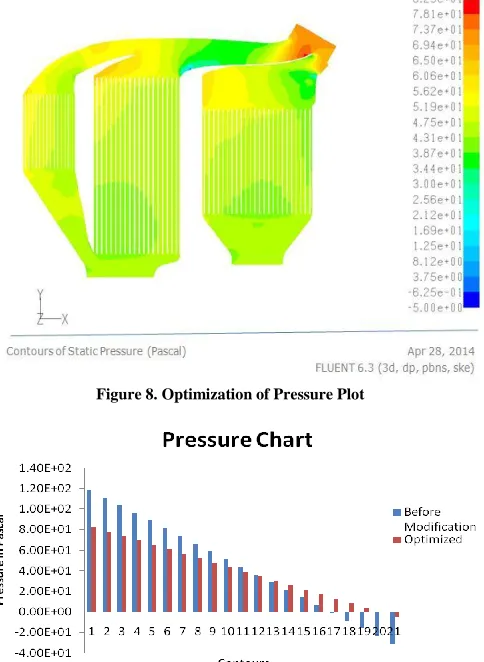
[image:4.612.330.572.284.615.2]Figure 8. and 9. shows optimized pressure system. Before modification to the system, the maximum pressure is 1.19×10+02 N/m2 and minimum pressure is -3.11×10+01 N/m2, but in the optimized system the maximum pressure is 8.25×10+01 N/m2 and minimum pressure is-5.11×10+00 N/m2. Fig. 10 and 11 shows optimized turbulent kinetic energy system. Before modification to the system, the maximum turbulent kinetic energy is 1.22×10+01 K-m2/s2 and minimum turbulent kinetic energy is 6.75×10-06 K-m2/s2, but in the optimized system the maximum turbulent kinetic energy is 4.43×10+00 K-m2/s2 and minimum turbulent kinetic energy is 3.05×10-03 K-m2/s2.
Figure 8. Optimization of Pressure Plot
International Journal of Emerging Technology and Advanced Engineering
Website: www.ijetae.com (ISSN 2250-2459, ISO 9001:2008 Certified Journal, Volume 4, Issue 6, June 2014)
[image:5.612.325.566.133.321.2]156 Figure 10. Optimization of Turbulent Kinetic Energy Plot
Figure 11. Before modification and optimization of Turbulent Kinetic Energy Chart
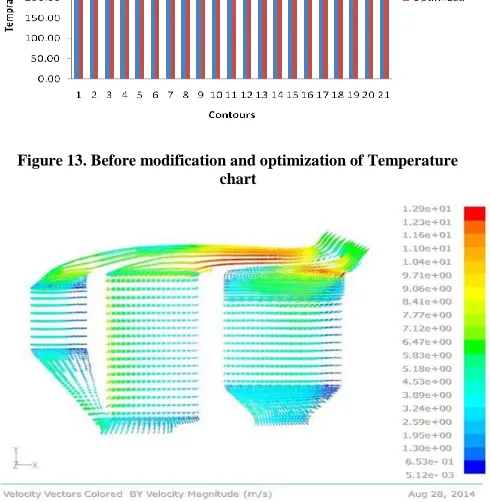
[image:5.612.54.294.152.323.2]Figure 12. and 13. shows optimized temperature system. Before modification to the system, the maximum temperature is 367.90 K and minimum temperature is 299.46 K, but in the optimized system, the maximum temperature is 343.09 K and minimum temperature is 299.60 K. Figure 14. and 15. shows optimized velocity system. Unmodified system has the maximum velocity of 1.48×10+01 m/s and minimum velocity of 1.04×10-03 m/s, but in the optimized system the maximum velocity is 1.29×10+01 m/s and minimum velocity is 5.12×10-03 m/s.
Figure 12. Optimized Temperature Contour Plot
[image:5.612.53.286.355.480.2]Figure 13. Before modification and optimization of Temperature chart
[image:5.612.325.570.417.668.2]International Journal of Emerging Technology and Advanced Engineering
Website: www.ijetae.com (ISSN 2250-2459, ISO 9001:2008 Certified Journal, Volume 4, Issue 6, June 2014)
[image:6.612.54.284.146.241.2]157 Figure 15. Before modification and Optimized Velocity Magnitude
V. CONCLUSION
Following conclusions can be derived based on the Design modification and analysis carried out on two ribs or channel in the BMS.
• Two ribs E box of duct has more internal spacing than three ribs. It results in increase in volume of the channel flow of path, less curvature. Excess material is removed for smooth flow in the BMS. So, it causes for development of very low negative pressure areas and pressure drop.
• Maximum heat transfer is achieved due to low
internal friction. It creates low temperature in the BMS. Finally the optimized system is satisfactory from the above data.
REFERENCES
[1] A. Pesaran, A. Vlahinos, and S. Burch, “Thermal performance of EVand HEV battery modules and packs,” National Renewable Energy Laboratory (1997).
[2] D. Ghosh, Kimberley King, Brian Schwemmin, and Douglas zhu, “Full Hybrid Electrical Vehicle Battery Pack System Design, CFD Simulation and Testing,” 2010-01-1080
[3] X. Hu, S. Lin, and S. Stanton, “A novel thermal model for HEV/EV battery modelling based on CFD calculation,” Energy Conversion Congress and Exposition (2010): 893-900.
[4] Z. Rao, S. Wang, and G. Zhang, “Simulation and experiment of thermal energy management with phase change material for ageing LiFePO4 power battery,” Energy Conversion and Management 52 (2011): 3408-3414.
[5] Yinjiao Xing, Eden W. M. Ma, Kwok L. Tsui and Michael Pecht “Battery Management Systems in Electric and Hybrid Vehicles,” 1840-1857; doi: 10.3390/en4111840, April 2011.
![Figure 4. Top view of before modified BMS [6]](https://thumb-us.123doks.com/thumbv2/123dok_us/8712894.882384/2.612.324.565.138.342/figure-view-modified-bms.webp)
![Figure 7. Manifold modified BMS [6]](https://thumb-us.123doks.com/thumbv2/123dok_us/8712894.882384/3.612.65.266.256.464/figure-manifold-modified-bms.webp)