Some results from a system dynamics
model of construction sector
competitiveness
Gilkinson, NR and Dangerfield, BC
http://dx.doi.org/10.1016/j.mcm.2011.09.011
Title Some results from a system dynamics model of construction sector
competitiveness
Authors Gilkinson, NR and Dangerfield, BC
Type Article
URL This version is available at: http://usir.salford.ac.uk/17834/
Published Date 2013
USIR is a digital collection of the research output of the University of Salford. Where copyright permits, full text material held in the repository is made freely available online and can be read, downloaded and copied for noncommercial private study or research purposes. Please check the manuscript for any further copyright restrictions.
Some Results from a System Dynamics model of Construction Sector Competitiveness
Norman Gilkinsona
a
Salford Centre for Research & Innovation (SCRI), The University of Salford, Maxwell Building, Salford, M5 4WT, U.K.
Email: [email protected] Telephone : 0044 161 2956232
Brian Dangerfieldb
b
Salford Business School, The University of Salford, Maxwell Building, Salford M5 4WT, U.K.
Email: [email protected]
Abstract:
Despite government-led good practice initiatives aimed to improve competitiveness in the U.K. construction sector, fluctuations in growth-driven demand, investment and constant regulatory revisions make it very difficult for an enterprise to plan strategically and remain competitive over a timescale exceeding 2 to 3 years. Research has been carried out to understand the historical evolution and changing face of the construction sector and the dynamic capabilities needed for an enterprise to secure a more sustainable competitive future. A dynamic model of a typical contracting firm has been created based upon extensive knowledge capture arising from fieldwork in collaborating firms together with a detailed review of the literature. A construct called the competitive index is used to model contract allocation in a stylised market. The simulations presented enable contracting enterprises to reflect strategically with a view to remaining competitive over a much longer time horizon of between 15 and 20 years. The rehearsal of strategy through simulated scenarios helps to minimise unexpected behaviour and offers insights about how endogenous behaviour can shape the future of the enterprise. To date, work on construction competitiveness has been either of a static nature or set predominantly at the level of the project. This study offers a new perspective by providing a dynamic tool to analyse competitiveness. It creates a new paradigm to support enhanced construction sector performance.
Keywords:
Construction; Contracting; Competitiveness; Futures; System Dynamics.
1. Introduction
The research collaboration split the competitiveness focus three ways. The project required an unusual variation of multiple research techniques forming a unique structure as outlined in the research plan to capture empirical data relevant to contracting enterprises1 [3]. One set of researchers employed a case study method [4] and interview techniques [5] to capture the dynamic capabilities and historical evolution of construction enterprises [6]. Another group used workshop techniques to capture knowledge relevant to the potential futures of contracting enterprises [7] [8]. Our focus was to ‘bring alive’ the qualitative detail captured through interviews and workshops to allow an assessment of contract delivery in practice; this was achieved by means of a system dynamics model (SD). The various knowledge strands captured from the work-packages were synthesised in a model built to explore sustained competitiveness.
Competitive behaviour in the construction industry has been explored in the past [9] [10] and some of this work has employed the system dynamics methodology [11] [12] [13]. The Ogunlana, Li and Sukhera [11] work is set at the level of the project; a similar level of aggregation is adopted by Katsanis [12]. The research by Kim and Reinschmidt [13] comes closest to our model although their work concentrates on the bidding process and does not employ a dynamic competitive index (as described below) which synthesises the various strands of competitiveness.
The SD methodology [14] was chosen to help understand the inter-related competitive forces at play in the industry because of its ability to handle interconnectivities arising from complicated feedback processes. Such interconnectivity is rife in the versatile construction sector of industry where many stakeholders operate at any one time both vertically and laterally throughout a typical construction project life cycle. The purpose of this study was to expose greater understanding of the dynamic inter-relationships between the differing factors which impinge upon competitiveness in a construction enterprise [15]. The outcome was the development of a model-based tool for thinking and an enhanced ability to support strategy for sustained competiveness.
System Dynamics has been used to model economies, societies and environmental systems [16] [17] [18]. However, due to its ability to provide insight in complex, high-order and non-linear systems and to recognise that detached events are often mutually connected [19], it was considered appropriate for this application. The reasons for the choice are further explained in Dangerfield, Green and Austin [20].
2. Capturing the Dynamic Capabilities of the Construction Enterprise
There are many elements to the competitive strategy of a regional contracting enterprise, as indeed there exists facing any enterprise [21] [22] [23]. Seminal work by Porter [24] examined how planners expand to competitive actions to secure advantage over rivals, providing analytical techniques for understanding the competitive behaviour of such rivals. This supplied industry sectors with the five forces of competitiveness comprising endogenous and exogenous enablers: the competitive rivalry within an industry, the bargaining power of suppliers, bargaining power of customers, threat of new entrants and the threat of substitute products [25]. The overall process of the project is portrayed in figure 1.
1 When referring to a sector regional contractor company, professional firm or organisation; the word enterprise is used so
Figure 1: The Overall Project Process
Further to this Green, Harty, Elmualim, Larsen and Kao [26] discuss strategy and interconnected competitive influences, as reflected in Figure 2. This enables a company to understand their sector structure to target positioning for greater competitive advantage leading to increased profits with concomitant reduced risk [27].
Figure 2: Internal and external competitive interconnected influences [28]
Initially a high level map of the contracts model was produced to portray the essential ingredients for a construction enterprise to operate: human resources, material supplies and finance (see figure 3). Here the political, economical, social, technological, legal and environmental (PESTLE) influences exogenous to the sector and those endogenous factors: finance, human resources, materials, assets, programme of works including late starts and over-runs were considered. These latter aspects have a considerable impact on an enterprise’s reputation and cannot be omitted from a model intended to
Futures Studies and potential industry
trends
Contract delivery related to current industry context Historical Evolution
and industry structure
SD Contracts Model –
Future Scenarios
[image:4.595.54.401.425.647.2]illuminate the factors contributing to sustained competitiveness. The feedback loop portrayed at the bottom of figure 3 is continuously live both in the real world and our model. Also, competitors’ actions can impact on human resources (through, for instance, wage settlements) and supplies (high demand from one sector or country pushing up the price or availability of crucial commodities) and therefore need to be considered in scenario runs.
Figure 3: A high level map of the contracts model [29]
3. Knowledge Capture for the Contracts Model
An element of this research was to establish qualitative data encompassing specific interconnectivities surrounding contract delivery [30] [31] since enterprises need to respond to a constantly changing environment to sustain competitiveness [32]. An interview technique with successful contractors based in the North-West of England enabled the capture of knowledge from which effective ‘knowledge strands’ were developed for inclusion in the SD model. This further supplemented the findings derived from our collaborators’ efforts. The specific focus was to devise various ‘knowledge strands’ related to competitiveness in practice.
A semi-structured questionnaire was created and released to a selection of sector actors based on their expertise and experience in different aspects within the construction sector so as to achieve a broad knowledge base spanning both the project life cycle and the supply chain. The questions were carefully devised to capture data relevant to all circumstances and aspects of competitiveness in contract delivery. The candidates included a registered social landlord (RSL), a manufacturer of off-site construction fabrications (modern methods of construction), a specialist sub-contracting heating engineer and a housing contractor for residential and shelter dwellings.
4. Detailed formulation of the model
The primary objective was to develop an integrated tool able to support strategy for sustained competitiveness. The SD methodology is similar to case study research in that both capture information from an actual case; however SD takes the descriptive data further because the causal interconnectivities identified can be used to simulate dynamic behaviour. Essentially the method has the capability to understand how both the internal and external interconnected activities relate [33].
The empirical data captured from the research collaborators and our interviews enabled the model to be developed. A range of policy factors were included as shown in Table 1. The model was
programmed using the VENSIM ™ software.
Table 1: Knowledge strands included in the Contracts Model
Contract delivery related to current industry context
Contractor selection and partnering supply chain
Winning work; workforce as a reputation-defining asset
Poor workmanship and construction defects
Payments and relationships
Compliance with environmental regulations and requirements
Risk of resource capacity constraints
Understanding the market
The model was developed to portray possible future strategy considerations by construction sector enterprises. The various model variables interact through causative links and feedback loops. The model provides understanding of sector structure flows, delays, information and feedback which, once run as computer simulations, informs potential strategic futures. Model parameters were elicited during a series of interviews with senior management from a range of industry enterprises and the interview process described earlier. The main parameters are listed in Table 2.
Table 2: Main parameter values in the contracts model
Delay in starting contract (normal) 1.5 years
Delay in completing contract (normal) 1 year
New contracts put on offer 50/year
Hiring lag 1 year
Sub-contracting lag 3 months
Average number of employees on site (per contract) 50 people
Average revenue per contract per annum £4 million
Delay in paying money 3 months
Delay in receiving money 3 months
Average supply cost per contract per annum £0.5 million
5. The Competitive Index
A competitive index (CI) was developed so as to synthesise the effects of a number of factors which define the multi-dimensional perspective of competitiveness in the contracting industry. These
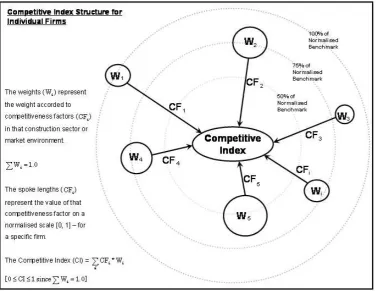
[image:7.595.62.440.240.531.2]included cash-flow, delays in completing and starting contracts, the number of sub-contracted workers and supplier relationships. Figure 4 illustrates the detail of the competitive index (CI) for a single enterprise. For example, when delays are reduced litigation may be avoided thereby maintaining an organisation’s reputation and improving its CI. The CI is effectively a dynamic key performance indicator (KPI) for construction competitiveness.
Figure 4: Detail of the workings of the competitive index (reproduced from Dangerfield et al, 2010)
The references to [34] [35] in respect of the Chinese construction industry reveal that an index of this
type is not a new idea. But whereas their (slightly different) index formulations are used on ex post
construction industry data and in a static framework, ours is embedded in a dynamic model and so is
continually being re-computed whilst simulated time is progressing as the simulation proceeds.
The weights ( ) represent the weight accorded to the competitiveness factor (CFi) in that
construction sector or market environment. These are held fixed in any one run and will reflect the appropriate weightings for any given sector. The weights must sum to 1.0.
The spoke lengths (CFi) represent the value of that competitiveness factor on a normalised scale 0–1,
for a specific enterprise. These will vary dynamically as the simulation progresses.
For the purposes of illustration we model three enterprises (A-C) competing in one contracting sub sector. The CI expands those aspects defined in the high level map (figure 3). The model normalises the CI values, so that the highest possible CI will be 1.0, although >1 competing enterprise can secure
such a value since the CI is computed for each competing enterprise separately. The delay in completing a contract can have a significant bearing on the competitive index variable. There is a non-linear relationship between contract completion time and the resultant penalty. The penalty will arise due to the enterprise breaching its capacity limit, causing delays in completing contracts. Any resulting drop in CI will give them a smaller share of the contracts on offer in the market.
The mathematics involved is briefly explained in Figure 4. The weights are constrained to sum to 1.0 and the value of each competitive factor is normalised to a scale of 0-1. This is achieved by
determining the best (largest or smallest as appropriate) of the three competing enterprise’s values for a given CF and awarding this the value of 1.0. The other (two) values are then calculated as pro-rata values against the best value. This is the mechanism used by the World Bank to determine the competitiveness of different nations.
[image:8.595.65.536.393.671.2]It should be noted that this is not the same normalisation process as that adopted by Sha et al [35]. The approach they have adopted ensures that the full range of the scale is used. Thus, under their method, one enterprise will always score 0 and another 1.0 on any given competitive factor. On the other hand, the method we have adopted allows one to determine how far off the ‘best’ any given enterprise is for any given competitive factor. It should be understood that if each of the three enterprises has the same CI they will each receive an equal share of the contracts on offer in the market: one-third in this case. For further details see Dangerfield et al [20].
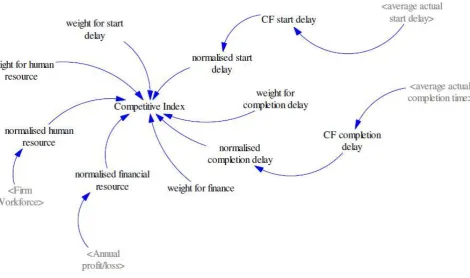
Figure 5: Influences on the competitive index (variables in angled brackets represent those computed in another model sector)
WIP
contracts start contracts completed Contracts On
Offer in the Market Contracts Won But Not Started contracts allocated new contracts released
delay in allocating
contracts delay in starting contracts fraction allocated to
each firm average actual completion time Initial WIP WIP capacity constraint average actual start delay <Competitive Index>
delay in completing contracts start delay smoothing constant completion delay smoothing constant smoothed contracts start smoothed contracts completed
Ave number of employees per contract
[image:9.595.52.526.54.320.2]Workforce demanded
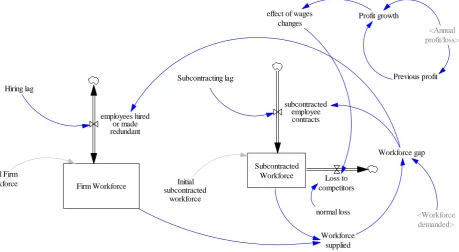
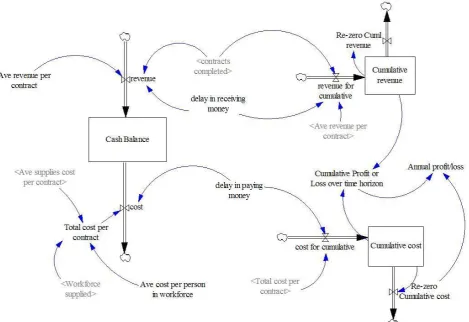
[image:9.595.68.528.477.729.2]Figure 6: Flow diagram of the Contracts sector
Figure 6 shows the stock-flow structure dealing with contact achievement whilst figure 7 concerns human resource aspects and figure 8 the financial sector of the model. Successful bids are determined by the competitive index simultaneously considering contract completion, delays, human resource and finance variables. An increase in contracts allocated is associated with the reputational aspect of achieving programmes within timescales.
Subcontracted Workforce subcontracted employee contracts Workforce supplied Workforce gap Subcontracting lag Initial subcontracted workforce Firm Workforce employees hired or made redundant Initial Firm Workforce Hiring lag <Workforce demanded> <Annual profit/loss> Previous profit Profit growth
effect of wages changes
Loss to competitors
normal loss
Figure 8: View of the financial sector of the model
6. Model Validation
The validation of an SD model is grounded in gaining confidence that the model is an adequate representation of the real-world system it seeks to emulate. In the case of a model formulated for the purpose of analysing a specific problem in an organisation this process will equate to acquiring acceptance from a closely involved client set and, possibly, demonstrating that the base case behaviour qualitatively accords with known reported (past) data.
In this case the model is generic, although it could be parameterised to a specific contracting
enterprise if necessary. Therefore the validation process is changed to exposing the model to a range of industry experts, inviting their comments and hopefully securing ‘buy-in’ to the model for
providing a tool for thinking about industry competitiveness.
A group of leading sector based stakeholders were selected: one of the practitioners worked for a family-owned main contractor with a GBP100 million turnover. Another worked for a civil engineering contractor with a GBP40 million turnover. The third was an executive director for a major international contractor, again with a multi million pound turnover. Prior to the sessions (there was more than one) preparatory dialogue took place and a full brief was provided outlining the research aim, objectives and progress along with information of how the SD method is used to
Participants were asked to review the model and to identify any flaws or potential improvements. Discussion and critical appraisal captured missing elements that needed to be included in an amended model. Delegates found themselves thinking about future scenarios for the sector and the constituent enterprises. After surfacing their thoughts, delegates discussed potential revisions with the modelling team who subsequently adjusted the model appropriately.
7. Simulation Output
The earlier paper by Dangerfield, Green and Austin [20] provides a detailed description of the model formulation and its use in the construction sector as well as potential outcomes and implications for sustained competitiveness. However, space afforded only a rudimentary consideration of the output. This section rectifies that shortcoming by reporting on some of the working SD model simulations which provide some interesting insights for construction sector competitiveness. Recall that an assumption was made of three competing sector enterprises. The simulations span a 15-20 year duration with a fixed time step of one-eighth of a year.
The model was designed to allow various simulations which would rehearse strategy and provide insight to possible future scenarios. The simulation runs were not intended as a means of reproducing a specific contracting enterprise’s behaviour, but rather as a series of laboratory experiments that would heighten thinking about prospective strategies in the industry. Recall that this is an industry not especially known for thinking strategically and looking beyond the next project.
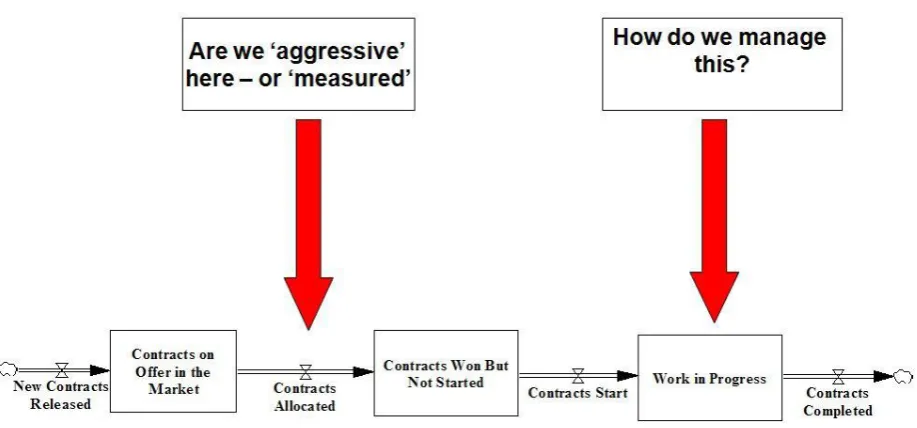
[image:11.595.52.511.511.725.2]Possible focal points to consider are highlighted in figure 9. Under-performance in the management of work-in-progress will result in late contract completion. This is a major factor determining reputational aspects of a contracting enterprise for when the planned times for ‘contract start’ or ‘contract completed’ are not met their reputation is compromised affecting the chances of securing future contracts by virtue of the workings of the competitive index described above. A more aggressive (‘hunter gatherer’) approach to attempting to secure future contracts undermines the chances of timely starts and completions.
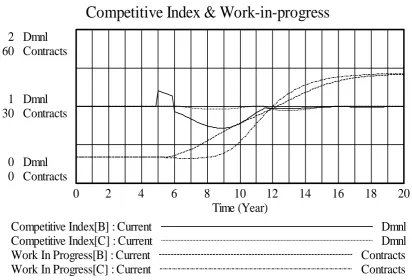
The simulation depicted in figure 10 shows a possible dynamic arising in this context. Within the three assumed competitors, Enterprise B is arbitrarily given a boost to competitiveness in year 5. This disturbance offers ‘B’ a competitive advantage over its rivals. Despite this benefit within a few years there are serious problems because their completion delays start to rise alarmingly (from 2 years to 3 on average by year 8). The growth of work-in-progress (usually accompanied by a spurt in re-work arising from excessive urgency to complete) puts significant pressure on their resources and their ability to win future contracts is compromised (See figure 11). Indeed, it is possible their management might refrain from bidding at all, given the pressures in handling current projects. We can conclude the management of resource capacity is crucial here.
Completion delays & Contracts Allocated
20 Contracts/Year 4 Year
15 Contracts/Year 3 Year
10 Contracts/Year 2 Year
0 2 4 6 8 10 12 14 16 18 20
Time (Year)
Contracts Allocated[B] : Current Contracts/Year
Contracts Allocated[C] : Current Contracts/Year
completion delay due to wip[B] : Current Year
[image:12.595.59.469.234.517.2]completion delay due to wip[C] : Current Year
Figure 10: Completion Delays and Contracts Allocated (NB. A’s behaviour is identical with Enterprise ‘C’)
Interestingly, we can see from figure 10 that enterprise ‘C’ (‘A’ is equivalent) did not actively introduce an innovative strategy to gain an advantage over their rivals, but rather they simply
benefited from the consequence of enterprise ‘B’ taking on too many contracts at the same time which led to their inability to sustain competitiveness. This corresponds with qualitative knowledge
achieved from our interviews that some enterprises will tender for contracts even when they do not have the resources to deliver to programme. In practice part of a contracting enterprise’s strategic plan may include drafting in extra resource through a great deal of sub-contracting, but with this option there is considerable risk attached.
effort, but their own internal resource management. Also it is worth remarking that an arbitrary disturbance in year 5 has created dynamics in the sector which only begin to settle in year 12.
Competitive Index & Work-in-progress
2 Dmnl 60 Contracts
1 Dmnl 30 Contracts
0 Dmnl 0 Contracts
0 2 4 6 8 10 12 14 16 18 20
Time (Year)
Competitive Index[B] : Current Dmnl
Competitive Index[C] : Current Dmnl
Work In Progress[B] : Current Contracts
[image:13.595.58.471.125.405.2]Work In Progress[C] : Current Contracts
Figure 11: B’s Competitive Index declines associated with a growth of work-in-progress (NB. ‘Dmnl’ = dimensionless)
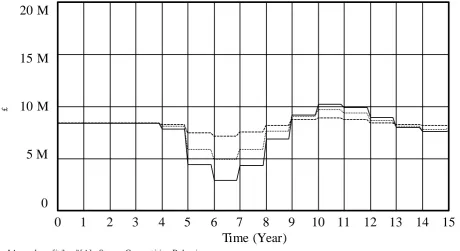
A further experiment considered the financial repercussions from various styles of competitive behaviour (see figure 12 where the annual results from enterprise ‘A’ are shown arising from three styles of competitive behaviour). The graph illustrates conformity with the competition literature in that as aggressive competitive behaviour increases, so do the resources devoted to the bidding process. It should be noted that in adopting this style there is an associated risk of litigation through penalty allocations. In consequence, along with the dynamics portrayed in figures 10 and 11, the more aggressive style can result in larger swings in the profit and loss account. Shareholders may
appreciate short-term gains but a more measured competitive approach can secure a more sustainable financial position.
20 M
15 M
10 M
5 M
0
0 1 2 3 4 5 6 7 8 9 10 11 12 13 14 15
Time (Year)
£
" An n ual pro fit /lo ss" [A] : St ron g Co mp et it iv e Behav io ur " An n ual pro fit /lo ss" [A] : M o derat e Co m pet itiv e Behav iour " An n ual pro fit /lo ss" [A] : Lo w Com p et it ive Beh av io ur
Figure 12: Annual profit and loss arising from different styles of competitive behaviour
20 M £
20 Contracts/Year
10 M £
15 Contracts/Year
0 £
10 Contracts/Year
0 2 4 6 8 10 12 14
Time (Year)
"Annual profit/loss"[A] : current £
"Annual profit/loss"[B] : current £
contracts completed[A] : current Contracts/Year
[image:14.595.57.518.87.338.2]contracts completed[B] : current Contracts/Year
8. Discussion and Conclusions
Detailed information capture shaped the research process here. Once knowledge elicitation had been completed it was used to structure the formulation of the contracting model described. It was quickly established that competitiveness had to be viewed as a multi-dimensional concept and there needed to be an artefact which could enumerate this concept: the competitive index was the result. Further details are provided in Dangerfield et al [20].
It was established that there are many external and internal contract issues to consider in seeking a strategy for sustained competitiveness. For the contracting enterprise the main external drivers for change are in demand and sector culture. But the actions of rival competitors can affect the economic and financial climate as when, for instance, an established firm offers significant wage rises to skilled employees. Such action can produce contagion effects. Strategy is also moulded by many internal influences. This includes the historical evolution of the enterprise and their traditional norms and practices. Construction firms are apt to operate in a conservative manner based on tried and trusted practices. Carrying this into the modern market place may not provide for a successful future. The ability to make alterations to suit the changing environment is what Green et al [36] refer to as dynamic capabilities: the degree to which the enterprise is acceptable and adaptable to change. Our modelling suggests that contracting enterprises should continually revisit strategic influences; just when they are enjoying good returns and healthy business is the time when the seeds of future problems might be sown.
It is suggested that the behaviour of contracting enterprises should regularly embrace the rehearsal of potential scenarios to provide insight into future strategy for sustained competitiveness in the
construction process. The model described above has enabled policy decisions and practices to be explored at the level of the enterprise to provide insight to strategic direction in both the short and long term. It has the ability to assist those involved in contract procurement by overcoming the associated complexities in strategic delivery of sector projects, whilst minimising unexpected behaviour and allowing a proactive dimension to strategic planning.
The interconnected complex elements that shape construction sector competitiveness were
successfully modelled to provide what is really a strategic guide to assist those involved in contract procurement and execution. The model was formulated from the knowledge of all the influential factors in contract delivery that had been elicited from industry collaborators. It really is a tool for thinking; one that informs an enterprise of possible (but not assured) outcomes. It stands in sharp distinction to the traditional (static and cross-sectional) statistical assessment measures for
competitiveness. The SD model then is not a tool to be used for predicting an enterprise’s competitive future, rather it is one to help shape and design that future. It has the ability to engage industry
participants with regard to possible future outcomes. This information can then inspire strategic planning for sustainability in the context of legal, political, economic, social, technological, environmental or structural issues.
Acknowledgement
This paper reports on a collaborative research project that was conducted as part of an Engineering Physical Science Research Council (EPSRC) and Innovative Manufacturing Research Centres
(IMRC) funded research project: Sustained Competitiveness in the U.K. Construction Sector: a fresh
perspective or ‘The Big Ideas’ for short. Grant References GR/T21813/01, GR/T21806/01 and GR/T21820/01. (See http://www.thebigideas.org.uk) We also thank the many individuals, organisations and companies who enthusiastically participated in the research.
References
[1] J.R. Brightman, C. Eden, K. van der Heijden and D.A. Langford, The development of the construction alternative futures explorer, Automation in Construction 8 (1999) 613–623.
[2] C. Harty, C.I. Goodier, R. Soetanto, S.A. Austin, A.R.J. Dainty and A.D.F. Price, The futures of construction: a critical review of construction futures studies, Construction Management and Economics 25 (5) (2007) 477–493.
[3] C.I. Goodier, R. Soetanto, A.R.J. Dainty, G.D. Larsen and M. Quigley, Towards Sustained Competitiveness in UK Construction: A Multi-Methodological Approach, Proceedings of CIB World Building Congress: Construction for Development, 14-17 May 2007, Cape Town, (2007) pp. 915-927.
[4] R.K. Yin, Case Study Research: Design and Methods, Sage, Thousand Oaks, CA 2002.
[5] R. Fellows and A. Liu, Research Methods for Construction, 2nd Edition, Blackwell Science Ltd
2003.
[6] S.D. Green, G.D. Larsen, and C.C. Kao, Competitive Strategy Revisited: Contested Concepts and Dynamic Capabilities, Construction Management and Economics, 26:1 (2008) 63 – 78.
[7] R. Soetanto, C.I. Goodier, S.A. Austin, A.R.J. Dainty and A.D.F. Price, Scenario planning for construction companies, in: Presented at Construction Management and Economics 25th Anniversary Conference, 16–18 July (2007).
[8] C.I. Goodier, S.A. Austin, R. Soetanto and A.R.J. Dainty, Causal mapping and scenario building with multiple organisations, Accepted for publication, Futures Journal, 42:3 (2010).
[9] D. Drew and M. Skitmore, The Effect of Contract Type and Size on Competitiveness in Bidding, Journal of Construction Management and Economics, Routledge, UK, 15 (5) (1997) 469-489.
[10] C.J. Katsanis and C.H. Davidson, Horizon 2020: How Will North America Build?, International Journal of Architectural Management Practice and Research, 9 (1995)146-162.
[11] S.O. Ogunlana, H. Li and F.A. Sukhera, System Dynamics Approach to Exploring Performance Enhancement in a Construction Organisation, Journal of Construction Engineering and
Management, 129:5 (2003) 528-536.
[12] C.J. Katsanis, System Dynamics Modeling for a Decision Support System for Assessing
Construction Productivity, Proceedings of the 5th Construction Specialty Conference of the
Canadian Society for Civil Engineering, Moncton, New Brunswick, Canada (2003).
[13] J. Kim and K. Reinschmidt, A Dynamic Competition Model for Construction Contractors, Construction Management and Economics, 24 (2006) 955-965.
[15] D.J. Teece, G. Pisano and A. Shuen, Dynamic capabilities and strategic management, Strategic Management Journal, 18(7) (1997) 509–33.
[16] J.D. Sterman, Business Dynamics: Systems thinking and modelling for a complex world, McGraw-Hill, New York, 2000.
[17] D.H. Meadows, D.L. Meadows and J. Randers, Beyond the Limits, Chelsea Green Publications 1992.
[18] D.H. Meadows, J. Randers and D.L. Meadows, Limits to Growth: The 30-Year Update, Chelsea Green Publications 2004.
[19] P.M. Senge, The Fifth Discipline, New York: Doubleday 1990.
[20] B. Dangerfield, S. Green and S. Austin, Understanding Construction Competitiveness: the contribution of system dynamics”, Construction Innovation: Information, Process, Management 10:4 (2010) 408-420.
[21] R. Feurer and K. Chaharbaghi, Defining Competitiveness: a holistic approach, Management Decision, 32:2 (1994) 49-58.
[22] C. Eden and F. Ackermann, Making Strategy: The Journey of Strategic Management, Sage Publications Ltd, London 1998.
[23] J. Barney, Firm resources and sustained competitive advantage, Journal of Management, 17:1. (1991) 99–120.
[24] M.E. Porter, Competitive Strategy—Techniques for Analysing Industries and Competitors, Free Press, New York 1980.
[25] M.E. Porter, The Five Competitive Forces That Shape Strategy, Harvard Business Review, 86:1 (2008) 78 – 93.
[26] S.D. Green, C.F. Harty, A.A. Elmualim, G.D. Larsen and C.C. Kao, On the discourse of construction competitiveness, Building Research and Information, 36:5 (2008) 426-435.
[27] M. Betts and G. Ofori, Strategic planning for competitive advantage in construction, Journal of Construction Management and Economics 10(6) (1992) 511 – 532.
[28] A. Fleming, G. Aouad, P. Barrett, B. Dangerfield, M. Kagioglou and P. McDermott, A Review of System Dynamics and its Potential Application to the UK Construction Sector, Proceedings of CIB W65 Conference, Delft, The Netherlands (2006).
[29] B. Dangerfield, M.Quigley and J. Kearney, A Dynamic Policy Model to Manage Temporal Performance Amongst Contracting Firms in a Competitive Situation, In: Proceedings of the International Conference of the System Dynamics Society, Athens (2008).
[30] M. Quigley and R. Kearney, System Dynamics Modelling of Competing UK Construction Firms, in: Proceedings of the CIB (W92 Procurement Systems), Conference: Interdisciplinarity in Built Environment Procurement, Hunter Valley, Australia (2007).
[31] N. Gilkinson, A. Fleming and G. Aouad, The Identification of Contributory Drivers for
Competitive Contract Delivery. The SCRI International Research Symposium, The Lowry, Salford Quays, Greater Manchester, U.K. Jan 27th – 28th (2009).
[32] P.M. Hillebrandt, J. Cannon and P. Lansley, The Construction Company in and out of Recession, Macmillan, London 1995.
[33] D. Runge, Towards Understanding System Dynamics, D-Memo, System Dynamics Group, MIT 1977.
[35] K. Sha, J. Yang and R. Song, Competitiveness assessment system for China’s construction industry, Building Research and Information, 36:1. (2008) 97-109.
[36] S.D. Green, C.C. Kao and G.D. Larsen, Contextualist research; iterating between methods while following an empirically grounded approach, ASCE Journal of Construction Engineering and Management 136 (2010) 117.
[37] A.D.F. Price, The strategy process within large construction organisations, Engineering, Construction and Architectural Management, 10:4 (2003) 283–296.
Table 3. Footnotes
1
![Figure 2: Internal and external competitive interconnected influences [28]](https://thumb-us.123doks.com/thumbv2/123dok_us/8715018.882832/4.595.52.293.49.293/figure-internal-external-competitive-interconnected-influences.webp)
![Figure 3: A high level map of the contracts model [29]](https://thumb-us.123doks.com/thumbv2/123dok_us/8715018.882832/5.595.52.410.133.343/figure-high-level-map-contracts-model.webp)