International Journal of Emerging Technology and Advanced Engineering
Website: www.ijetae.com (ISSN 2250-2459, ISO 9001:2008 Certified Journal, Volume 9, Issue 10, October 2019)
36
The Minimum Fluidization Velocity and Bed Fluctuation Ratio
in Air-Solid Systems
A. Suryanarayana
1, B. Lakshman
2, G. Manohar
3, T. Hanumanth
4, M. Ramadevi
5Abstract-- There are many equations available to predict minimum fluidization velocities of solid particles in air-solid systems in cylindrical columns.Experiments were carried out for minimum fluidization velocities of solid particles and compared with existing equations.Based on error,conclusions are drawn for which type of materials,which equations are agreeing well.Based on Rayleigh’s method and dimensional analysis and experiments,an equation is formulated to predict the fluctuation ratio of single size particles in cylindrical columns.
I. INTRODUCTION
Fluidization(1):Minimum fluidization velocity is an important parameter used to characterize the hydrodynamic behaviour of a material inside the fluidized bed.The density and size change the minimum fluidization velocity.In fluidization,fine granular solids are transformed into a fluid like state through contact with a fluid.When a liquid or gas is passed at low velocity up through a bed of solid particles,the particles do not move.If the fluid velocity is increased slowly,the pressure drop and the drag on individual particles increases and eventually the particles start to move (minimum fluidization velocity)and become suspended in the fluid.
The chief advantages of fluidization are: It ensures contact of the fluid with all parts of solid particles, prevents segregation of the particles by thoroughly agitating the bed, minimizing the temperature variations even in larger reactor and ensure high heat and mass transfer rates. Fluidization finds applications: In the catalytic cracking of reactors in petroleum industry, drying and sizing of crystals, transportation of solids, coating of metal surfaces with plastic materials, in roasting of ores and synthesis reaction. The disadvantages of fluidization are: Greater power requirement, high beakage of solid particles, serious erosion of pipe lines, containers and for bigger size reactors.
II. FLUCTUATION RATIO
It is the ratio of highest level to lowest level which the top of the fluidized bed occupies for any gas flow rate and is a quantification of the fluidization quality.A lower value of the fluctuation ratio is indicative of improved fluidization quality with less fluctuation ratio at the top of the bed in fluidized condition.
Minimum Fluidization velocity Equations Available in literature For Cylindrical Columns (2)
1. Wen and Yu:U mf=µ g[(1135.7+0.048Ar)1/2-33.7]/(p g d p)
2.Leva et.al:U mf=7.39d p1.82 g(p p –p g) 0.94 /p g0.94
3.Goroshoko et.al:U mf=[µ g /(p g d p)]*[Ar/(1400+5.2Ar ½)]
4.Bena:Umf= [µf/(p g d p)]*[0.00138Ar/(Ar+19)0.11)]
5.Rowe and Henwood:U mf=0.008d p2(p p –p g)g/µ g
6.Miller and Logwinuk(3):U mf=0.00125 d p2(p p- p g)g p g0.10 /µ g
7.Frantz:Umf=0.00106 d p2(p p –p g)g/µ g
8.Davies and Richardson:U mf=0.00078 d p 2(p p-p g)g/u g
9.Pillai and Raja Rao:U mf=0.000701d p2(p p-p g)g/µg
10.Saxena and Vogel:Umf=µ g[(25.28 +0.0571 Ar) ½ -25.25]/ (p g d p)
11.Babu:U mf=µ g[(25. 25 2 +0.0651Ar)1/2 -25.25/(p g d p)
International Journal of Emerging Technology and Advanced Engineering
Website: www.ijetae.com (ISSN 2250-2459, ISO 9001:2008 Certified Journal, Volume 9, Issue 10, October 2019)
37
13.Doichev and Akhmakov:U mf=µ g(0.00108* Ar 0.947 )/(p g d p)
14.Thong Limp:U mf=µ g[31.6 2 +0.042Ar) ½ -31.6]/( p g d p )
Archimedes Number (Ar)=d p3 (p p –p g)g P g /µ g2
III. FLUCTUATION RATIO EQUATION
Based on Rayleigh’s method and dimensional analysis,the fluctuation ratio in cylindrical fluidized column is a function of the variables:G of,G mf,D c,d p,pp,hs,p f .The
final equation is:
R=1.432(G of/G mf)0.0182 (Dc/h s)0.00627 (dp/ hs)0.0211 (pp/pf) -0.00798
Earlier equation is(4):=1.95(dp/D c)0.04 (D c/h s) 0.04 (p f/p
s)0.04 [(Gf –G mf)/G mf] 0.05
IV. EXPERIMENTAL
The various parts in the experimental set up are:1-Blower/compressor (for air input);2-Air flow control valve(to control air flow rate of the fluidized column);3-Orfice meter (to measure air flow rate);4-U-Tube manometer (for measuring air flow rate );5-Mesh covered at the bottom of column(not to allow solids to fall down from the bottom of the column);6-Fluidized column( 1 meter length and 2.8 cm/2.5 cm diameter);7-Mesh cover at the top of the column (not to allow the particles to go out of the column).
PROCEDURE:1- Fill the column to a height of 20 cms to
25 cms height with the solid panicles from the top of the column;2-Use blower or compressor to get the desired flow rate of air;3-Adjust the flow rate of air using the air flow control valve until the solid particles just vibrate in the column(minimum fluidization);4-Note the manometer reading (gives the flow rate of air);-Switch off the blower or compressor ,change the material in the column and continue for next observation;6-The height of the bed is not effecting the minimum fluidization velocity.
V. RESULTS
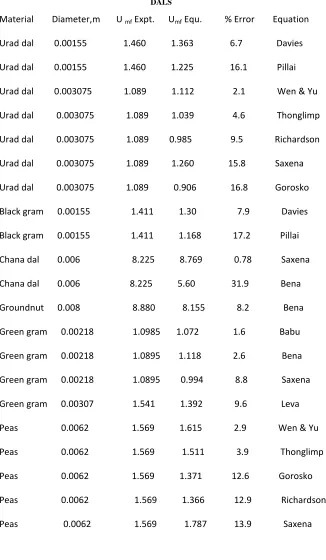
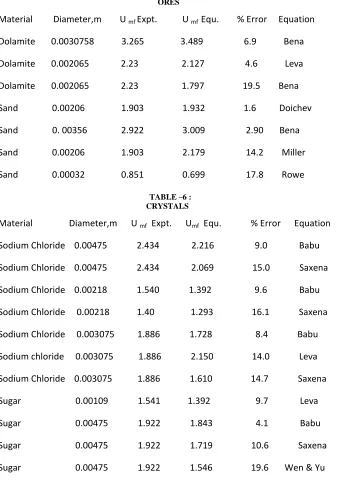
The observations of cereals are shown inTable-1.The observations of dals are shown in Table-2.The observations of seeds are shown in Table-3.The observations of metals are shown in Table-4.The observations of ores are shown in Table-5.The observations of crystals are shown inTable-6.The scope of experiments are shown in table-7.The comparision of experimental fluctuation ratios and equation values are shown in Table-8.
VI. CONCLUSIONS:CEREALS
The equations of Pillai,Miller,Wen and Yu and Frantz are agreeing well(less than 10% error).DALS:The equations of Davies,Saxena,Bena,Wen and Yu and Richardson and Thong Limp are agreeing well.SEEDS:The equaions of Bena,Goroshko,Richardson,Wen and Yu and
Babu are agreeing well.METALS:The equaionsof
Saxena,Babu and Franz are agreeing well.
ORES: The equations of Bena,Doichev and Miller are agreeing well.CRYSTALS:The equations of Babu and Leva are agreeing well.
In general for all types of materials,there is no single equation agreeing well for minimum fluidization velocity with less than 10% error.
The error in fluctuation ratio equation is less than 10%.
NOMENCLATURE
Ar Archimedis Number
D c Column diameter,m
Dp Particle diameter,m
G of ,G f Operating fluidization velocity,m/s
G mf Minimum fluidization velocity,m/s
G Gravitational constant,m/Sq.s
h s Static bed height,m
U mf Minimum fluidization velocity,m/s
µ s Viscosity of gas,Kg/m.S
p f,p g Density of gas,Kg./Cubic.m
p p, ps Density of solid particle,Kg/Cubic m.
REFERENCES
[1] Kunii, D. and Levenspiel,O.Fluidization Engineering,Second Ediion, Butterworth-Heinamann,Boston,U.S.A.(1991).
[2] Coltters, R and Rivas ,A.L.Minimum fluidizaion velocity correlations in particulate systems,Powder technology,Vol 147,p34-48 (2004).
[3] Miller, C.O. and Logwinuk, A. K. Ind. Engg.Chem.,43(1951)p1220. [4] Singh, R.K. and Roy, G. K.Pediction of bed fluctuation ratio for gas
International Journal of Emerging Technology and Advanced Engineering
Website: www.ijetae.com (ISSN 2250-2459, ISO 9001:2008 Certified Journal, Volume 9, Issue 10, October 2019)
38
About the AuthorsDr. A. Suryanarayana is working as Prof.and HOD of Chemical Engg. Dept. in RRS College of Engg. and Technology, Hyderabad.He retired as Prof. and HOD of Chem. Engg. of N.I.T.Roukela.He was principal of TRRECW, Hyderabad.
Mr. B. Laxman is working as software Engineer in Wipro, Hyderabad.
M. T. Hanumanth and Mr.G.Monohar are working in a Pharmaceutical industry in Hyderabad.
M. Ramadevi is Assistant Prof. In the Dept. Of Chem.Engg.of RRS College of Engg. and Tech., Hyderabad-502300.
TABLE-1: CEREALS
Material Diameter,m U mf expt. U mf Equ. % Error Equation
Wheat 0.00282 1.569 1.454 7.3 Bena
Wheat 0.00282 1.569 1.168 25.6 Babu
Rice 0.00185 1.540 1.588 3.1 Pillai
Rice 0.00185 1.540 1.415 8.1 Miller
Rice 0.00185 1.540 1.767 14.7 Davies
Rice 0.00129 0.770 0.772 0.30 Pillai
Rice 0.00129 0.770 0.690 10.4 Miller
Rice 0.00129 0.770 0.859 11.5 Davies
Rice 0.0015 1.089 0.933 14.3 Miller
FingerMillet 9.25*10-5 0.611 0.843 27.6 Frantz
Maize 0.00843 1.855 1.859 1.2 Thonglimp
Maize 0.00843 1.885 1.988 5.4 Wen & Yu
Maize 0.00843 1.885 1.739 7.7 Richardson
Maize 0.00843 1.885 1.708 9.4 Goros
Maize 0.00843 1.885 2.188 16.1 Saxena
Sabu dhana 0.003 5.59 5.64 0.8 Frantz
Whea Ravva 0.00142 0.784 0.794 1.3 Doicher
Wheat Ravva 0.00142 0.784 0.734 6.4 Babu
Wheat Ravva 0.00142 0.784 0.856 9.1 Miller
International Journal of Emerging Technology and Advanced Engineering
Website: www.ijetae.com (ISSN 2250-2459, ISO 9001:2008 Certified Journal, Volume 9, Issue 10, October 2019)
[image:4.612.49.375.147.707.2]39
TABLE ---2:DALS
Material Diameter,m U mf Expt. Umf Equ. % Error Equation
Urad dal 0.00155 1.460 1.363 6.7 Davies
Urad dal 0.00155 1.460 1.225 16.1 Pillai
Urad dal 0.003075 1.089 1.112 2.1 Wen & Yu
Urad dal 0.003075 1.089 1.039 4.6 Thonglimp
Urad dal 0.003075 1.089 0.985 9.5 Richardson
Urad dal 0.003075 1.089 1.260 15.8 Saxena
Urad dal 0.003075 1.089 0.906 16.8 Gorosko
Black gram 0.00155 1.411 1.30 7.9 Davies
Black gram 0.00155 1.411 1.168 17.2 Pillai
Chana dal 0.006 8.225 8.769 0.78 Saxena
Chana dal 0.006 8.225 5.60 31.9 Bena
Groundnut 0.008 8.880 8.155 8.2 Bena
Green gram 0.00218 1.0985 1.072 1.6 Babu
Green gram 0.00218 1.0895 1.118 2.6 Bena
Green gram 0.00218 1.0895 0.994 8.8 Saxena
Green gram 0.00307 1.541 1.392 9.6 Leva
Peas 0.0062 1.569 1.615 2.9 Wen & Yu
Peas 0.0062 1.569 1.511 3.9 Thonglimp
Peas 0.0062 1.569 1.371 12.6 Gorosko
Peas 0.0062 1.569 1.366 12.9 Richardson
International Journal of Emerging Technology and Advanced Engineering
Website: www.ijetae.com (ISSN 2250-2459, ISO 9001:2008 Certified Journal, Volume 9, Issue 10, October 2019)
40
TABLE—3:SEEDS
Material Diameter,m U mf Expt. Umf Equ. % Error Equation
Tamarind 0.008 8.652 9.06 4.7 Bena
Tamarind 0.008 8.652 7.303 15.6 Leva
Soap nut 0.011 3.268 3.17 3.0 Gorosko
Soap nut 0.011 3.268 3.17 3.0 Richardson
Soap nut 0.011 3.268 3.631 11.1 Wen & Yu
Berry seeds 0.0073 2.218 1.963 11.5 Babu
Berry seeds 0.00405 1.569 1.291 11.7 Babu
Berry seeds 0.00405 1.569 1.808 15.2 Leva
Berry seeds 0.0066 2.210 1.859 15.9 Babu
Berry seeds 0.00405 1.569 1.291 17.7 Saxena
Berry seeds 0.0066 2.21 1.736 21.4 Saxena
TABLE-4 : METALS
Material Diameter,m U mf Expt. U mf Equ. % Error Equation
Glass balls 0.00747 3.076 3.100 0.80 Babu
Glass balls 0.001107 1.648 1.727 4.80 Frantz
Glass balls 0.00747 3.076 2.900 5.70 Saxena
Glass balls 0.00747 3.076 2.637 14.20 Wen & Yu
Aluminium 0.00380 3.650 2.233 38.90 Babu
Steel balls 0.00378 4.461 3.851 13.70 Babu
Steel balls 0.00378 4.461 3.600 19.30 Saxena
Steel balls 0.00613 5.655 4.9700 12.10 Babu
Steel balls 0.00613 5.655 4.651 17.80 Saxena
Steel balls 0.00774 6.300 5.606 11.00 Babu
Steel balls 0.00774 6.300 5.247 16.7 Saxena
Steel balls 0.0062 6.00 5.021 16.30 Babu
Steel balls 0.00462 5.459 4.358 20.20 Saxena
Steel balls 0.00462 5.459 4.659 14.60 Babu
International Journal of Emerging Technology and Advanced Engineering
Website: www.ijetae.com (ISSN 2250-2459, ISO 9001:2008 Certified Journal, Volume 9, Issue 10, October 2019)
41
TABLE—5 :ORES
Material Diameter,m U mf Expt. U mf Equ. % Error Equation
Dolamite 0.0030758 3.265 3.489 6.9 Bena
Dolamite 0.002065 2.23 2.127 4.6 Leva
Dolamite 0.002065 2.23 1.797 19.5 Bena
Sand 0.00206 1.903 1.932 1.6 Doichev
Sand 0. 00356 2.922 3.009 2.90 Bena
Sand 0.00206 1.903 2.179 14.2 Miller
Sand 0.00032 0.851 0.699 17.8 Rowe
TABLE –6 : CRYSTALS
Material Diameter,m U mf Expt. Umf Equ. % Error Equation
Sodium Chloride 0.00475 2.434 2.216 9.0 Babu
Sodium Chloride 0.00475 2.434 2.069 15.0 Saxena
Sodium Chloride 0.00218 1.540 1.392 9.6 Babu
Sodium Chloride 0.00218 1.40 1.293 16.1 Saxena
Sodium Chloride 0.003075 1.886 1.728 8.4 Babu
Sodium chloride 0.003075 1.886 2.150 14.0 Leva
Sodium Chloride 0.003075 1.886 1.610 14.7 Saxena
Sugar 0.00109 1.541 1.392 9.7 Leva
Sugar 0.00475 1.922 1.843 4.1 Babu
Sugar 0.00475 1.922 1.719 10.6 Saxena
Sugar 0.00475 1.922 1.546 19.6 Wen & Yu
[image:6.612.50.393.147.645.2]International Journal of Emerging Technology and Advanced Engineering
Website: www.ijetae.com (ISSN 2250-2459, ISO 9001:2008 Certified Journal, Volume 9, Issue 10, October 2019)
42
TABLE—7 :SCOPE OF EXPERIMENTS
Material Density,Kg/Cu.m Material Densiy,Kg/Cu.m
Air 1.205 Berry Seeds 1100
Black Gram 1316 Coriander Seed 845
Dolamite 2570 Finger Millet(Raghulu) 1272 Glass Balls 2570 Green Gram 1364
Iron 7100 Kerosene 860
Lime Stone 1300 Maize 1275
Millet(Jonnalu) 1356 Mustard Seed 430
Peas 800 Pearl Millet(Sajjalu) 1250
Rice 1248 Soap Nut 1417
Sago 1296 Sand 1600
Steel Balls 7800 Urad Bean 1380
Water 1000 Wheat 1387
TABLE—8 :
COMPARISION OF FLUCUATION RATIOS
G of G mf D c h s h min h max d p p p p f r Expt. r equ. % Error
0.30 0.20 0.019 0.09 0.47 0.62 0.02 1356 1.205 1.341 1.247 7.0
0.30 0.45 0.019 0.105 0.53 0.72 0.0155 1316 1.205 1.3584 1.235 9.1
0.15 0.10 0.019 0.13 0.48 0.62 0.0021 4300 1.205 1.2916 1.247 3.5
4.40 2.20 0.025 0.139 0.36 0.45 0.0021 1250 1.205 1.20 1.271 1.7
9.75 6.50 0.025 0.062 0.19 0.26 0.00786 7800 1.205 1.3684 1.274 6.9
0.60 0.30 0.025 0.09 0.27 0.78 0.00613 2160 1.205 1.2962 1.252 2.1
4.40 2.20 0.019 0.08 0.76 0.35 0.0021 7800 1.205 1.273 1.341 5.3
9.0 6.0 0.019 0.08 0.76 0.92 0.00462 7800 1.205 1.2962 1.270 2.0
0.60 0.40 0.019 0.10 0.67 0.810 0.00774 7800 1.205 1.2089 1.243 2.8
0.70 0.50 0.019 0.18 0.44 0.56 0.00206 2500 1.20 5 1.2727 1.290 1.4