Geosciences Theses Department of Geosciences
4-27-2010
Mineralogical and Geochemical Indicators of Subaerial
Mineralogical and Geochemical Indicators of Subaerial
Weathering in the Pozzolane Rosse Ignimbrite (Alban Hills
Weathering in the Pozzolane Rosse Ignimbrite (Alban Hills
Volcanic District, Italy)
Volcanic District, Italy)
Jennifer M. Dickie
Georgia State University
Follow this and additional works at: https://scholarworks.gsu.edu/geosciences_theses Part of the Geography Commons, and the Geology Commons
Recommended Citation Recommended Citation
Dickie, Jennifer M., "Mineralogical and Geochemical Indicators of Subaerial Weathering in the Pozzolane Rosse Ignimbrite (Alban Hills Volcanic District, Italy)." Thesis, Georgia State University, 2010.
https://scholarworks.gsu.edu/geosciences_theses/23
ITALY)
by
JENNIFER M. DICKIE
Under the direction of Dr. Daniel Deocampo
ABSTRACT
The Pozzolane Rosse ignimbrite [PR] (457±4 ka) in the Alban Hills Volcanic District, Rome,
Italy was exposed ~ 40 ka prior to a subsequent volcanic event which coverd it entirely. XRF, XRD, and clay separation results from PR samples from INGV and CA1 boreholes and Castel di Leva quarry show evidence of paleopedogenesis. All locations display loss of base cations, loss
of K is consistent with XRD datat showing dissolution or alteration of leucite to analcime. Accumulation of Al and high L.O.I. support XRD evidence of 1:1 clay species at upper depth. Data suggest alteration extent can be determined by geochemistry. Hydrothermal alteration is
possible mixing with the underlying Vallerano Lava.
ITALY)
by
JENNIFER M. DICKIE
A Thesis Submitted In Partial Fulfillment of Requirements for the Degree of Master of Science
In the College of Arts and Sciences Georgia State University
Copyright by Jennifer M. Dickie
ITALY)
by
JENNIFER M. DICKIE
Committee Chair: Dr. Daniel M. Deocampo
Committee: Dr. W. Crawford Elliott Dr. Timothy E. La Tour
Electronic Version Approved:
Office of Graduate Studies
College of Arts and Sciences Georgia State University
ACKNOWLEDGEMENTS
Thank you to Dr. Deocampo who supplied samples and office space, who was endlessly available to teach, answer questions and speculate about interesting results and who, despite having a very busy year himself, was always sure I could finish ―on time.‖ Thank you to Dr.
Elliot who was my first contact at Georgia State University in the geology department and who encouraged me to move forward with my mid-life career change; and for his willingness to drop
anything at anytime to help out with XRD trouble or questions about clay. Thank you to Dr. La Tour for support in the XRF lab with sticky glass and for his contagious interest in quantum
Table of Contents
ACKNOWLEDGEMENTS ... iv
LIST OF TABLES ... vii
Chapter 1 INTRODUCTION ... 1
1.1 Geologic Setting ... 2
1.1.1 Italian Cenozoic Volcanism ... 2
1.1.2 Roman Comagmatic Province ... 4
1.1.3 Rome’s Volcanic Centers ... 6
1.1.4 Alban Hills Pleistocene Volcanism ... 8
1.2 Pozzolane Rosse Ignimbrite ... 8
1.2.1 Pozzolane Rosse Alteration ... 10
1.3 Objective... 12
Chapter 2 METHODS ... 13
2.1 Samples ... 13
2.1.1 Sample locations ... 13
2.2 Bulk Mineralogy ... 14
2.3 Geochemistry ... 14
2.4 Clay Mineralogy ... 15
Chapter 3 RESULTS ... 16
3.1 Mineralogy Results from X-Ray Diffraction ... 16
3.2 Geochemical Data from X-Ray Fluorescence ... 23
3.3 Clay Mineralogy ... 33
Chapter 4 Discussion ... 40
4.2 INGV Alteration ... 44
4.3 Alteration Facies ... 49
4.4 Hydrothermal alteration... 51
4.5 CA1 basal samples and Vallerano Lava ... 55
4.6 Future Work ... 58
Chapter 5 Conclusions ... 60
Chapter 6 References ... 62
Chapter 7 Appendices... 68
Appendix A: Roman Area Stratigraphy ... 68
Appendix B: Mineral Occurrences as determined by XRD ... 71
Castel di Leva quarry samples contain clinopyroxene, leucite, analcime, and biotite as reported by Jackson et al. (2010) ... 71
Appendix C: Alteration facies of the Pozzolane Rosse ignimbrite ... 72
LIST OF TABLES
Table 1-1 Volcanic stratigraphy ... 7
Table 3-1 Major element chemical compositions of Pozzolane Rosse Ignimbrite from INGV core. ... 25
Table 3-2 Major element chemical compositions of Pozzolane Rosse Ignimbrite from CA1 core at Santa
Maria delle Mole. ... 26
Table 3-3 Major element chemical compositions of Pozzolane Rosse Ignimbrite at Castel di Leva Quarry
(Data from Jackson, et al., 2009) ... 27
Table 4-1 Molar ratios of base oxides/silica* for altered Pozzolane Rosse to Average** base oxides/silica
of Trigila’s juvenile scoria. ... 42
Table 4-2 Vallerano major oxide geochemistry ... 57
LIST OF FIGURES
Figure 1-1 Alban Hills Volcanic district ... 3
Figure 1-2 Magmatic Provinces in Italy. ... 5
Figure 1-3 Cross-section of Alban Hills magma chamber ... 5
Figure 1-4 Total Alkali Silica (TAS) diagram.) ... 6
Figure 3-1 XRD plots for INGV-03, -06, & -09. ... 19
Figure 3-2 XRD plots for CA1-02 & -06. ... 20
Figure 3-3 XRD plots forCA1-03 & -04. ... 21
Figure 3-4 XRD plots for CA1-13 & -17. ... 22
Figure 3-5 Zr vs. Zr/TiO2. . ... 28
Figure 3-6 mBases/mSiO2 and mBases/mAl2O3 vs. depth(m). . ... 29
Figure 3-7 Loss of base cations (wt%) vs. SiO2/Al2O3. ... 30
Figure 3-8 mK2O/mSiO2 vs. Depth. ... 31
Figure 3-9 mSiO2/mR2O3 (mAl2O3+mFe2O3+mTiO2) vs. Depth. ... 32
Figure 3-10 Al2O3 vs. Depth. ... 33
Figure 3-11 Oriented clay mounts INGV-03 air dried and ethylene glycol solvated. . ... 35
Figure 3-12 Oriented clay mounts INGV-06 air dried and ethylene glycol solvated. . ... 36
Figure 3-13 Oriented clay mounts CA1-02 air dried and ethylene glycol solvated. ... 37
Figure 3-14 Oriented clay mounts CA1-06 air dried and ethylene glycol solvated. ... 38
Figure 3-15 Oriented clay mounts CA1-17 air dried and ethylene glycol solvated ... 39
Figure 4-1 Plagioclase index of alteration [PIA]. ... 43
Figure 4-2 L.O.I vs. Al2O3. ... 44
Figure 4-4mBases/mSiO2 with adjusted INGV sample depths (+4m). ... 47
Figure 4-5 mSiO2/mR2O3 with adjusted INGV sample depths (+4m). . ... 48
Figure 4-6 Al2O3 (wt%) with adjusted INGV sample depths (+4m) .. ... 49
Figure 4-7 pe-pH diagram showing the predominant fields of pyrite and jarosite. ... 54
Figure 4-8 Trace element plot showing losses from CA1-04. ... 54
Chapter 1INTRODUCTION
With their rich volcanic soils and unpredictable nature volcanoes are life sustaining, fascinating, and dangerous. The study of volcanic landscapes can reveal glimpses into past
volcanic activity resulting in better understanding of currently active and quiescent volcanoes. Research in volcanic regions can help us answer questions about frequency of eruption, evolving
geomorphology, weathering and alteration of volcanic deposits, ancient soil development, paleoclimates and historic human-land interaction.
In recent years the Alban Hills Volcanic District [AHVD] of western central Italy has
been the target of extensive study (Figure 1-1). Stratigraphic mapping and hazard assessment reveal information regarding the AHVD eruptive history. New geochronologic data show that
the volcano is not extinct, but rather quiescent (Karner et al., 2001; Giordano et al., 2006).
Structural data reveal new insight into the extensional regimes which impact volcanism along the Tyrrhenian margin (Serri et al., 2001; Acocella & Funiciello, 2006). Petrographic and
geochemical analyses applied in geoarcheology draw connections between the region’s many volcanic deposits and ancient Roman monuments (Jackson & Marra, 2006; DeRita &
Giampaolo, 2006; Jackson et al., 2007). Geochemistry and paleopedology research explores paleosol development and chemical/mineralogical changes within certain AHVD ignimbrites in order to reconstruct the region’s mid-Pleistocene paleoclimate (Deocampo et al., in review).
Pozzolane Rosse is a very large ignimbrite or pyroclastic flow deposit in the AHVD which has been extensively described (Giordano & Dobran, 1994; Trigila, 1995; Karner et al.,
2001; Giordano et al., 2006; Marra et al., 2009) and is at the center of some of this work
Rosse is commonly found to be geochemically altered from its original, primary chemical
composition (Jackson et al., 2010, Deocampo et al., in review) therefore it is likely that the core and outcrop samples of Pozzolane Rosse which will be analyzed in this project were similarly altered. The purpose of this study is to determine if the alteration of Pozzolane Rosse carries
distinct geochemical trends or markers that could indicate aspects of incipient paleosol
development or other mechanisms of alteration. The geochemical and mineralogical analysis of
Pozzolane Rosse contributes to the growing data base around this important ignimbrite as well as contributing to the larger understanding of volcanic environment lithology and alteration.
1.1 Geologic Setting
1.1.1 Italian Cenozoic Volcanism
The present Italian peninsula is the result of a host of varied and interconnected processes. Its late Cenozoic origin can be traced to the complex closing of the Tethys Sea between Europe and Africa that produced the Apennine Orogeny (Beccaluva et al., 2007).
Subsequent subduction, accretion, back arc extension, magmatism, and uplift combined with eustatic changes over the last 600,000 years have resulted in the current complex nature of the
Italian geologic setting.
Whereas details of the origin of Cenozoic Italian volcanism have been debated, it is generally accepted that the volcanism evolves from westward dipping subduction and back arc
extension (Beccaluva et al., 1991; Conticelli & Peccerillo, 1992; Serri et al., 2001; Corti et al., 2002, 2006 Acocella & Funiciello, 2006). Italian volcanic rocks range from mafic to felsic, from
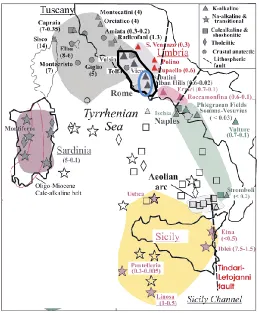
Figure 1-1 Alban Hills Volcanic district southeast of Rome with Santa Maria delle Mole and INGV boreholes indicated by dots (•), Castel di Leva quarry noted by mine symbol ( ) and Trigila’s Juvenile Scoria samples
noted by (Ts). (after Jackson et al., 2010)
[image:15.612.132.480.81.612.2]This peculiar combination is common around the Mediterranean Basin and is generally
accepted to have been produced by partial melting of peridotite modified by metasomatism (Beccaluva et al., 1991; Conticelli & Peccerillo, 1992; Conticelli et al., 2007). The nature of the mantle sources and the nature and provenance of the metasomatic fluids however, are still
debated (Beccaluva et al., 1991; Serri et al., 2001; Conticelli et al., 2007, among others). Despite the complexities, the Italian peninsula can be divided into magmatic regions based on
characteristics of volcanic deposits that reflect unique combinations of magma, metasomatic agents, and crustal contamination (Figure 1-2).
1.1.2 Roman Comagmatic Province
Potassium-rich volcanics found in the Roman Comagmatic Provinces [RCP] (Seen as light gray in Figure 1-2; Appleton, 1972) are perched on thrusted layers of post-orogenic
siliciclastic sediment and the former Mesozoic-Cenozoic carbonate rich ocean floor (Figure 1-3, Conticelli & Peccerillo, 1992; Conticelli et al., 2007; Giordano et al., 2006). These volcanoes are located along the fractures defining the uplifting Apennine Mountains and sinking
Tyrrhenian Sea, known as the Tyrrhenian margin (Bullard, 1984, Serri, 2001). Petrologic and geochemical studies of the RCP reflect a fractionated, metasomatized mafic-mantle source mixed
with carbonate-bearing contaminants (Conticelli & Peccerillo, 1992; Gaeta et al., 2006; Freda et al., 2008).This combination produces an unusual and characteristic potassium rich/silica
undersaturated compositon(Serri, et al., 2001; Conticelli et al., 2007). Unaltered strata of the
Figure 1-2 Magmatic Provinces in Italy. Roman Comagmatic Province is shown in light gray outlined in black with Alban Hills Volcanic District and Mt. Sabatini circled in blue. Ages (in Ma) are given in parentheses. Dashed lines indicate orogenic faulting. [after Peccerillo, 2008].
Figure 1-3Cross-section of Alban Hills magma chamber emplaced in carbonate rich crustal basement rock (after Marra, 2001).
Alban Hills
Volcanic Rocks
Plio-Pleistocene sedimentary rocks Meso –Cenozoic Carbonatic Basement
Triassic rocks and Crystalline Basement
Magmatic chamber
Figure 1-4 Total Alkali Silica (TAS) diagram. U-series (light gray) includes tephrites and phonolite, S-series (dark gray) includes trachy-basalt through trachyte. (after LaBas et al., 1986)
1.1.3 Rome’s Volcanic Centers
Among the RCP volcanoes, two volcanic centers, Mount Sabatini and the Alban Hills
Volcanic District (AHVD), deposited volcanic material over the area that is today the modern city of Rome (Figure 1-1). The metropolitan area of Rome is underlain by hundreds of meters of
volcanic material deposited over the last 600,000 years. While details of the complex
city here along with countless interspersed ash-falls and lava-flows (Table 1-1, see Appendix A
for more complete stratigraphy). Many of the deposits from the two volcanic centers interfinger and can be difficult to differentiate, although mineralogy differs between Mount Sabatini
volcanic deposits which contain potassium feldspar--sanidine and the Alban Hills volcanics
which contain the feldspathoid--leucite (Karner et al., 2001; Jackson & Marra, 2006).
Table 1-1 Volcanic stratigraphy: Formal units from the 1:10,000 geologic map of Italy are shown in bold (Parotto, 2008). For reference former and/or original names follow in italics. Isotopic 40K-40Ar and 40Ar-39Ar dates are included where available: (1) Funiciello et al. 2003; (2) Karner et al. 2001; (3) Trigila et al. 1995; (4) Cioni et al. 1993; (5) Marra et al. 2003; (6) Marra et al. 1998; (7) Marra et al. 2009
Volcanic Center Name Date
AHVD Via dei Laghi depoits from 200 ka (Giordano 2005)
AHVD Peperino di Albano (36 ± .1ka)2
AHVD Campi di Annibale succession
AHVD Rocca di Papa succession
Mt. Sabatini Unita della via Nomentana, Tufo Giallo di Scrofano (285±1 ka) 2
AHVD Tuscolo Succession (includes Pantano Borghese lava, Saponara lava and Castiglione Crater)
(300-260 ka)2,5
AHVD Formazione di Madonna degli Angeli
AHVD Pozzolanella Unit, Pozzolane Superiori, Pozzolane Grigie, Tufo a occhio di pesce, Tufo di Giulianello,
(366±2 ka)2
AHVD Tufo Lionato Unit, Tufo Lionato litoide (355±2 ka)2
AHVD Formazione di Villa Senni, Villa Senni Eruptive Unit [VSEU] (357±2 ka)2 (338±8 ka)3 (365±4 ka)7 AHVD Formazione di Fontana Centogocce, Centogocce succession
AHVD Pozzolane Nere, Pozzolane Medie (407±4 ka)2 Mt. Sabatini Tufi stratificati varicolori di La Sorta (416±6 ka)2 Mt. Sabatini Tufo Rosso a Scorie Nere, Tufo Rosso a Scorie Nere (449±1 ka)2 (430 ka)4
AHVD Conglomerato Giallo Unit
AHVD Corcolle Succession
AHVD Pozzolane Rosse, Pozzolane inferiori, Pozzolane di S. Paolo (457±4 ka)2
AHVD Lave di Vallerano (460±4 ka)2
AHVD Genazzano Unit
AHVD Unita di Casale del Cavaliere, Tufi Antichi, Pisolitic Tuff
Mt. Sabatini Tufi stratificati varicolori di sacrofano (514±3 ka to 488±2 ka)2
Mt. Sabatini Tufo Terroso con Pomici Bianche (488 ±2 ka)2
Mt. Sabatini Grottarossa Pyroclastic Sequence (518±5 ka)2 Mt. Sabatini Upper Tufo Giallo della Via Tiberina (548±4 ka)2 Mt. Sabatini Lower Tufo Giallo della Via Tiberina, Tufo Giallo di Prima Porta (561±1 ka)2
AHVD Unita del Palatino, Tufi Antichi,Tufi pisolitici (533±5 ka)2 Mt. Sabatini Unita della Via Tiberina, Tufo Giallo della Via Tiberina 560-540 ka2 AHVD Unita di Tor de’ Cenci, Tufi Antichi, Pisolitic Tuff (561±1 ka)2
[image:19.612.73.540.281.703.2]1.1.4 Alban Hills Pleistocene Volcanism
The Alban Hills Volcanic district is a composite volcano which was active from both central and peripheral vents throughout its 600,000 years of activity (Giordano et. al., 2006). With its proximity to the AHVD and Mount Sabatini, the volcanic stratigraphy in the Roman
region is complex. Recently, however, major works by Karner et al. (2001), Giordano et al. (2006) and Marra et al. (2009) have greatly clarified the Roman stratigraphy. The Alban Hills Volcanic District’s composite nature has allowed it to be classified stratigraphically by eruption
type and/or edifice. The early effusive history of the Alban Hills from 600 ka to 355 ka (Karner et al., 2001) includes the largest volumes of ignimbrites in the volcano’s history, covering an
area of up to 1600 km2 up to 200m thick in places and resulting in an overall ejected volume of approximately 300km3 (Giordano et al., 2006). The products of this early activity are alternately
called the Tuscolano-Artemisio Phase (De Rita et al., 1992; Karner et al., 2001; Marra et al., 2009) or the Vulcano Laziale lithosome (Giordano et al., 2006); associated deposits include both
volcaniclastic sediment and lava flows. The nature and volume of the deposits suggest that eruptions were initially phreatomagmatic (DeRita et al., 2001) containing less H2O over time but
increasing in CO2 and O2 volatiles (Freda et al., 1997). The Alban Hills Volcanic District is
classified among the most explosive mafic volcanoes estimated at Volcanic Eruptive Index [VEI] 5-7 indicating a plume height >25km with erupted volumes from 1-100 km3(Giordano &
Dobran, 1994; De Rita et al., 2001; Giordano et al., 2006). 1.2 Pozzolane Rosse Ignimbrite
The Pozzolane Rosse ignimbrite was erupted during the Tusolano-Artemisio Phase of
pozzolanic ash which was extracted from Pozzuoli, Italy by the early Romans to create cement
(Funiciello et al., 2006). Pozzolane Rosse was also known by ancient Romans to have
pozzolanic properties (Jackson & Marra, 2006), and it was widely used in formulating ancient cement (Jackson et al., 2010). Pozzolane Rosse is mostly a pyroclastic flow deposit (457±4 kya)
usually found covered with a thin co-ignimbritic ashfall deposit (Giordano & Dobran, 1994; Karner et al., 2001). This volcaniclastic unit has been described by many researchers (Giordano
& Dobran 1994; Trigila et al., 1995; Karner et al., 2001; Giordano et al., 2006 Marra et al., 2009 among others). Geochemical indicators of its alteration however, have only recently been
explored (Jackson et al., 2006; 2007; & 2010; Deocampo et al., in review)
The Pozzolane Rosse ignimbrite was emplaced 457±4 kya followed by an ashfall deposit (Giordano & Dobran, 1994; Karner et al., 2001). The timing of the ashfall has been described as
co-ignimbritic, but some researchers suggest that the volcanism during this time included an ashfall sequence over a prolonged period (Giordano et al., 2006). Marra et al. (2009) conclude
that a thin succession of ashfall deposits NE of the Tuscolano-Artimisio caldera rim emplaced at 442±2 kya are consistent with the eruption of Pozzolane Rosse, suggesting an overall eruptive episode of ~15 ky.
The Pozzolane Rosse is a low aspect ratio ignimbrite (mean thickness/ mean length = 6 x 10⁻⁴) with a calculated deposit volume estimated at 34 km3 and geographic distance from the
central vent measured at 30 km beyond hills 400m high (Giordano & Dobran, 1994). The deposit was likely related to caldera collapse and sustained by a very high eruption rate (109 kg/s) that produced a low fountaining eruption speculated to be the consequence of the
The ignimbrite sits on the Vallerano lava whose 40Ar/39Ar age (457±5) (Marra et al.,
2009) is indistinguishable from the base of the Pozzolane Rosse ignimbrite (456±3) (Karner et al., 2001). Geochemical differences between the two however, suggest that despite their relation in time, they may have different magma sources or have resulted from different portions of the
same magma chamber (Marra, 2001). The Vallerano lava is immediately overlain by a basal scoria lapilli fallout deposit, a scoria flow deposit, and an ash fall deposit. The Pozzolane Rosse
matrix is primarily coarse-ash shards and crystal fragments of leucite (KAlSi2O6), clinopyroxene
(Ca(Mg,Fe)Si2O6) dominantly diopside and biotite (K(Fe,Mg)3AlSi3O10(OH)2) dominantly
phlogopite(Trigila et al., 1995). The framework is mostly composed of reddish to dark gray fine gravel- and sand-sized porphyritic and vesicular to poorly vesicular scoria and opal-cemented fine ash aggregate. Despite its name, the Pozzolane Rosse is not red in all locations or at all
depths. Pozzolane Rosse contains few xenoliths of lava and thermally metamorphosed claystones and carbonates. Unaltered Pozzolane Rosse is considered ultrapotassic and primarily tephritic in
the TAS diagram (Figure 1-4; Trigila et al, 1995; Karner et al., 2001; Marra et al., 2009). 1.2.1 Pozzolane Rosse Alteration
Trigila et al. (1995) analyzed large scoria clasts that they suggest represent unaltered
volcanic material which they call the juvenile fraction of Pozzolane Rosse material. Marra et al. (2009) also analyzed samples of the Vallerano Lava and Pozzolane Rosse scoria clasts finding
preservation of what they call original glass. However, much of the upper Pozzolane Rosse has been altered (Jackson et al., 2007, 2010; Deocampo et al., in review). Informally known as the Castel di Leva geosol (term of Retallack, 2001) this altered Pozzolane Rosse horizon can be
Jackson et al. (2006; 2007; 2010) and Deocampo et al. (in review) show that altered Pozzolane
Rosse contains little or no volcanic glass, and has pedogenic phyllosilicate clay minerals including halloysite and kaolinite and zeolites chabazite and phillipsite. Primary leucite is commonly replaced with analcime (NaAlSi2O6•H2O). The scoria shows signs of alteration, and
sand-sized pellets are formed of cemented aggregates of fine ash.
Mineralogy and petrography of the altered ignimbrite reveal varied degrees of alteration
which led Jackson et al. (2010) to identify zones of alteration in the Pozzolane Rosse which vary vertically. These zones are called respectively: greatest, intermediate and least alteration facies
of Pozzolane Rosse Ignimbrite. Their analysis suggests that greatest alteration facies is primarily altered by meteoric waters and represents the paleosol Bt horizon. Intermediate alteration facies is transitional Bt to Bw horizon of this paleosol and least alteration facies is a zone of ignimbrite
that has little alteration, intact mineral crystals and corresponds to C horizon of the paleosol (Appendix C).
Deocampo et al. (2008; in review) use geochemical and mineralogical changes in the Pozzolane Rosse to address paleo-soil order classification. Based on cation leaching and accumulation of pedogenic clay they diagnose the altered layer as a paleo-ultisol. This work
provides evidence for speculation on paleotemperatures and paleoprecipitation in the Mediterranean region.
Pozzolane Rosse alteration has also been examined in a geoarcheological frame work. Jackson et al. (2009) show that ancient Romans incorporated the altered layers of the silica poor Roman pozzolanic ashes (Pozzolanella, Pozzolane Nere, and Pozzolane Rosse) for their building
(2007) analyses of early Roman mortars indicate the Imperial age Romans, after much
experimentation, selectively chose the intermediate and least altered facies of Pozzolane Rosse with relatively high alkali content for use in their strongest mortars.
1.3 Objective
The purpose of this study is to determine if Pozzolane Rosse alteration is characterized by
distinct geochemical trends or markers that indicate paleosol development, erosional history, and other mechanisms of alteration.
Using published mineralogical and geochemical data of unaltered parent material and new data derived from altered layers of Pozzolane Rosse for this project, this research attempts to address the discontinuous nature of the Pozzolane Rosse paleo-soilscape. Several research
questions about environmental stability and alteration mechanism arise. Did soils develop in some locations but not others? Was soil developed and subsequently eroded? If paleosols did
not develop consistently on this landscape, what were the other mechanisms of alteration? Accessing the Pozzolane Rosse around Rome can be difficult because the area is highly urbanized and much of the pozzolanic material has been excavated for engineering use over the
past 2000 years. Three locations in the Alban Hills Volcanic District have been chosen for analysis. Each has been identified as a source of Pozzolane Rosse ignimbrite where paleosol
development has been reported--Castel di Leva Quarry where previous work with micro- and macro-morphological analysis has identified alteration in Pozzolane Rosse (Jackson et al., 2010), a core section from Instituto Nazionale di Giofisica e Vulcanologia in Rome which has also been
section of the core at Santa Maria delle Mole, Italy which has been reported to include a paleosol
atop Pozzolane Rosse (Mariucci et al., 2008).
Chapter 2METHODS
2.1 Samples
Representative samples of Pozzolane Rosse Ignimbrite have been provided by Dr. Dan
Deocampo of Georgia State University [GSU]. These include eighteen whole rock samples extracted from the upper 4m [upper CA1] and basal 4m [basal CA1] of 26m of Pozzolane Rosse
ignimbrite represented in a core drilled at Santa Maria delle Mole, Italy, and ten whole rock samples extracted from 16m of Pozzolane Rosse recovered in the core drilled at the Instituto Nazionale di Geofisica eVulcanologia [INGV]. Also included in this study are previously
compiled XRF data (Deocampo et al., in review) from sixteen samples taken from the upper 7m of Pozzolane Rosse exposed at Castel di Leva Quarry, Italy [Castel]. For comparison, Trigila et
al.’s (1995) Pozzolane Rosse juvenile scoria data are included.
2.1.1 Sample locations
The CA1 borehole was drilled near Santa Maria delle Mole (41°46’47.87N,
12°30’56.57E, 120m asl), between Ciampino and Marino towns, in an area where much of the
volcano-tectonic activity has occurred (see Figure 1-1 for map of sample locations; Mariucci et al., 2008).
Mole. The INGV and CA1 cores were drilled for better geophysical and geochemical process
modeling, and for volcano-tectonic hazard evaluation (Mariucci et al., 2008).
The Castel de Leva Quarry, 11 km south of Rome and 20 km west of the Tuscoloano-Artemisio crater vent source (41°47.19N, 12°29.70E, 49m asl), provides modern quarry
exposures of cuts up to 15 m high where the Pozzolane Rosse ignimbrite and its co-ignimbritic ash cloud are exposed. Soil development within the upper 2-3 m is evident (Jackson et al.,
2010).
Trigila et al. (1995) juvenile scoria was collected from base to top at Tenuta di
Torpagnotta (near the junction between G.R.A. and Laurentina road; 41°47’19‖N, 12°30’42‖E).
2.2 Bulk Mineralogy
Mineralogy for CA1 core and INGV core samples was determined on randomly oriented powdered whole rock samples with an Al-sample holder in a Phillips X-ray diffractometer at
Georgia State University, using CuKα radiation scanning from 10°- 60° 2θ with one 0.02° step
per second and operating at 35 kV and 15 mA. Mineralogical identification from X-ray diffraction patterns was conducted by comparison to Moore & Reynolds (1997), Brindley &
Brown (1980) and Berry (1974).
2.3 Geochemistry
Whole rock samples from CA1 and INGV cores were powered and separately fused at
1100º C into glass disks using one part rock powder and nine parts lithium tetraborate
(anhydrous) (Li2B4O7). Major element and limited trace element (Rb, Sr, Y, Zr, Nb) analyses
were conducted at Georgia State Universitywith the Rigaku 3270 wavelength dispersive
fused glass beads for whole rock, major element composition at Michigan State University
(Jackson et al., 2010).
Analytical error was estimated using United States Geological Survey (USGS) standard reference material STM-1 (peralkaline nepheline syenite). The glass disk standard was analyzed
ten times and error estimates were made for each major element oxide (Appendix D). Molecular weathering ratios have the advantage of reducing many values to a single
number, which allows easier comparison among study locations. Molar ratios are calculated by dividing weight percent oxide by the molecular weight of the oxide. The Plagioclase index of
alteration (PIA= 100*((mAl2O3 – mK2O)/( mAl2O3 + mCaO + mNa2O – mK2O)) (Fedo et al.,
1995) is used to quantify the loss of leucite with greater alteration shown by higher values. Molar ratios were also used to calculate a bases weathering ratio (mCaO + mMgO + mNa2O +
mK2O)/mSiO2 (Birkeland, 1984). A second ratio was computed comparing analytical data from
Trigila’s juvenile scoria with altered Pozzolane Rosse to assess the difference between the two. Altered Pozzolane Rosse: ((mCaO + mMgO + mNa2O + mK2O)/mSiO2)
Avg. Trigila’s juvenile scoria: ((mCaO + mMgO + mNa2O + mK2O)/mSiO2)
2.4 Clay Mineralogy
Clay mineralogy in the CA1 and INGV cores was determined by clay separation and
oriented XRD mounts following Moore & Reynolds (1997). Whole rock samples were
powdered and mixed with 300ml of DI water and ~ 5-10ml of 0.5 g/L Na-hexametaphosphate (a
rinse dispersant) to suspend the particulate matter. It was then subjected to 10 minutes of disaggregation in a Branson digital sonifier. Following this treatment the suspended matter was centrifuged at 1200 rpm for 20 minutes. The supernatant liquid was decanted and centrifuged at
poured off and reserved and the residual clay was applied to a glass slide for XRD analysis. In
cases where 5000 rpm was not sufficient to settle all the 0.2 µm fraction, the supernatant was mixed with 10ml 1M CaCl2. After 24 hours the resulting flocculated material was rinsed three
times with DI water and centrifuged at 1200rpm for 10 minutes. To determine clay mineralogy,
oriented mounts were made on petrographic glass slides. Then they were processed air-dried and ethylene glycol solvated in a Phillips X-ray diffractometer at Georgia State University, using
CuKα radiation scanning from 2°-32° 2θ with one 0.02° step per second and operating at 35 kV
and 15 mA. Clay identification from X-ray diffraction patterns was conducted using Moore and
Reynolds (1997).
Chapter 3RESULTS
3.1 Mineralogy Results from X-Ray Diffraction
XRD patterns of randomly oriented whole rock Pozzolane Rosse contain significant background noise due to the scoriaceous nature of the ignimbrite and the likely presence of non-crystalline opal, poorly non-crystalline phases, and palagonite (Jackson, et al., 2010).
XRD results show INGV samples at all depths contain leucite [d=3.27Å] , clinopyroxene [d=2.99Å]. Chabazite (Ca2Al4Si8O24•12H2O) [d=2.93Å] is found in the top 1.5m (Figure 3-2).
Upper CA1 samples (CA1-1-11) are dominated by clinopyroxene with intensities of 50-125cps and biotite [d=3.34-3.37Å] with intensities of 75-150cps. Leucite is not detected in these samples(Figure 3-1). At CA1-03-04 several Fe-sulfide and Fe-sulfate peaks are found: Jarosite
(KFe33+[(OH)3SO4]2) [d=3.08Å] with peaks intensities between 100-200cps hydrobasaluminite
(Al4[(OH)10SO4]·12-36H2O) [d=6.19Å] with peaks between 100-150cps, as well as other weak
and marcasite (FeS2) [d=1.76Å] peaks 100-150cps. Additionally hematite is present (Fe2O3)
[d=2.69Å]. Analcime is also present with intensities between 50-100cps (Figure 3-4). Sanidine peak (d=3.26Å) only in CA1-01.
Basal CA1 (CA1-12-18) shows clinopyroxene and leucite dominant with intensities of
50-200 (Figure 3-4) Additionally there is evidence of hematite and the zeolites phillipsite (K2(NaCa0.5)3[Al5Si11O32]•12H2O) [d=3.19Å] and Chabazite ((Ca0.5,Na,K)4[Al4Si8O24]•12H2O)
[d=2.93Å] at this depth. Biotite peaks are found in these samples as well. Sanidine is seen in most of the basal CA1 samples.
0 50 100 150 200
10 15 20 25 30 35 40 45 50 55 60
In te n si ty (C o u n ts / se co n d ) INGV-03 An Lc
CPX MnCPX
CPX Ka Al Ka Py FeO ChBt Hm 0 50 100 150 200
10 15 20 25 30 35 40 45 50 55 60
In te n si ty (C o u n ts /s e co n d ) INGV-06 An Lc CPX Mn CPX Ka FeO Al Py d = 1 .5 7 Ka Ch
BtCPX Hm
Figure 3-1XRD plots for INGV-03, -06, & -09. D-spacing measured in angstroms (Å),mineral abbreviations: An=Analcime, Lc=Leucite, Bt=Biotite, CPX=Clinopyroxene, Hm=Hematite, Py=Pyrite, Ph=Phillipsite, Ilm=Ilmenite, Al=Alumina, Ch=Chabazite, Mn=Magnetite, Sn=Sanidine, Ka=Kaolinite
0 50 100
150
200 250
10 15 20 25 30 35 40 45 50 55 60
In
te
n
si
ty
(C
o
u
n
ts
/s
e
co
n
d
)
2-Theta
INGV-09
An Lc
CPX Mn
CPX Ka
Al
Ch Bt CPX
FeO
0 20 40 60 80 100 120 140 160
10 15 20 25 30 35 40 45 50 55 60
Int ens it y (c ou nt s pe r se con d) CA1-02 1:1 clay Al Al Ka Fe -s ul fa te CPX Mn Bt Ph 0 20 40 60 80 100 120 140 160
10 15 20 25 30 35 40 45 50 55 60
[image:32.792.73.725.108.495.2]Int ens ity (c ou nt s pe r s ec on d) 2-Theta CA1-06 1:1 clay CPX CPX CPX Bt Ph Bt Al Al Mn CPX Bt CPX
0 20 40 60 80 100 120 140 160 180 200
10 15 20 25 30 35 40 45 50 55
Int ens it y (C ou nt s) CA1-03 Fe-SO4-OH gib Jar Hm Jar Marc Marc d=1.59 Anh Mn 0 20 40 60 80 100 120 140 160 180
10 15 20 25 30 35 40 45 50 55 60
[image:33.792.78.719.108.483.2]Int ens ity (C ou nt s) 2-Theta CA1-04 Fe-SO4-OH Ka gib Hm Jar Jar Marc Marc d=1.59
Figure 3-4XRD plots for CA1-13 & -17. D-spacing measured in angstroms (Å), mineral abbreviations: An=Analcime, Lc=Leucite, Bt=Biotite,
CPX=Clinopyroxene, Hm=Hematite, Py=Pyrite, Ph=Phillipsite, Ilm=Ilmenite, Al=Alumina, Ch=Chabazite, Mn=Magnetite, Jar=Jarosite, Anh=Anhydrite, Marc=Marcasite, Ka=Kaolinite 0 50 100 150 200 250
10 15 20 25 30 35 40 45 50 55 60
Int ens it y (C ou nt s/ se con d) CA1-13 CPX CPX Al Ch Al d=1.80 Go CP X CP X Lc Sn d=3.46 Sn Mn Hm 0 20 40 60 80 100 120 140 160 180
10 15 20 25 30 35 40 45 50 55 60
3.2 Geochemical Data from X-Ray Fluorescence
Whole rock geochemistry is shown for CA1 (Table 3-1), INGV (Table 3-2), and Castel
(Table 3-3).
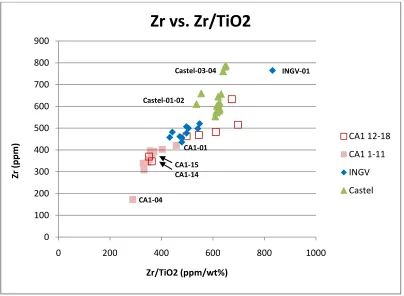
Zr and Ti are considered immobile elements in weathering environments and
concentration levels can be characteristic of both parent and altered material. Ratios of Zr and
TiO2 are used to assess homogeneity of samples (Milnes & Fitzpatrick, 1989). Figure 3-5displays
Zr vs. Zr/TiO2 for all three locations. INGV, Castel and upper CA1 each display clustering
which reflect homogeneity in all but the topmost samples (INGV-01, CA1-01, Castel-01-04). CA1-04 is also widely divergent and basal CA1 shows wide variation with no visible trends.
INGV-01 Zr content is high (765 ppm) compared to deeper samples (450-520 ppm).
Similarly, though less disparate, the upper CA1 (sample CA1-01) has a Zr concentration that is slightly higher (421 ppm) than those samples below (350-400 ppm). Sample CA1-04 has very
low Zr/TiO2 (288 ppm).
Several geochemical trends can be observed in the upper Pozzolane Rosse Ignimbrite. Loss of cations (K, Na, Ca, and Mg) is evident from INGV, upper CA1 and Castel when compared to Trigila’s juvenile fraction (Figure 3-6). K2O and CaO losses are most pronounced in upper CA1
and upper 4m of Castel (Figure 3-7, Figure 3-8). Trigila’s juvenile scoria contains >5.0 wt%
K2O while upper CA1 drops to 1.69 wt% and Castel drops as low as 0.69 wt% in the top 4m. Na
is lost throughout INGV, upper CA1, Castel, and most of basal CA1 (Figure 3-7).
Silica depletion is apparent in the upper 4m of Castel (Table 3-3; Figure 3-9) and in upper CA1 and a significant depletion at CA1-03-04 (SiO2 = 20.33-33.13 wt%) relative to Trigila’s
to samples below (15-18 wt%) and enriched in the top of Castel (20-23 wt%; Table 3-3)
compared to samples below (16-18 wt%) whereas it is not enriched at INGV(15-18 wt%; Table 3-2).
Loss on ignition (L.O.I.) is highest in the upper 4m of Castel (7-14 wt%) and the upper
CA1 (13-16 wt%) with extremely high values at CA1-03-04 (30-35 wt%). Lower values are found in the lower half of Castel (5-6 wt%), basal CA1 (5-13 wt%) and INGV (7-9 wt%) with an
Table 3-1 Major element chemical compositions of Pozzolane Rosse Ignimbrite from INGV core. Standard deviation for major element oxides (wt%) and trace elements (ppm): SiO2=0.42, TiO2=0.003, Al2O3=0.14, Fe2O3=0.05, MnO=0.003, MgO=0.02, CaO=0.01, Na2O=0.07, K2O=0.05, P2O5=0.01, Rb=3.3, Sr=3.7, Y=2.4, Zr=1.5, Nb=2.7
Sample Depth SiO2 TiO2 Al2O3 Fe2O3 MnO MgO CaO Na2O K2O P2O5 LOI Total Rb Sr Y Zr Nb
INGV Core (m) (wt%) (wt%) (wt%) (wt%) (wt%) (wt%) (wt%) (wt%) (wt%) (wt%) (wt%) (wt%) ppm ppm ppm ppm ppm
DEO-INGV.PR-01 0.0 45.4 0.92 16.4 10.1 0.24 3.5 5.2 0.09 5.9 0.68 12.9 101.2 409 6224 27 765 28
DEO-INGV.PR-02 0.5 45.0 0.99 17.0 10.8 0.19 4.4 7.3 0.16 6.5 0.77 8.7 101.9 381 2006 30 500 23
DEO-INGV.PR-03 1.5 45.7 0.95 16.2 10.2 0.16 5.0 7.5 0.08 6.6 0.73 8.1 101.3 404 1485 43 521 29
DEO-INGV.PR-04 2.7 41.8 0.91 15.1 10.2 0.19 4.9 7.8 0.01 6.6 0.70 7.8 96.0 370 888 38 436 25
DEO-INGV.PR-05 4.5 43.7 1.02 17.4 10.8 0.20 5.0 9.5 0.00 4.8 0.83 9.0 102.1 303 967 54 507 28
DEO-INGV.PR-06 5.5 44.9 0.98 17.2 10.8 0.22 4.6 8.4 0.00 5.7 0.86 8.0 101.6 334 930 38 462 22
DEO-INGV.PR-07 7.5 46.2 0.96 15.6 9.9 0.20 5.6 10.5 0.21 6.0 0.75 6.1 101.9 362 1117 46 477 24
DEO-INGV.PR-08 10.0 45.5 0.92 16.3 9.7 0.19 4.8 10.2 0.04 5.4 0.77 7.4 101.1 333 1113 45 498 28
DEO-INGV.PR-09 13.1 44.4 0.95 16.6 10.7 0.16 4.5 9.6 0.04 5.2 0.84 7.8 100.9 289 989 38 456 26
DEO-INGV.PR-10 14.5 44.1 1.09 16.8 11.0 0.19 4.6 9.2 0.08 5.6 0.94 7.2 100.7 288 1078 37 482 29
Table 3-2 Major element chemical compositions of Pozzolane Rosse Ignimbrite from CA1 core at Santa Maria delle Mole. Standard deviation for major element oxides (wt%) and trace elements (ppm): SiO2=0.42, TiO2=0.003, Al2O3=0.14, Fe2O3=0.05, MnO=0.003, MgO=0.02, CaO=0.01,
Na2O=0.07, K2O=0.05, P2O5=0.01, Rb=3.3, Sr=3.7, Y=2.4, Zr=1.5, Nb=2.7
Sample Depth SiO2 TiO2 Al2O3 Fe2O3 MnO MgO CaO Na2O K2O P2O5 LOI Total Rb Sr Y Zr Nb
Upper CA1 (m) (wt%) (wt%) (wt%) (wt%) (wt%) (wt%) (wt%) (wt%) (wt%) (wt%) (wt%) (wt%) ppm ppm ppm ppm ppm
CA1-PR-01 0.0 47.0 0.92 24.7 9.0 0.08 1.5 2.1 0.67 1.7 0.46 13.9 102.0 78 898 39 421 28
CA1-PR-02 0.3 49.9 1.05 22.8 10.1 0.07 1.4 1.4 0.42 2.0 0.34 12.8 102.1 126 342 48 379 29
CA1-PR-03 0.5 33.1 0.93 16.5 17.3 0.13 2.0 3.4 0.00 1.0 0.51 30.6 105.4 57 393 37 309 18
CA1-PR-04 0.6 20.3 0.60 9.7 31.1 0.13 0.8 1.8 0.00 0.7 0.31 35.4 100.8 32 196 20 173 13
CA1-PR-05 0.8 47.2 1.03 21.2 12.2 0.08 1.6 1.8 0.30 1.7 0.37 15.9 103.4 109 410 44 339 26
CA1-PR-06 1.0 48.3 1.11 20.9 11.0 0.07 2.0 2.8 0.26 1.8 0.44 13.4 102.0 134 581 48 396 27
CA1-PR-07 1.5 48.5 1.06 20.6 10.4 0.07 2.2 2.7 0.18 1.7 0.39 14.1 101.9 129 526 46 392 28
CA1-PR-08 2.5 49.8 1.00 19.8 9.9 0.07 2.2 2.6 0.14 1.9 0.39 13.8 101.4 144 553 50 403 26
CA1-PR-09 3.0 47.7 0.99 18.7 9.9 0.08 3.0 4.1 0.02 1.7 0.45 14.3 101.1 99 562 39 343 19
CA1-PR-10 3.8 46.5 1.01 19.3 10.4 0.10 2.6 2.9 0.00 2.1 0.46 15.9 101.2 104 545 34 356 23
CA1-PR-11 4.0 45.2 1.06 18.6 10.5 0.09 3.5 4.1 0.00 2.8 0.43 14.4 100.6 143 762 44 386 19
Basal CA1
CA1-PR-12 21.0 45.8 0.93 15.4 10.7 0.14 4.3 7.2 0.38 6.0 0.68 10.4 101.9 305 2111 29 463 23
CA1-PR-13 21.5 51.9 0.74 18.3 6.9 0.10 3.7 2.9 0.02 10.7 0.43 5.1 100.8 305 1983 21 516 28
CA1-PR-14 22.3 46.6 1.05 18.3 10.5 0.10 3.6 4.4 0.18 3.8 0.44 12.8 101.6 241 752 29 370 18
CA1-PR-15 22.7 49.2 0.96 17.0 9.4 0.08 2.4 3.8 0.40 5.2 0.42 12.3 101.2 385 669 25 348 20
CA1-PR-16 23.4 46.5 0.94 15.9 9.6 0.13 3.8 7.3 1.27 6.3 0.60 8.2 100.5 578 4274 19 633 25
CA1-PR-17 23.8 40.9 0.79 14.8 8.4 0.17 4.9 11.0 0.80 7.6 0.62 11.1 101.1 289 2546 28 483 24
Table 3-3 Major element chemical compositions of Pozzolane Rosse Ignimbrite at Castel di Leva Quarry (Data from Jackson, et al., 2009)
Sample Depth SiO2 TiO2 Al2O3 Fe2O3 MnO MgO CaO Na2O K2O P2O5 LOI Total Rb Zr Ba
Castel Quarry (m) (wt%) (wt%) (wt%) (wt%) (wt%) (wt%) (wt%) (wt%) (wt%) (wt%) (wt%) (wt%) ppm ppm ppm
CASTEL-PR-01 0.4 48.5 1.19 22.2 11.6 0.24 1.7 1.9 0.53 2.5 0.43 8.8 99.5 183 660 2698
CASTEL-PR-02 1.2 47.8 1.14 20.2 10.8 0.23 1.5 1.1 0.62 2.4 0.25 13.8 99.6 255 611 1680
CASTEL-PR-03 1.7 43.1 1.21 22.9 13.3 0.27 2.4 4.5 0.17 1.5 0.80 9.2 99.4 79 782 3795
CASTEL-PR-04 2.2 41.0 1.21 23.0 13.7 0.22 2.2 4.7 0.07 0.8 0.90 11.9 99.5 23 787 2209
CASTEL-PR-05 2.7 43.2 1.19 20.7 13.5 0.24 3.7 7.6 0.13 0.9 0.99 7.4 99.5 31 761 1982
CASTEL-PR-06 3.2 44.2 1.04 22.9 11.5 0.20 3.0 6.6 0.12 0.7 0.79 8.7 99.6 22 657 1619
CASTEL-PR-07 3.7 43.9 1.04 19.9 11.7 0.23 4.2 9.2 0.23 0.9 0.89 7.4 99.6 40 645 1950
CASTEL-PR-08 4.2 45.7 0.98 17.5 11.1 0.21 4.4 9.2 0.36 3.6 0.85 5.5 99.4 237 603 3246
CASTEL-PR-09 4.7 45.7 0.98 17.8 11.1 0.21 4.3 9.4 0.26 2.9 0.87 5.9 99.5 187 609 2555
CASTEL-PR-10 5.3 46.9 0.91 16.3 10.4 0.20 4.5 9.7 0.47 4.4 0.80 4.9 99.4 289 554 3420
CASTEL-PR-11 5.8 46.3 0.93 16.6 10.5 0.19 4.4 9.9 0.45 4.5 0.82 4.9 99.4 284 572 3283
CASTEL-PR-12 5.95 46.5 0.94 16.7 10.7 0.21 4.5 9.5 0.32 4.0 0.82 5.3 99.4 261 576 3248
CASTEL-PR-13 6.05 45.9 0.94 17.1 10.7 0.20 4.2 9.4 0.27 3.7 0.82 6.2 99.4 239 580 3770
CASTEL-PR-14 6.45 46.5 0.94 16.7 10.7 0.21 4.1 9.0 0.40 4.5 0.84 5.3 99.4 312 589 3420
CASTEL-PR-15 6.65 46.0 0.93 17.3 10.7 0.24 4.5 9.1 0.27 3.6 0.80 6.0 99.4 234 580 3187
Figure 3-5 Zr vs. Zr/TiO2. Zr and Ti plots show homogeneity in the samples. The top 1 or 2
samples from each location plot away from the main cluster suggesting alteration or mixing. CA1-04 values likely reflect hydrothermal alteration.
0 100 200 300 400 500 600 700 800 900
0 200 400 600 800 1000
Zr
(p
p
m
)
Zr/TiO2 (ppm/wt%)
Zr vs. Zr/TiO2
CA1 12-18
CA1 1-11
INGV
Castel
INGV-01
CA1-04 Castel-01-02
CA1-01 Castel-03-04
Figure 3-6 mBases/mSiO2 and mBases/mAl2O3 vs. depth(m). Comparison of the molar ratio of base cations
(mK2O+mNa2O+mCaO+mMgO) to Silica (mSiO2) and also to Alumina (mAl2O3) vs. depth shows increased weathering/alteration with lower values. Both ratios are shown because Al2O3 (wt%) is usually considered immobile in a weathering environment at normal pH (Birkeland, 1984) however it appears to be accumulated in the top 4 m of CA1 and Castel samples (figure 3-10). Silica (wt%) on the other hand appears to be lost in the same samples (figure 3-9). These plots show there is a relative loss of bases compared to both silica and alumina in the Pozzolane Rosse at upper upper CA1 and Castel and a slight loss at the top of INGV.
0.0
5.0
10.0
15.0
20.0
25.0
30.0
0.0000 0.2000 0.4000 0.6000 0.8000
D
e
p
th
(m
)
m
Bases/
m
Silica
CA1 Trigila INGV Castel
0
5
10
15
20
25
0.00 1.00 2.00 3.00
D
e
p
th
(m
)
m
Bases
/m
Al
2O
3 [image:41.612.73.525.77.485.2]Figure 3-7 Loss of base cations (wt%) vs. SiO2/Al2O3. Loss of K (wt%) primarily seen in
CA1 and Castel, whereas loss if Na is apparent at all locations. Ca and Mg losses are found in CA1 and upper Castel. INGV shows less loss of all bases (wt%) except Na. (diamond=INGV, square=upper CA1, triangle=Castel, X=Trigila)
0.00 1.00 2.00 3.00 4.00 5.00 6.00 7.00
0 2 4 6
K 2O SiO2/Al2O3 0.00 0.10 0.20 0.30 0.40 0.50 0.60 0.70 0.80 0.90 1.00
0 2 4 6
N a2O SiO2/Al2O3 0.00 1.00 2.00 3.00 4.00 5.00 6.00
0 2 4 6
M gO SiO2/Al2O3 0.00 2.00 4.00 6.00 8.00 10.00 12.00
0 2 4 6
CaO
[image:42.612.98.516.83.659.2]Figure 3-8 mK2O/mSiO2 vs. Depth. Depletion of K2O in the upper 4m of CA1 and Castel is consistent with loss of leucite in the upper 4m at these locations.
0.0
5.0
10.0
15.0
20.0
25.0
0 0.05 0.1 0.15 0.2 0.25
D
e
p
th
(m
)
m
K
2O/
m
SiO
2Figure 3-9 mSiO2/mR2O3 (mAl2O3+mFe2O3+mTiO2) vs. Depth. SiO2 is observed stable in INGV with slight depletion in upper CA1 except for samples CA1-03-04 which show great loss. Castel shows marked SiO2 loss suggesting a more strongly leached profile. Al, Fe, and Ti are considered the most resistant components in a weathering environment (Birkeland, 1984).
0
5
10
15
20
25
0.00 1.00 2.00 3.00 4.00
D
e
p
th
(m
)
mSiO2/mR2O3
Figure 3-10 Al2O3 vs. Depth. Al2O3 is enriched in the upper samples of CA1 and Castel while remaining stable throughout INGV.
3.3 Clay Mineralogy
Air dried oriented mounts of <0.2 µm clay fraction were produced from three INGV (03,06,11), three upper CA1 (02,04,06) and four basal CA1 samples (12,15,16,17).
Results from INGV contain weak 7Å peaks in INGV-03 and INGV-06 air dried samples. Following glycol solvation, diffraction patterns continue to show very weak 7Å peaks bordering
0
5
10
15
20
25
0.00 5.00 10.00 15.00 20.00 25.00 30.00
D
e
p
th
(m
)
Al2O3 (wt%)
on amorphous patterns (Figure 3-11, Figure 3-12). These peaks are consistent with 1:1 kaolin
mineral (Al4Si4O10(OH)8).
Upper CA1 display stronger 7Å peaks in air dried samples of CA1-02 and CA1-06 (Figure 3-13, Figure 3-14) Following glycol solvation the 7Å peaks remain strong over the
amorphous background and like the INGV patterns indicate a 1:1 kaolin clay. Sample CA1-04 was selected because of its unusual mineralogy (pyrite and jarosite). It shows only amorphous
patterns when analyzed air dried or glycol solvated.
Basal CA1 air dried samples have wide peaks centered at 12Å or 15Å. Paired with a high
0 10 20 30 40 50 60 70 80
2 7 12 17 22 27 32
Int ens ity (c ou nt s/ se con d) 2-Theta IN3CLAY 0 10 20 30 40 50 60 70 80
2 7 12 17 22 27 32
[image:47.792.71.730.89.425.2]In te ns ity (c ou nt s/ se co nd ) 2-Theta IN3GLY
Figure 3-11Oriented clay mounts INGV-03 air dried and ethylene glycol solvated. Minor presence of 1:1 clay may be indicated by persistent 7Å peak. D-spacing measured in angstroms (Å).
d=7.52
d=4.44
0 10 20 30 40 50 60 70 80
2 7 12 17 22 27 32
In te n si ty (c o u n ts /s e co n d ) IN6CLAY 0 20 40 60 80
2 7 12 17 22 27 32
In te n si ty (c o u n ts /s e co n d ) 2-Theta IN6GLY d=7.48 d=10.64
Figure 3-12Oriented clay mounts INGV-06 air dried and ethylene glycol solvated. Presence of 1:1 clay indicated by persistent 7Å peak. D-spacing measured in angstroms (Å).
d=7.48
d=4.44
Figure 3-13 Oriented clay mounts CA1-02 air dried and ethylene glycol solvated. Presence of 1:1 clay indicated by persistent 7Å peak. d-spacing measured in angstroms (Å).
0 20 40 60
2 7 12 17 22 27 32
In te n si ty (c o u n ts / se co n
0
20
40
60
80
100
2
7
12
17
22
27
32
In t e n s it y (c o u n t s / s e c o n d )
2-Theta
CA1-02Gly
d=7.30 d=4.40
[image:49.792.79.722.42.407.2]0 20 40 60 80 100 120
2 7 12 17 22 27 32
In te n si ty (c o u n ts / se co n d ) CA1-06C 0 50 100
2 7 12 17 22 27 32
[image:50.792.78.723.90.432.2]In te n si ty (c o u n ts / se co n d ) 2-theta
CA1-06Gly
Figure 3-14Oriented clay mounts CA1-06 air dried and ethylene glycol solvated. Presence of 1:1 clay indicated by persistent 7Å peak. d-spacing measured in angstroms (Å).
d=7.45
d=3.57
0 20 40 60 80 100 120
2 7 12 17 22 27 32
In te n si ty (c o u n ts /s e co n d ) CA1-17Clay 0 20 40 60 80 100 120
2 7 12 17 22 27 32
[image:51.792.76.718.141.468.2]Int e ns it y (c ou nt s/ se con d) 2-Theta CA1-17Gly
Figure 3-15Oriented clay mounts CA1-17 air dried and ethylene glycol solvated represent clay patterns seen throughout basal CA1 samples. Wide 10Å peaks in air-dried samples expand to 17Å peaks with ethylene glycol solvation. d-spacing measured in angstroms (Å)
d=17.55
d=3.27
Chapter 4Discussion
4.1 Paleosol Development
Paleosols are ancient soils that are no longerpedogenicallyactive. They are found throughout the rock record. These soils developed on the Earth’s surface as a result of parent
material alteration by physical, chemical, or biological processes. They were subsequently buried with sediments or pyroclastic material or persist under different surface conditions (Retallack, 1990).
Soils cover the earth surface in every region, in all climates and moisture regimes, and within any topography. The diversity of variables contributing to soil development is
tremendous. However, trends in geochemistry, mineralogy and clay development can help to identify processes that contribute to particular soil profiles as well as elucidate the processes that contributed to ancient soil development (Bestland, 2002).
Several geochemical and mineralogic indicators support paleosol development at the top of Pozzolane Rosse at CA1 and Castel. There is significant loss of base cations (K, Mg, Ca, Na) in the upper CA1 and Castel when compared with Trigila’s juvenile fraction. Bases weathering ratios calculated using Trigila’s juvenile scoria to represent unaltered Pozzolane Rosse parent
material are shown in Table 4-1.
Upper CA1 and Castel 01-06 bases weathering ratios are low (0.37 and 0.47) indicating higher leaching of base cations at these depths. This concurs with Figrue 3-6 showing bases to alumina plotting at less than one half the value of Trigila’s juvenile fraction in the upper CA1
Losses of base cations and silica revealed by these weathering ratios are indicative of a
paleo-pedogenic hydrolytic environment (Birkeland, 1984).
Loss of K in particular is consistent with the dissolution of leucite or the incongruent dissolution of leucite to form the zeolite analcime (Putnis et al. 1994; 2007). Diagenetic zeolites
are found in many volcanic settings, however combined with current evidence of pedogeneisis at this location, pedogenic development of analcime is likely. Zeolites in soil environments can
occur under varied conditions—in a volcanic environment zeolites are commonly inherited through alteration of volcanic parent materials (Ming & Mumption, 1989). In the leucite-rich
volcaniclastics of the Alban Hills Volcanic District it is likely that pedogenic analcime is formed due to the presence of leucite, which is geochemically very similar (Leucite: KAlSi2O6,
Analcime: NaAlSi2O6). The incongruent dissolution of leucite to form analcime is described by
the reaction (Putnis et al. 1994):
KAlSi2O6 (s) + Na+(aq) + H2Ol↔ NaAlSi2O6•H2O(s) + K+(aq)
Loss of K in CA1 is supported by XRD data which shows almost no leucite in the upper 4m and
by reported petrographic evidence of leucite replacement by analcime in the Castel samples (Jackson et al. 2010). The Plagioclase Index of Alteration quantifies the loss of leucite. Figure 4-1 shows PIA graphed against depth. Greater alteration is shown by higher values. Castel and CA1 numbers are highest compared to Trigila’s juvenile scoria.
Alumina enrichment in the upper CA1 and Castel profiles is consistent with XRD and petrographic evidence of 1:1 hydrous aluminum silicate kaolin. Al2O3 shows a positive
association with L.O.I. in Castel and CA1 samples indicating that excess water loss, is associated with excess alumina (Figure 4-2). This is evidence that both the water and Al2O3 are associated
Pozzolane Rosse, are common weathering products in soils of warm, humid regions (Moore &
Reynolds, 1997). Geochemistry and clay mineralogy of upper CA1 and Castel support the weathering of leucite, mafic minerals, or scoriaceous groundmass to form pedogenic alumina-rich clays (Sheldon, 2003). Evidence at CA1 and Castel strongly suggests a paleo-pedogenic
environment persisted while the Pozzolane Rosse was exposed. Significant depletion of base cations and a distinct argillic horizon are evidence for the development of a paleo-ultisol at these
locations (Birkeland, 1984).
Table 4-1Molar ratios of base oxides/silica* for altered Pozzolane Rosse to Average** base oxides/silica of Trigila’s juvenile scoria. [*(mCaO + mMgO + mNa2O + mK2O)/mSiO2); **Trigila’s average = .4583]
Location and
samples CA1 01-11 Castel 01-06 Castel 07-09 Castel 10-16 INGV-01-03 INGV 04-11
0.28 0.30 0.84 0.94 0.70 1.03
0.23 0.25 0.91 0.97 0.91 1.03
0.48 0.48 0.89 0.92 0.95 0.95
0.38 0.47 0.90 1.11
0.26 0.72 0.89 1.03
0.33 0.60 0.91 1.00
0.33 0.83 1.01
0.32 0.87
0.46 0.39 0.55
Figure 4-1 Plagioclase index of alteration [PIA]. 100*((Al2O3 –
K2O)/(Al2O3 + CaO + Na2O – K2O) where higher numbers indicate greater degree of alteration.
0
5
10
15
20
25
30
0.0000 20.0000 40.0000 60.0000 80.0000 100.0000
D
e
p
th
(m
)
PIA
Figure 4-2 L.O.I vs. Al2O3. Positive association between Loss on ignition values and
alumina concentration compared with Trigila’s juvenile scoria is consistent with the development of alumina rich clay species in the upper Castel and upper CA1. Upper CA1-03 & -04 show very high L.O.I. presumably due to the abundant volatile element sulfur present in pyrite, jarosite, and greigite.
4.2 INGV Alteration
Whereas the top 4m of Castel and upper CA1 show geochemical similarity, the lower section of Castel (Castel 8-16) and INGV also appear to have a related profile. Interestingly INGV shows only minor alteration in the samples from the top 4m of the Pozzolane Rosse
Ignimbrite taken from this core. The geochemical trends revealed in Figure 3-6--slight loss of bases, Figure 3-9--no loss of silica, and Figure 3-11--little to no accumulation of alumina, show
less alteration compared to upper CA1 and the upper 4m of Castel. Also consistent with this
0.00 5.00 10.00 15.00 20.00 25.00 30.00 35.00 40.00
0.00 5.00 10.00 15.00 20.00 25.00 30.00
L.
O.
I.
(
wt
%
)
Al2O3 (wt%)
L.O.I. vs. Al
2O
3upper CA1 basal CA1 INGV Upper Castel Lower Castel Trigila
CA1-04
assessment is the weak development of pedogenic clay described by XRD clay analysis (Figure
3-12), and the strong presence of primary mineralogy (leucite and clinopyroxene; Figure 3-1), and the low Plagioclase index of alteration values (Figure 4-1). This pattern could be explained in one of two ways—either alteration was not as intense and therefore a soil did not develop at
the INGV location or a soil was developed but was subsequently eroded. Assuming a paleo-environment conducive to hydrolytic weathering, based on paleo-utisol type horizons at CA1 and
Castel, the evidence presented for INGV would support less severe alteration. Weathering ratios seen in Table 4-1 show that INGV has values similar to Castel’s intermediate and least alteration
values. The tri-plot (Figure 4-3) showing Si, Al, and bases shows INGV values cluster near Trigila’s juvenile scoria.
Alternatively, erosion of a former soil appears plausible considering its down slope
relationship to CA1 where a significant soil appears to have developed and been maintained. Geochemical trends that indicate less alteration can be compared with the deeper samples in
Castel. Adjusting INGV depths to reflect samples at +4m deeper (Figure 4-6, Figure 4-5, Figure 4-6) INGV values match Castel closely hinting that similar alteration may have occurred at INGV, but the most altered layer above has been removed. This supposition is supported by
the divergence of INGV-01 seen in the Zr vs. Zr/TiO2 (Figure 3-5). The degree of variation seen
at INGV-01 is not paralleled in the topmost samples of CA1 or Castel and does not include
Figure 4-3 Ternary diagram shows sample’s weighted means in clusters. Upper CA1 and upper Castel show greater loss of bases and silica with increased accumulation of alumina. INGV and lower Castel plot closer to Trigila’s juvenile scoria.
NaO
2+CaO+
MgO+K
2O
[image:58.612.104.524.83.458.2]Figure 4-4mBases/mSiO2 with adjusted INGV sample depths (+4m).
Added depth reflects possible erosional loss of upper 4m at INGV location. The resulting profile is consistent with Castel at 4m.
0.0
5.0
10.0
15.0
20.0
25.0
30.0
0.0000 0.2000 0.4000 0.6000 0.8000
De
p
th
(
m
)
m
Bases/
m
Silica
Figure 4-5 mSiO2/mR2O3 with adjusted INGV sample depths (+4m). Added
depth reflects possible erosional loss of upper 4m at INGV location. The resulting profile is consistent with Castel at 4m.
0
5
10
15
20
25
0.00 1.00 2.00 3.00 4.00
D
e
p
th
(m
)
m
SiO
2/
m
R
2O
3Figure 4-6 Al2O3 (wt%) with adjusted INGV sample depths (+4m) . Added depth
reflects possible erosional loss of upper 4m at INGV location. The resulting profile is consistent with Castel at 4m.
4.3 Alteration Facies
Based on micromorphology and mineralogy, Jackson et al. (2010) call the top 1.0m of Castel ―airfall and colluvial ash‖ (Castel-01-03), the underlying 0.9m ―hydrolytically altered
0
5
10
15
20
25
0.00 5.00 10.00 15.00 20.00 25.00 30.00
D
e
p
th
(m
)
Al
2O
3(wt%)
paleosol‖ (Castel-04-07) followed by 1.5m of ―intermediate altered facies‖ (Castel-08-09) and
finally the lower 3.75m ―least altered facies‖ (Castel-10-16).
Based on the data in this work we can correlate Jackson et al.’s (2010) alteration facies with
Castel geochemistry. The top samples which appear to be colluvial or ashfall have significantly
different Zr/TiO2 ratios from those below (Figure 3-5). Jackson et al.’s (2010) greatest alteration
facies shows the following trends (see Appendix C for Jackson et al.’s (2010) complete table):
(1) Bases are lost most dramatically (Castel-01-06) (Figure 3-6, Table 4-1) including K2O
(Figure 3-7 and Figure 3-8), and (2) primary Al2O3 gains are seen in these samples (Figure 3-10).
Intermediate alteration facies exhibit (1) reduced loss of base cations (Figure 3-6) and (2) less enrichment of alumina with depth (Figure 3-10). In the least altered facies, bases and alumina stabilize with greater depth and approach the composition of Trigila’s juvenile scoria (Table
4-1).
Comparing CA1 samples with the geochemistry of the alteration facies shows that upper
CA1 corresponds with Jackson et al’s (2010) greatest alteration facies classification. Zr/TiO2 in
the upper CA1 suggests a mixed or reworked layer involving different parent material potentially from ashfall or colluvial mixing (Figure 3-5). Upper CA1-02 and 05-10 have the same
geochemical signature (see chapter 3 figures and Table 4-1) and clay mineralogy of a
hydrolytically altered paleosol—Jackson et al.’s (2010) greatest alteration facies. No samples
were collected below this layer to suggest if an intermediate or least alteration facies exists in the upper Pozzolane Rosse at this location. INGV on the other hand seems not to have developed or to be missing the greatest alteration facies. What remains however, corresponds geochemically