www.hydrol-earth-syst-sci.net/13/833/2009/ © Author(s) 2009. This work is distributed under the Creative Commons Attribution 3.0 License.
Earth System
Sciences
EAGLE 2006 – Multi-purpose, multi-angle and multi-sensor in-situ
and airborne campaigns over grassland and forest
Z. Su1, W. J. Timmermans1, C. van der Tol1, R. Dost1, R. Bianchi2, J. A. G´omez3, A. House4, I. Hajnsek5, M. Menenti6, V. Magliulo6, M. Esposito6, R. Haarbrink7, F. Bosveld8, R. Rothe8, H. K. Baltink8, Z. Vekerdy1, J. A. Sobrino9, J. Timmermans1, P. van Laake10, S. Salama10, H. van der Kwast11, E. Claassen12, A. Stolk13, L. Jia14, E. Moors14, O. Hartogensis15, and A. Gillespie16
1International Institute for Geo-information Sciences and Earth Observation, Department of Water Resources, P.O. Box 6, 7500 AA, Enschede, The Netherlands
2European Space Agency, Earth Observation Center, Via Galileo Galilei, 00044 Frascati, Italy
3Instituto Nacional de T´ecnica Aeroespacial, Area de Teledetecci´on, Dpto. de Observ. de la Tierra, Teledetecci´on y Atm´osfera, Carretera de Ajalvir, p.k. 4 – 28850 Torrej´on de Ardoz, Madrid, Spain
4ITRES Research Limited, Suite 110, 3553 – 31st Street NW, Calgary, Alberta, Canada
5German Aerospace Center, Microwaves and Radar Institute, P.O. Box 11 16, 82230 Wessling, Germany
6National Research Council (CNR), Institute for mediterranean agriculture and forest systems (ISAFoM), Via Patacca 85, 80056 Ercolano (NA), Italy
7MIRAMAP, ESA/ESTEC (TEC-ST), P.O. Box 299, 2200 AG, Noordwijk, The Netherlands 8Royal Netherlands Meteorological Institute, P.O. Box 201, 3730 AE, De Bilt, The Netherlands
9Universidad de Valencia, Faculty of Physics, Department of Thermodynamics, Global Change Unit, c/Dr. Moliner, 50, 46100 Burjassot, Spain
10International Institute for Geo-Information Science and Earth Observation, Dept. of Natural Resources, P.O. Box 6, 7500 AA, Enschede, The Netherlands
11Utrecht University, Department of Physical Geography, Faculty of Geosciences, P.O. Box 80.115, 3508 TC, Utrecht, The Netherlands
12FUGRO-Inpark B.V., Dillenburgsingel 69, 2263 HW Leidschendam, The Netherlands
13National Institute for Public Health and the Environment, P.O. Box 1, 3720 BA, Bilthoven, The Netherlands 14Wageningen University and Research Centre, Alterra P.O. Box 47, 6700 AA Wageningen The Netherlands
15Wageningen University, Meteorology and Air Quality Group, P.O. Box 47, 6700 AA Wageningen, The Netherlands 16University of Washington, Johnson Hall 070, P.O. Box 351310, 4000 15th Avenue NE, Seattle, WA 98195-1310, USA Received: 15 February 2009 – Published in Hydrol. Earth Syst. Sci. Discuss.: 6 March 2009
Revised: 21 May – Accepted: 27 May – Published: 18 June 2009
Abstract. EAGLE2006 – an intensive field campaign for the advances in land surface hydrometeorological processes – was carried out in the Netherlands from 8th to 18th June 2006, involving 16 institutions with in total 67 people from 16 different countries. In addition to the acquisition of multi-angle and multi-sensor satellite data, several airborne instru-ments – an optical imaging sensor, an imaging microwave ra-diometer, and a flux airplane – were deployed and extensive
Correspondence to: Z. Su
related to the objectives of other European Space Agency (ESA) campaign activities (SPARC2004, SEN2FLEX2005 and especially AGRISAR2006). However, one important ob-jective of the EAGLE2006 campaign is to build up a data base for the investigation and validation of the retrieval of bio-geophysical parameters, obtained at different radar fre-quencies (X-, C- and L-Band) and at hyperspectral optical and thermal bands acquired simultaneously over contrasting vegetated fields (forest and grassland). As such, all activi-ties were related to algorithm development for future satel-lite missions such as the Sentinels and for validation of re-trievals of land surface parameters with optical and thermal and microwave sensors onboard current and future satellite missions. This contribution describes the campaign objec-tives and provides an overview of the airborne and field cam-paign dataset. This dataset is available for scientific investi-gations and can be accessed on the ESA Principal Investiga-tor Portal http://eopi.esa.int.
1 Introduction
1.1 Campaign overview
To understand the role of the terrestrial hydrosphere-biosphere in Earth’s climate system it is essential to be able to measure from space hydrometeorological variables, such as radiation, precipitation, evapotranspiration, soil moisture, clouds, water vapour, surface water and runoff, vegetation state, albedo and surface temperature, etc. Such measure-ments are required to further increase our understanding of the global climate and its variability, both spatially and temporally. The understanding and quantification of bio-geophysical processes of different vegetated surfaces are pre-requisite for the development of validated, global, interac-tive Earth system models for the prediction of global change accurately enough to assist policy makers in making sound decisions concerning the planning, sustainable use and man-agement as well as conservation of water resources and the environment (GEO, 2005). Multi-sensor remote sensing ob-servations (using radar, thermal and optical data) in combi-nation with in-situ process observations are fundamental for the development and validation of models and retrieval algo-rithms.
While intensive and extensive field campaigns have been conducted in semiarid areas in recent years for the study of parameter retrievals and land-atmosphere processes using airborne and satellite observations (e.g. Sobrino et al., 2008; Su et al., 2008; Timmermans, 2008b, c), the knowledge of bio-geophysical parameter retrieval from multi-parameter optical, thermal and microwave data and the ability of di-rect modeling of the underlying physical processes in forests and grassland remain challenging due to lack of appropri-ate observation data in humid climappropri-ate. In EAGLE2006 an intensive filed campaign was conducted using different
air-borne instruments – an optical imaging sensor, an imaging microwave radiometer, and a flux airplane – for data acqui-sition and to collect extensive ground measurements simul-taneously over one grassland site and two forest sites in ad-dition to acquisition of multi-angle and multi-sensor satellite data. As such this data set is both unique and urgently needed for the development and validation of models and inversion algorithms for quantitative surface parameter estimation and land surface hydrometeorological process studies.
The EAGLE2006 activities were performed over central parts of the Netherlands (the grassland site at Cabauw and two forest sites at Loobos and Speulderbos; with yearly precipitation around 750 mm and yearly average tempera-ture about 10◦C) from the 8th until the 18th of June 2006. EAGLE2006 originated from the combination of a num-ber of initiatives coming from different funding. As such, the objectives of the EAGLE2006 campaign were closely related to the objectives of other ESA Campaigns, includ-ing the SPARC2004 and SEN2FLEX2005 campaigns (Su et al., 2008; Sobrino et al., 2008) and AGRISAR2006 (DLR, 2008).
One important objective of the campaign is to build up a data base for the investigation and validation of the retrieval of bio-geophysical parameters, obtained at different radar frequencies (X-, C- and L-Band) and at hyperspectral opti-cal and thermal bands acquired over vegetated fields (forest and grassland). All activities were related to algorithm de-velopment for future satellite missions such as the Sentinels and for validations of data collected with different satellite sensors (e.g. CHRIS, MODIS and MERIS data, with activ-ities also related to AATSR and ASTER thermal data vali-dation, as well as the ASAR sensor on board ESA’s Envisat platform and those on EPS/MetOp and SMOS). Most of the activities in the campaign are highly relevant for issues re-lated to retrieval of biophysical parameters from higher reo-lution data (e.g. CHRIS and MERIS as well as AATSR and ASTER), while scaling issues and complementary between these higher resolution sensors (covering only local sites) and global sensors such as MSG/SEVIRI, EPS/MetOP and SMOS are also key elements.
1.2 Campaign objectives
The general purposes of the campaign are:
1. Acquisition of simultaneous angular and multi-sensor data (from visible to microwave domain) over a grassland and a forest.
2. Advancement of process understanding in description of radiative and turbulent processes in land-atmosphere interactions.
4. Improvement of soil moisture retrieval accuracy by synergy of angular (L-band) SMOS and multi-angular C-band SAR/Optical-thermal observations. 5. Development of operational algorithms to extract land
surface parameters and heat fluxes from the future EPS/MetOp mission.
6. Development of physically based drought monitoring and prediction method (Hydro-climatologic modeling) on the basis of EPS/MetOp observations.
In particular, the EAGLE2006 campaign addressed impor-tant specific programmatic needs of Sentinel-1 and -2:
1. To assess the impact of Sentinel-1 and Sentinel-2 sensor and mission characteristics for land applications (land use mapping, parameter retrieval) over forest and grass-land.
2. To provide a basis for the quantitative assessment of sensor or mission trade-off studies, e.g. spatial and ra-diometric resolution.
3. Simulate Sentinel-1 and Sentinel-2 image products over the land (forest and grassland).
In the context of Sentinel-1, EAGLE2006 aimed primarily at the investigation of radar signatures over forest and grass-land simultaneously which is currently not addressed. An important dataset of coordinated in-situ and airborne SAR measurements was collected which provides support both to studies of the Sentinel-1 technical concept, as well as con-tributing to studies of future mission concepts involving pa-rameter retrieval at L-band.
As part of the refinement and verification of the Sentinel-1 technical concept, EAGLE2006 data will be used for the as-sessment of land use classification using the proposed nom-inal operating configuration (i.e. IW mode, VV + HH polari-sation plus co-polaripolari-sation). Simulation of Sentinel-1 image products can be performed using the EAGLE2006 data.
By including an optical data acquisition component, the campaign also provides feedback on key issues relating to definition of the ESA Sentinel-2 multi-spectral mission re-quirements. Attention focuses on the investigation of the optimum position and width of spectral bands for land cover/change classification and retrieval of bio-geophysical parameters (e.g. improved surface classification, quantitative assessment of vegetation status – forest and grassland). The imaging spectrometer data acquired as part of EAGLE2006 has been used to simulate Sentinel-2 L1b products using the proposed different configurations, and to investigate compat-ibility with the envisaged L2/L3 products (Timmermans et al., 2008a).
Cabauw
Loobos Speulderbos
0 50 km
[image:3.595.309.547.61.296.2]Urban Grassland Industrial Agriculture Mixed Horiculture Forest Sand/dunes Do288 flightline CASA flightline Tower site
Fig. 1. Location of the EAGLE2006 experimental sites on a landuse
map of The Netherlands, flightlines for the CASA 212 AHS/CASI high-altitude and the Do228 ESAR missions are projected.
2 Experimental sites
Simultaneous measurements took place at three sites: – Cabauw, grassland, 51◦5800000N, 04◦5400000E,
−0.7 m. a.m.s.l.
– Loobos, forest, 52◦10002.800N, 05◦4403800E, 23 m. a.m.s.l.
– Speulderbos, forest, 52◦15008.100N, 05◦41025.800E, 52 m. a.m.s.l.
2.1 Cabauw
Fig. 2. Photographs of the observation towers at the grassland site at
Cabauw (left) and at the forest sites at Loobos (middle) and Speul-derbos (right). (Sources: KNMI, Alterra and RIVM/ECN/ITC).
is a few hundred meters broad. The water holding capacity of the soil at the site is high, the soil being fine grained with a high content of organic matter. The ground water level in the whole catchment area, within which the field tower is lo-cated, is artificially managed through narrow, parallel ditches spaced 40 m apart. The water level in the ditches is always kept at 40 cm below the surface level maintaining the level of the ground water table near the surface. Due to the rich sup-ply of water and the fine grained soil, the evaporative fraction rarely falls below 0.6.
More detailed info is provided in (Ulden and Wieringa, 1996). An overview of recorded data is provided on the web at: http://www.knmi.nl/kodac/ground based observations climate/cabauw.html
2.2 Loobos
The Loobos site is located two kilometers south-west of the village Kootwijk. Continuous micrometeorological measure-ments have been carried out since 1997 at a height of 23 m above the surface, see middle panel of Fig. 2. In a radius of 500 m 89% of the vegetation consists of pine trees, with an average height of about 16 m, 3.5% is open vegetation e.g. heather and the remainder is a mixture of coniferous and deciduous trees.
More detailed information about this site is available on the web-site at: http://www.loobos.alterra.nl.
2.3 Speulderbos
The Speulderbos site, operated by the National Institute for Public Health and the Environment (RIVM), is located near the village Garderen approximately 60 km northeast from Cabauw within a large forested area in the Netherlands. A 47-m high scaffolding tower, right panel of Fig. 2., is placed within a dense 2.5 ha Douglas fir stand planted in 1962. The tree density is 785 trees per hectare and the tree height was approximately 22 m in 1995 and 32 m in 2006. The single-sided leaf area index varies between 8 and 11 throughout the year. The surrounding forest stands have typical dimensions of a few hectares and varying tree heights. Dominant species
in the neighborhood of the Douglas fir stand are Japanese Lark, Beech, Scotch Pine and Hemlock. At a distance of 1.5 km east from the tower the forest is bordered by a large heather area. In all other directions the vegetation consists of forest at distances of several kilometers. The topography is slightly undulating with height variations of 10 to 20 m within distances of 1 km.
Another tower, currently used by foresters of the state forest service (SBB), in the area is located in the village Drie at about 2 km distance at 52◦15054.800N latitude and 5◦40039.400E longitude. A Large Aperture Scintillometer (LAS) is installed between this and the previous tower to ob-tain spatial average sensible heat fluxes.
2.4 Base data for the experimental sites include topo-graphic data, digital elevation data, and other ancil-lary national data (see later)
Topographical data for the entire study area is digitally avail-able, originating from scale 1:50 000 and scale 1:10 000 to-pographical maps.
Digital elevation data from the Actual Height model of the Netherlands (AHN) is available for the areas of inter-est. The AHN is a detailed elevation model of the entire country obtained from Airborne Laser Altimetry. The Ac-tual Elevation Model is an initiative of three layers of author-ities in the Netherlands, i.e. “Rijkswaterstaat” (Ministry of Transport, Public Works and Water Management), the water boards, and the provinces. As such, it consists of a uniform, country-covering dataset that is commercially available to third parties. Two data formats are available for this dataset; the so-called “base database”, which contains filtered eleva-tion points, with X, Y and Z coordinates of the RD (trian-gulation of national grid) and NAP (Amsterdam Ordnance Datum, the Dutch National leveling reference system), and the grid database of the 5×5 m resolution raster data for the EAGLE2006 campaign.
3 Satellite data acquisitions
Table 1. Satellite observations.
Sensor # of channels Spectral range (µm/GHz) Resolution (m) Acq. Date (DOY)
ASTER 14 0.52–11.65µm 15–90 159
MODIS 36 0.4–14.4µm 250–1000 159–164, 168, 169
MERIS 15 0.39–1.04µm 300 159, 161, 162, 165, 168, 169
AATSR 7 0.6–1.6/4, 11, 12µm 1000 159, 162, 165, 168
ASAR 1 5.3 GHz 25–1000 160, 163, 166, 169
[image:5.595.49.286.209.283.2]SEVIRI 11 0.6–14.4µm 3000 159–169
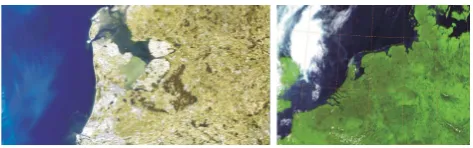
Fig. 3. Parts of a MERIS (left) and SEVIRI scene (right) as acquired
on the 11th and 13th of June respectively over The Netherlands.
Fig. 4. Quicklooks of airborne observations over the Cabauw site.
Left: AHS (R-G-B: channel 04-08-15), middle: CASI (R-G-B: channel 29-17-05) both obtained on 13 June 2006, right: C-band ESAR image acquired on 15 June 2006. (The Cabauw is visible with its shadow near the center-left of the AHS and CASI images and as a white dotted line near the middle of the ESAR image).
4 Airborne data acquisitions
Four airborne sensors were operated during the EAGLE 2006 campaign to acquire valuable data for bio-/geo-physical pa-rameter estimation over the grassland and forest sites. The AHS from INTA and the CASI sensor of ITRES were both mounted on the CASA 212-200 N/S 270 “Paternina” air-plane of INTA. Because the objective of the campaign was primarily aiming at AHS acquisitions the configuration was designed such that if conflicting criteria between AHS and CASI occurred preference was given to AHS. Furthermore, DLR-HR flew a Do228 aircraft that carried their multi-frequency and multi-polarisation Synthetic Aperture Radar system, and ISAFoM operated a Sky-Arrow airplane for flux measurements.
Successful AHS and CASI acquisitions were made on 13 June 2006. Two quicklooks are shown in the left and mid-dle panels of Fig. 4.
900 700 500 300 100
368 370 372 374
Altitude
(m)
CO (ppm)2
900 700 500 300 100
24 26 28
Altitude
(m)
900 700 500 300 100
24 25 26 27 28
Altitude
(m)
450 350 250 150 50
23 24 25 26 27 28
Altitude
(m)
900 700 500 300 100
8 9 10
Altitude
(m)
H O (g*m-3)2
900 700 500 300 100
8.4 8.8 9.2 9.6
Altitude
(m)
H O(g*m-3)2
450 350 250 150 50
9.4 9.8 10.2 10.6 11
Altitude
(m)
H O(g*m-3)2
900 700 500 300 100
370 366
362 374
Altitude
(m)
CO (ppm)2
(C) (C)
[image:5.595.311.547.211.376.2](C)
Fig. 5. Atmospheric profiles as measured by Sky Arrow flux
air-plane over the three sites on 13 June 2006. The left column shows the profiles over the start at the Speulderbos (North), the middle col-umn shows profiles over the Southern part of the Speulderbos, ap-proaching the Loobos area, whereas the right column shows profile measurements over the Cabauw site. From the top to the bottom, the
panels in each column show carbon dioxide (CO2), potential
tem-perature (θ )and water vapour content (H2O), respectively (carbon
dioxide is missig at the Cabauw site).
Eleven ESAR flight tracks were carried on 15 June 2006 to cover the three sites of interest flying X-, C-, and L-band configurations, as well as to obtain an X-band DEM. The right panel of Fig. 4 shows a C band polarimetric image of the Cabauw site.
The Sky Arrow flux flights were performed over the three tower sites to compare the airborne flux measurements with the tower flux measurements, and also to quantify the ex-change of carbon dioxide, sensible and latent heat, momen-tum fluxes between the biosphere and different vegetated sur-faces. Table 2 shows the flight configurations.
[image:5.595.50.287.335.397.2]Table 2. Airborne observations.
Sensor # of channels Spectral range (µm/GHz) Resolution (m) Acq. Date (DOY) Start time (utc)
AHS 80 0.43–12.7µm 2.4 164 09:57
CASI 60 0.41–0.97µm 1.3 164 09:57
ESAR 4 0.35–9.6 GHz 0.7 166 14:42
Sky-ERA Mission ID Target Site
1 Fluxes Speulderbos, Loobos, Cabauw 164 11:41
2 Fluxes and divergence Speulderbos, Loobos 164 16:00
[image:6.595.52.284.235.323.2]3 Fluxes Speulderbos, Loobos 165 11:56
Fig. 6. The processed morning (left) and afternoon (right)
sound-ings output from 13th of June 2006, Cabauw.
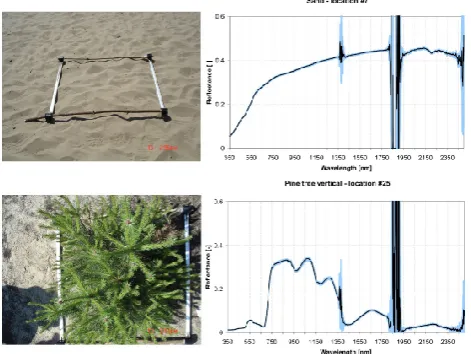
Fig. 7. Example spectra of bright sand (upper panels) and of a
young pine tree (lower panels). The frame on the photos represents
an area of 1×1 m2. On the graphs, the blue area shows the range
of the measured spectra, the black line is the accepted characteris-tic spectrum of the site under consideration. Note the atmospheric disturbances around 1370 and 1850 nm.
5 Atmospheric measurements
Knowledge of the atmospheric conditions, its vertical pro-file and the water vapour content is required to perform ac-curate atmospheric corrections of space and airborne
obser-Table 3. Summary of spectrometric measurement objectives.
Objective Location Instrument Typical target
Reference measurements
Cabauw GER
Water Grass Concrete
Speulderbos ASD
Sand Forest canopy Water Grass Heathland
Angular dependance Cabauw GER
Grass Young maize Speulderbos ASD Forest canopy
Biophysical characteristics Speulderbos ASD Leaves Branches
Water quality Harderwijk ASD Lake water
vations. Two types of measurements were performed. In-situ atmospheric soundings were carried out during airborne overpasses at the Cabauw site (Fig. 6). Furthermore rou-tine measurements carried out at De Bilt, KNMI and at the Cabauw tower site are available as well.
The Cabauw tower site is also part of the CESAR (Cabauw Experimental Site for Atmospheric Research) Consortium. This is a consortium of seven national institutes in the Netherlands working together on land-atmosphere and atmo-spheric research. For the duration of the EAGLE2006 Cam-paign we have direct access to the data recorded and they are included in the EAGLE2006 database.
6 In-situ spectrometric, radiometric and goniometric measurements
Other essential measurements include ground based data, in-cluding radiometric data (radiometric data in both solar range and thermal range data) and goniometric measurements. Ta-ble 3 shows some details of the spectrometric measurements and Fig. 7 illustrates some typical spectral curves.
[image:6.595.317.541.259.400.2] [image:6.595.50.286.377.554.2]10 15 20 25 30 35 Azimuth = 0
Azimuth = 90
-90 -60 -30 0 30 60 90 View angle:
[image:7.595.52.287.64.193.2]T [°C]
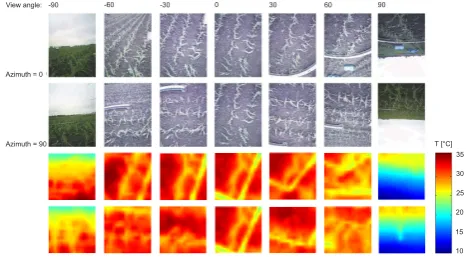
Fig. 8. Goniometer measurements over maize using a digital
photo-camera (upper panels) and a thermal (lower panels) infrared imager.
thermal infrared region with various instruments that include fixed FOV and single band or multi bands radiometers.
The measurements included thermal radiometric temper-atures, emissivities, atmospheric radiances, air temperature, temperature transects and angular measurements within the site area. Table 4 shows the deployed instruments.
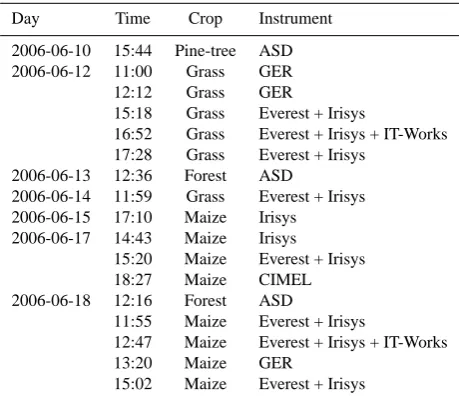
Directional and contact measurements were carried out at the Cabauw and Speulderbos sites. Measurements included several land cover units using several instruments between 10 and 18 June 2006. A summary of the goniometric measure-ments is given in Table 5, whereas an example of the mea-surements over maize at the Cabauw site is shown in Fig. 8.
7 Biophysical (soil, vegetation and water) measurements
The bio-physical measurements made during the EA-GLE2006 intensive campaign included vegetation, soil and water measurements. The vegetation measurements included volume and biomass, as well as radiation penetration and Leaf Area Index measurements. Surface roughness for the Cabauw grassland site was measured with stereo pho-togrammetry using NEar Sensing Camera Field Equipment (NESCAFE).
Soil moisture was measured in the field for calibration and validation of soil moisture measurements through remotely sensed data.
Water quality parameters measured included Secchi depth, turbidity and Chl-a. Unfortunately, it was not possible to take spectra for water quality measurements during the AHS over-flight. Due to weather conditions, the first suitable day was 4 July 2006. Measurements were carried out at the open water of the “Wolderwijd” (which was covered by AHS airborne imagery for this purpose but at an earlier date) near the city of Harderwijk.
In order to obtain a high accuracy, detailed 3-D represen-tation of the Speulderbos forest site, necessary for among
Fig. 9. Example output from the Speulderbos site laser-scanning
recorded on 20 June 2006.
others within-canopy radiation transfer modeling and surface roughness estimates a laser scanning was carried out around the Speulderbos tower site, using the Leica HDS2500 pulsed laser scanner with a single-point range accuracy of +/−4 mm, angular accuracies of +/−60 micro-radians, and a beam spot size of only 6 mm from 0–50 m range, including point-to-point spacing as fine as 1.2 mm@50 m. The scanner was mounted on the elevator of Speulderbos tower site and made slicing of the forest. An example of such scans is shown in Fig. 9.
The geo-locations of these biophysical measurements were recorded using a Leica 1200 RTK-DGPS. Table 6 gives a summary of the locations.
8 Energy balance and micrometeorological measurements
In addition to the reference meteorological data (continu-ous data from Cabauw and Loobos), measurements included standard meteorological measurements at different heights (wind speed and direction, temperature, humidity), sensible heat flux measured with a scintillometer, eddy covariance measurements of heat, water and carbon dioxide transport, contact temperatures of vegetation and soil, soil heat flux, soil moisture content and soil temperature. Measurements were carried out in and near the 44 m tall tower at the Speul-derbos site between 7 and 22 June 2006. A mobile LAS sys-tem was installed at a grassland site next to the Cabauw tower and operated from 13th of June in the afternoon till June the 20st of June 2006 in the morning.
At the Speulderbos site, scintillometer, eddy covariance and radiation measurements were carried out at the top (at 47 m). Other meteorological measurements were conducted just above the canopy crown, around 35 m height. Contact temperatures of different canopy components were measured in the canopy (between 20 and 32 m height), and at ground level. Measurements at ground level were carried out 20 m east of the tower. Table 7 gives an overview of the used in-strumentation.
[image:7.595.311.545.64.132.2]Table 4. Technical specifications of the instruments.
Instrument Spectral
Range
(µm)
Temperature Range (◦C) Accuracy Resolution FOV
Cimel CE312-1 8–13
11.5–12.5 10.5–11.5 8.2–9.2
−80 to 50 0.1 8 mK
50 mK 50 mK 50 mK
10◦
Cimel CE312-2 8–13
11–11.7 10.3–11 8.9–9.3 8.5–8.9 8.1–8.5
−80 to 60 0.1 8 mK
50 mK 50 mK 50 mK 50 mK 50 mK
10◦
Raytek MID 8–14 −40 to 600 1 0.5 30◦(6◦)
Raytek ST 8–14 −32 to 400 1 0.1 7◦–2◦
Optris minisight 8–14 −32 to 530 1 0.7 3◦
NEC TH9100 8–14 −40 to 120 2 0.1 22◦×16◦
[image:8.595.326.526.336.564.2]EVEREST 1000 Fixed to ambient 0.3 0.1
Table 5. Goniometric measurements.
Day Time Crop Instrument 2006-06-10 15:44 Pine-tree ASD 2006-06-12 11:00 Grass GER 12:12 Grass GER
15:18 Grass Everest + Irisys
16:52 Grass Everest + Irisys + IT-Works 17:28 Grass Everest + Irisys
2006-06-13 12:36 Forest ASD
2006-06-14 11:59 Grass Everest + Irisys 2006-06-15 17:10 Maize Irisys
2006-06-17 14:43 Maize Irisys
15:20 Maize Everest + Irisys 18:27 Maize CIMEL 2006-06-18 12:16 Forest ASD
11:55 Maize Everest + Irisys
12:47 Maize Everest + Irisys + IT-Works 13:20 Maize GER
15:02 Maize Everest + Irisys
Temperature and relative humidity were measured at 4 heights: 1, 27, 35 and 47 m above the forest floor (Fig. 10). At 1 m height, temperatures are the lowest and relative hu-midity the highest. In the middle of the canopy, at 27 m, tem-peratures are the highest and relative humidity the lowest.
A comparison is made between wind speed and direction measured at 34 m height, and those derived from the eddy covariance measurements at 47 m height, which showed a consistent difference in wind direction of about 10 degrees, most likely caused by an error in alignment of the
instru-10 15 20 25
T a
(
o C)
T
air 43m
T
air 35m
T
air 27m
T
air 1m
0 6 12 18 24
20 40 60 80
time (hrs) RH (%) RH 43m
RH 35m RH 27m RH 1m
Fig. 10. Temperature and relative humidity at different heights in
Speulderbos versus time of the day, on 17 June 2006.
ments. Wind speed (Fig. 11) is consistently higher at 47 m than at 34 m, as can be expected.
Soil temperature measured at four depths and soil heat flux measured with three heat flux plates installed at 1 cm below the surface are shown in Fig. 12.
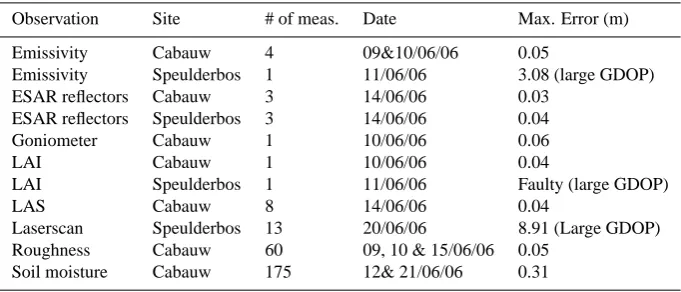
[image:8.595.53.283.355.555.2]Table 6. List of datasets sampled with the Leica RTK-DGPS.
Observation Site # of meas. Date Max. Error (m)
Emissivity Cabauw 4 09&10/06/06 0.05
Emissivity Speulderbos 1 11/06/06 3.08 (large GDOP)
ESAR reflectors Cabauw 3 14/06/06 0.03
ESAR reflectors Speulderbos 3 14/06/06 0.04
Goniometer Cabauw 1 10/06/06 0.06
LAI Cabauw 1 10/06/06 0.04
LAI Speulderbos 1 11/06/06 Faulty (large GDOP)
LAS Cabauw 8 14/06/06 0.04
Laserscan Speulderbos 13 20/06/06 8.91 (Large GDOP)
Roughness Cabauw 60 09, 10 & 15/06/06 0.05
[image:9.595.117.479.283.540.2]Soil moisture Cabauw 175 12& 21/06/06 0.31
Table 7. Meteorological instrumentation Speulderbos. Instruments in italic are owned by Wageningen University, others by ITC.
Datalogger Sensors Height (m)
LAS 47
CR23X CSAT3 sonic anemometer (Campbell Sci. Inc.) 47
LI7500 gas analyzer (Li-cor Biosciences) 47
CR23X Combined temperature and humidity sensor (Campbell Sci. Inc.) 43
Anemometer (Vector Instruments Ltd., UK) 37
Wind direction (Vector Instruments Ltd., UK) 37
CNR1 radiometer (Kipp and Zonen) 35
Combined temperature and humidity sensor (Campbell Sci. Inc.) 34
Combined temperature and humidity sensor (Campbell Sci. Inc.) 27
9 Contact temperature sensors 17–34
Barometer (Campbell Sci. Inc.) 1
CR23X Combined temperature and humidity sensor (Campbell Sci. Inc.) 1
with multiplexer 3 CS616 for soil moisture (Campbell Sci. Inc.) −0.05,
−0.30
−0.55
4 soil thermistors for soil temperature −0.01
−0.03
−0.08
−0.90
8 contact temperature sensors 0–1
3 soil heat flux plates HFP01 (Hukseflux) −0.01
and trunks in the canopy between 17 and 34 m height. Fig-ure 13 shows the measFig-ured surface temperatFig-ures for the sen-sors at ground level (soil, bold) and in the canopy (canopy, normal) for 17 June 2006. Canopy temperatures are higher than soil surface temperatures. The contact temperatures of the canopy on day 165 until 166 (not shown in Fig. 13) fluc-tuated very rapidly due to severe rainfall causing the sensors to malfunction.
Two measurement systems were used to measure turbu-lent fluxes. A Large Aperture Scintillometer (LAS) was used to measure sensible heat flux over the trajectory between the Speulderbos tower and the Drie Forestry tower 2 km north.
The receiver was installed at the top of the Speulderbos tower. An eddy covariance system (EC) consisted of a sonic anemometer (CSAT3, Campbell Sci. Inc., USA) combined with a gas analyzer (CS7500, Campbell Sci. Inc., USA) was used to measure sensible heat flux and the exchange of car-bon dioxide and water at the top of the Speulderbos tower. Figure 14 shows the components of the energy budget, net radiation, soil heat flux, and sensible and latent heat (upper panel) and the flux of carbon dioxide (lower panel), for a clear day (day 168, 17 June) during the campaign.
0 2 4 6 8 0
2 4 6 8
1:1
u
34m (m s −1
) u sonic 47 m
(m s
−1
[image:10.595.72.263.64.233.2])
Fig. 11. Wind speed measured at 47 m height (with a sonic anemometer) versus wind speed measured at 34 m height (with a cup anemometer), in Speulderbos, for all measurements during the field campaign. The dashed line represents a linear regression through the origin.
11 12 13 14 15
Soil temperature (
o C)
T
s −90cm
T
s −8cm
T
s −3cm
T
s −1cm
0 6 12 18 24
−10 0 10 20
time (hrs)
Soil heat flux (W m
−2
) G 1
G 2 G 3
Fig. 12. Soil temperature measured at different depths (upper graph) and soil heat flux measured with three flux plates (lower graph) in Speulderbos versus time of the day, on 17 June 2006.
higher than latent heat flux, whereas on a clouded day (day 172 or 21 June, not shown), latent heat flux is higher than sensible heat flux. Figure 15 shows the energy balance clo-sure: available energy (net radiation less soil heat flux) and the sum of sensible and latent heat flux for all observations during the campaign. A 1:1-line is plotted through the data. The sum of the fluxes in general is lower than the available radiation. This known phenomena in principle can either be
0 6 12 18 24
5 10 15 20 25 30 35
time (hrs)
Surface temperature (
o C)
[image:10.595.329.523.66.237.2]Soil Canopy
Fig. 13. Component surface temperatures of 8 sensors on the litter,
moss and trunks at ground level (soil), and 9 sensors on trunks, branches and needles in the canopy (canopy) in Speulderbos versus time of the day, on 17 June 2007.
0 200 400 600 800 1000
R n
, G, H,
λ
E (W m
−2
) R
n G H
λE
0 6 12 18 24
−10 0 10 20 30
CO
2
flux (
μ
mol m
−2
s
−1
)
time (hrs)
Fig. 14. Sensible (H) and latent (λE) heat flux measured with the
EC system, net radiation (Rn)and average soil heat flux (G) (upper
graph), and downward flux of carbon dioxide (bottom graph), in Speulderbos versus time of the day, on 17 June 2006.
[image:10.595.330.525.316.559.2] [image:10.595.69.264.327.553.2]0 200 400 600 800 −100
0 100 200 300 400 500 600 700
1:1
Rn−G (W m−2)
H+
λ
E (W m
−2
)
[image:11.595.50.281.65.240.2]1:1
Fig. 15. Sum of sensible and latent heat flux versus available energy
(Rn−G) for all measurements during the campaign. The bold line
is a linear regression through the data. The dashed lines denote the standard error.
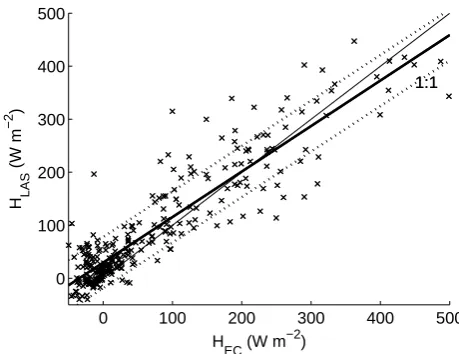
In Fig. 16, the sensible heat fluxes measured with the LAS and with the EC system are compared and a 1:1 line is drawn. In general, the sensible heat flux of the LAS is higher than that of the EC system on cloudy days and lower on clear days. The systematic difference between the two may be attributed to the sensitivity ofHLAS to roughness. The difference be-tween the two systems on specific days may be related to different footprints (Timmermans et al., 2009a). A closer ex-amination into the effects of wind direction, precipitation and stability is needed to explain those differences.
9 Data analysis and preliminary results
The data analysis included simulation of Sentinels (Sentinel-1/2) and retrievals of biophysical products. Advanced prod-ucts that can be expected after further detailed analysis in-clude the following:
– Net ecosystem exchange and footprint analysis above forest and grassland (ESA, 2007)
– Temperature and emissivity from AHS data (Sobrino et al., 2008)
– Modeling fluxes of energy, water and carbon dioxide above the Speulderbos (van der Tol et al., 2009) – BRDF’s acquired by directional radiative measurements
(Timmermans et al., 2008c, 2009b)
– Soil moisture field observations over the Cabauw grass-land (ESA, 2007)
– Technique for validating remote sensing products of wa-ter quality (ESA, 2007)
0 100 200 300 400 500
0 100 200 300 400 500
1:1
H
EC (W m
−2)
H LAS
(W m
−2
)
1:1
Fig. 16. Left: sensible heat flux measured with the
scintillome-ter (HLAS)versus sensible heat flux measured with the EC system
(HEC)for all measurements during the campaign. The bold line is
a linear regression through the data. The dashed lines denote the standard error.
Full details of these data and preliminary products can be found in the EAGLE 2006 final report (Timmermans, et al., 2008a), the description of advanced products are given in contributions to the AgriSAR and EAGLE Final Workshop proceedings (ESA, 2007).
10 Recommendations
This contribution describes the mission objectives of the EAGLE2006 intensive field experiment and provides an overview of the airborne and field measurements. A unique dataset has been acquired, including (quasi)simultaneous SAR and optical (hyperspectral, visible and thermal) and at-mospheric turbulence airborne datasets as well ground mea-surements. Atmospheric data from different ground based sensors has been gathered in combination with in-situ atmo-spheric soundings to characterize the atmoatmo-spheric conditions during airborne and satellite acquisitions. The SAR data are of high quality at different frequencies (with relevance to Sentinel-1 simulation) and the optical data are of high qual-ity as well (for Sentinel-2 simulation). In addition, the turbu-lence data and ground data are also of good quality.
[image:11.595.309.539.70.247.2]analysis of the thermal dynamic characteristics of different canopies and refine the parameterizations in land surface pro-cess models.
With respect to potential products for the Sentinel-1 and Sentinel-2 missions, land cover classification maps currently can be considered as in a pre-operational phase. For soil moisture maps, surface roughness, biomass, fractional veg-etation cover and LAI products, the algorithms are in an ex-perimental stage, whereas maps of actual evapotranspiration can be considered as a potential level 3 experimental product as well (providing the thermal input).
We have observed the need for a continuous agricultural data acquisition to cover a bigger variability of the land sur-face states. To this aspect, a higher crop diversity and vari-ability in surface conditions are needed for future field cam-paigns. In addition, multi-temporal, as well as simultaneous observations with both SAR and optical sensors are desir-able. With respect to ground observations, a higher data ac-quisition frequency might be needed, in combination with the need for investigation of the separation between bio-physiological (vegetation growth) and natural (wind, rain) effects.
Preliminary results on retrieval of biophysical parameters are available and the entire EAGLE2006 dataset allows the development of new processing and retrieval algorithms, and the validation of such algorithms by in-situ, airborne and space-borne data. More details on several processing aspects of the data acquired within the campaigns have been pre-sented elsewhere (ESA, 2008). The multi-disciplinary char-acter of the EAGLE2006 field campaign is considered a very strong aspect. Hence, an intensive analysis by the (very) dif-ferent teams, and external scientific users of the all the col-lected data should be supported.
All data as acquired in and during the EAGLE2006 Field Campaign are available via the Field Campaign ftp site (www.ftp.itc.nl/pub/eagle06/EAGLE2006Database/). Ac-cess is possible via the ESA Principle Investigator portal.
11 List of acronyms
AATSR Advanced Along-Track Scanning Ra-diometer
ABL Atmospheric Boundary Layer
AGRISAR AGRIcultural bio/geophysical retrieval from frequent repeat pass SAR and op-tical imaging
AHN Actual Height model Netherlands AHS Airborne Hyperspectral System ASAR Advanced Synthetic Aperture Radar ASTER Advanced Spaceborne Thermal
Emis-sion and Reflection Radiometer BRDF Bidirectional Reflection Distribution
Factor
CASA-212 Construcciones Aeron´auticas, S.A.-212 CASI Compact Airborne Spectrographic
Im-ager
CESAR Cabauw Experimental Site for Atmo-spheric Research
CHRIS Compact High Resolution Imaging Spectrometer
DEM Digital Elevation Model Do228 Dornier 228
EAGLE Exploitation of AnGular effects in Land surfacE observations from satellites
EC Eddy Covariance
Envisat Environmental satellite
EPS EUMETSAT Polar System
ESA European Space Agency
ESAR Experimental Synthetic aperture Radar
FOV Field Of View
GEOSS Global Earth Observation System of Systems
GMES Global Monitoring for Environment and Security
LAS Large Aperture Scintillometer
MERIS MEdium Resolution Imaging Spectrom-eter
MetOp Meteorological Operational satellite MODIS Moderate Resolution Imaging
Spectro-radiometer
MSG Meteosat Second Generation
NAP Nieuw Amsterdams Peil (Amsterdam Ordnance Datum, the Dutch National leveling reference system)
NESCAFE NEar Sensing Camera Field Equipment NWO Nederlandse organisatie voor Weten-schappelijk Onderzoek (Dutch organisa-tion for scientific research)
PROBA Project for On Board Autonomy SAR Synthetic Aperture Radar SBB Staats Bos Beheer
SEN2FLEX SENtinel-2 and Fluorescence Experi-ment
SEVIRI Spinning Enhanced Visible and InfraRed Imager
SMOS Soil Moisture and Ocean Salinity SPARC Spectra bARrax Campaign
SRON Stichting Ruimte Onderzoek Nederland (Foundation Space Research Nether-lands)
Acknowledgements. This work was funded in part by EU GMES
EAGLE Project (FP6, SST3 – CT – 2003 – 502057), NWO/SRON EO-071 and ESA EAGLE2006 (EOP-SM/1504/RB-dr). We thank all participating institutions and colleagues and students for their
dedications to a very successful campaign. Two anonymous
Edited by: J. Wen
Reviewed by: J. Wen and H. Ishikawa
References
DLR: AGRISAR 2006 – Agricultural Bio-/Geophysical Re-trievals from Frequent Repeat SAR and Optical Imaging, Final Report, http://earth.esa.int/campaigns/DOC/AGRISAR Final Report.pdf, 2008.
ESA: The Changing Earth: New Scientific Challenges for ESA’s Living Planet Programme, ESA SP-1304, 83 pp., 2006. ESA: AgriSAR and EAGLE Final Workshop, ESA-ESTEC
Noord-wijk, 15–16 October 2007, The Netherlands, Proceedings WPP-279, 2007.
Foken, T., Wimmer, F., Mauder, M., Thomas, C., and Liebethal, C.: Some aspects of the energy balance closure problem, Atmos. Chem. Phys., 6, 4395–4402, 2006,
http://www.atmos-chem-phys.net/6/4395/2006/.
GEO, The Global Earth Observation System of Systems (GEOSS) 10-Year Implementation Plan, Reference document, GEO 204/ESA SP-1284, ISBN No.:92-9092-986-3, 93 pp., 2005. Sobrino, J. A., Jim´enez-Mu˜noz, J. C., S`oria, G., G´omez, M., Ortiz,
A. Barella, Romaguera, M., Zaragoza, M., Julien, Y., Cuenca, J., Atitar, M., Hidalgo, V., Franch, B., Mattar, C., Ruescas, A., Morales, L., Gillespie, A., Balick, L., Su, Z., Nerry, F., Peres, L., and Libonati, R.: Thermal remote sensing in the framework of the SEN2FLEX project: field measurements, airborne data and applications, Int. J. Remote Sens., 29(17), 4961–4991, 2008. Su, Z., Timmermans, W. J., Gieske, A., Jia, L., Elbers, J. A.,
Olioso, A., Timmermans, J., Van Der Velde, R., Jin, X.,Van Der Kwast, H., Nerry, F., Sabol, D., Sobrino, J. A., Moreno, J., and Bianchi, R.: Quantification of land-atmosphere exchanges of wa-ter, energy and carbon dioxide in space and time over the hetero-geneous Barrax site, Int. J. Remote Sens., 29(17), 5215–5235, 2008.
Timmermans, J., van der Tol, C., Verhoef, W., and Su, Z.: Con-tact and directional radiative temperature measurements of sun-lit and shaded land surface components during the SEN2FLEX 2005 campaign, Int. J. Remote Sens., 29(17), 5183–5192, 2008c. Timmermans, J., Verhoef, W., Van der Tol, C., Su, Z.: Retrieval of canopy component temperatures through Bayesian inversion of directional thermal measurements, Hydrol. Earth Syst. Sci. Dis-cuss., submitted, 2009b.
Timmermans, W. J., Bertoldi, G., Albertson, J. D., Olioso, A., Su, Z., and Gieske, A. S. M.: Accounting for atmospheric boundary layer variability on flux estimation from RS observations, Int. J. Remote Sens., 29(17), 5275–5290, 2008b.
Timmermans, W. J., Dost, R., and Su, Z.: EAGLE 2006 – EA-GLE Netherlands Multi-purpose, Multi-Angle and Multi-sensor In-situ, Airborne and Space Borne Campaigns over Grassland and Forest, Final report, http://earth.esa.int/campaigns/DOC/ EAGLE Final Report.pdf, 2008a.
Timmermans, W. J., Su, Z., and Olioso, A.: Footprint issues in scin-tillometry over heterogeneous landscapes, Hydrol. Earth Syst. Sci. Discuss., 6, 2099–2127, 2009a,
http://www.hydrol-earth-syst-sci-discuss.net/6/2099/2009/. Ulden A. P. V. and Wieringa J.: Atmospheric boundary layer
re-search at Cabauw, Bound.-Lay. Meteorol., 78, 39–69, 1996. van der Tol, C., van der Tol, S., Verhoef, A., Su, B., Timmermans, J.,
Houldcroft, C., and Gieske, A.: A Bayesian approach to estimate sensible and latent heat over vegetation, Hydrol. Earth Syst. Sci. Discuss., 6, 2337–2365, 2009,