https://doi.org/10.5194/hess-21-2685-2017 © Author(s) 2017. This work is distributed under the Creative Commons Attribution 3.0 License.
A multi-sensor data-driven methodology for all-sky passive
microwave inundation retrieval
Zeinab Takbiri1, Ardeshir M. Ebtehaj1, and Efi Foufoula-Georgiou2,1
1Department of Civil, Environmental and Geo- Engineering and St. Anthony Falls Laboratory, University of Minnesota, Twin Cities, Minneapolis, Minnesota, USA
2Department of Civil and Environmental Engineering, University of California, Irvine, California, USA
Correspondence to:Zeinab Takbiri ([email protected])
Received: 26 October 2016 – Discussion started: 1 November 2016 Revised: 14 March 2017 – Accepted: 7 May 2017 – Published: 8 June 2017
Abstract. We present a multi-sensor Bayesian passive mi-crowave retrieval algorithm for flood inundation mapping at high spatial and temporal resolutions. The algorithm takes advantage of observations from multiple sensors in optical, short-infrared, and microwave bands, thereby allowing for detection and mapping of the sub-pixel fraction of inundated areas under almost all-sky conditions. The method relies on a nearest-neighbor search and a modern sparsity-promoting inversion method that make use of an a priori dataset in the form of two joint dictionaries. These dictionaries con-tain almost overlapping observations by the Special Sensor Microwave Imager and Sounder (SSMIS) on board the De-fense Meteorological Satellite Program (DMSP) F17 satel-lite and the Moderate Resolution Imaging Spectroradiometer (MODIS) on board the Aqua and Terra satellites. Evaluation of the retrieval algorithm over the Mekong Delta shows that it is capable of capturing to a good degree the inundation di-urnal variability due to localized convective precipitation. At longer timescales, the results demonstrate consistency with the ground-based water level observations, denoting that the method is properly capturing inundation seasonal patterns in response to regional monsoonal rain. The calculated Eu-clidean distance, rank-correlation, and also copula quantile analysis demonstrate a good agreement between the outputs of the algorithm and the observed water levels at monthly and daily timescales. The current inundation products are at a resolution of 12.5 km and taken twice per day, but a higher resolution (order of 5 km and every 3 h) can be achieved using the same algorithm with the dictionary populated by the Global Precipitation Mission (GPM) Microwave Imager (GMI) products.
1 Introduction
Flood mapping from space was first accomplished using visible to near-infrared (VNIR) observations (0.4–1.1 µm), by the multispectral scanner system (MSS) sensors on board Landsat-1 (Rango and Anderson, 1974; Rango and Salmonson, 1974; McGinnis and Rango, 1975). In these pioneering works, flooded areas were mapped where the near-infrared surface reflectance was below a certain thresh-old as water absorption is strong in this region. More re-cently, Brakenridge and Anderson (2006) showed that the visible red band 1 (0.62–0.67 µm) and near-infrared (NIR) band 2 (0.84–0.87 µm) from the Moderate Resolution Imag-ing Spectroradiometer (MODIS) aboard the Terra and Aqua satellites can be used to detect water over land surfaces. They mapped several hundreds of flood events at different sites all over the world by classification of water via threshold-ing over the NIR band and the normalized difference veg-etation index, NDVI=(NIR−red)/(NIR+red)introduced by Rouse et al. (1974). To better discriminate the vegetation from inundated areas in threshold-based methods, Ticehurst et al. (2013) and Guerschman et al. (2011) used a new in-dex – called the normalized difference water inin-dex, NDWI=
(red−MIR)/(red+MIR) introduced by Gao (1996) and later modified to MNDWI=(green−MIR)/(green+MIR) by Xu (2006). This index exploits the mid-infrared (MIR; 1.23–1.25 µm) part of the spectrum to improve the map-ping. In all thresholding methods, the shadows of terrains and clouds are usually miss-classified as inundated areas. There-fore, Kuenzer et al. (2015) used the topography and cloud information data as ancillary variables to obtain improved estimates of the interannual dynamics of areas covered with water over five deltaic regions with high annual cloud cover. The use of passive microwaves (PMW) to map flooded areas was pioneered by Allison et al. (1979), Giddings and Choudhury (1989), and Choudhury (1991). Allison et al. (1979) used horizontal polarization of brightness temper-atures (Tb) at 19.3 GHz, from the electrically scanning mi-crowave radiometer (ESMR) on board the Nimbus-5 satel-lite, to delineate flooded regions in Australia. Giddings and Choudhury (1989) reported the 37 GHz vertical and hori-zontal polarization differences (i.e., Tb37v−Tb37h), from the Scanning Multi-frequency Microwave Radiometer (SMMR) on board the Nimbus-7 satellite, as the most responsive chan-nel to identify the seasonal changes in the extent of flood-plains over South America. Temimi et al. (2005) used the empirical basin wetness index (BWI) defined by Basist et al. (1998), to obtain real-time water surface fraction (WSF) in the Mackenzie River basin, using multi-frequency infor-mation at 19, 37, and 85 GHz. To minimize the contamina-tion effects of atmospheric emission and variacontamina-tions of surface temperatures, Brakenridge et al. (2007) exploited the ratio of Tb values over inundated and dry surfaces at 36 GHz and presented promising results over several river sites all over the globe, using the PMW observations by the Advanced Microwave Scanning Radiometer – Earth Observing System (AMSR-E). De Groeve (2010) also used the same method
and instrument to map floods for several hundreds of loca-tions for the Global Disaster Alert and Coordination System. While visible and shortwave-infrared bands often provide sub-kilometer resolution for inundation mapping, their capa-bility is very limited in a cloudy sky. This limitation is usu-ally very restrictive over prone-to-flooding watersheds and deltas in tropical regions with a high-frequency of heavy pre-cipitation events. For instance, a long-term analysis of Land-sat data revealed that due to cloud contamination, only 30 % of overpasses are useful for inundation mapping (Melack et al., 1994). Because of this limitation, most of the related satellite products, including the MODIS inundation prod-ucts, are available mostly in monthly, seasonal, and/or an-nual timescales (Ordoyne and Friedl, 2008). However, mi-crowaves can penetrate clouds – and to some extent hy-drometeors in frequencies≤37 GHz – to provide water in-undation mapping in almost all weather conditions. Unfortu-nately, due to the coarse resolution of microwave data, e.g., (47×74)km2at 19 GHz to(13×16)km2at 183 GHz for the SSMIS), only large water bodies can be detected and sub-pixel inundated areas cannot be directly identified (Smith, 1997). Presently, there exist several sensors on board dif-ferent satellites that overlap in the spatial and time domains that sample land–atmosphere signals at different wavelengths of the electromagnetic spectrum. Therefore, it is impera-tive to integrate these multi-sensor observations to overcome their individual shortcomings and improve retrievals of land– atmosphere parameters and the extent of flooded areas (Pri-gent et al., 2001, 2007; Crétaux et al., 2011; Temimi et al., 2011; Schroeder et al., 2010).
good degree of accuracy to recover inundated surfaces un-der cloudy conditions as well. It should be acknowledged that there is an uncertainty for the inundation retrieval under heavy rainy/cloudy skies when only the information in the clear-sky dataset is used. However, we expect that this uncer-tainty will be small since the information of the underlying surfaces in low-frequency channels of the collected dataset remains almost the same over different atmospheric condi-tions.
The collected dataset has a large number of linked pairs of inundation fraction data from MODIS data SSMIS multi-frequency brightness temperatures. For algorithmic devel-opment, the dataset is organized into two fat matrices: the brightness temperature and inundation dictionaries. For an observed pixel-level brightness temperature, the proposed passive retrieval algorithm uses the nearest-neighbor search to isolate a few vectors in the dictionary of brightness temper-atures and their corresponding inundation fraction and then use them to estimate the unknown inundation fraction. The proposed retrieval algorithm is applied to estimate daily in-undation fraction at spatial resolution of 12.5 km over the Mekong in 2015. The main motivation for selecting this delta as a case study is that approximately 90 % of the Mekong region is covered by clouds during the rainy season (Leinenkugel et al., 2013), which severely hampers the use of inundation mapping in the VNIR bands. We retrieve the in-undation fraction twice per day using the proposed algorithm over the Mekong Delta and compare the results with the flood products of VNIR data during clear skies. We also evaluated the results against the daily and monthly water level data ob-tained from 11 gauges over the Mekong Delta (Fig. 1) to ex-amine consistency of the retrievals with the regional inunda-tion patterns.
This paper is organized as follows. Section 2 explains the a priori dataset and the formation of the dictionaries and Sect. 3 provides detailed information about the retrieval algorithm. Implementation of the method and validation are explained in Sect. 4. Section 5 presents concluding remarks and direc-tions for future research.
2 Study area and dataset
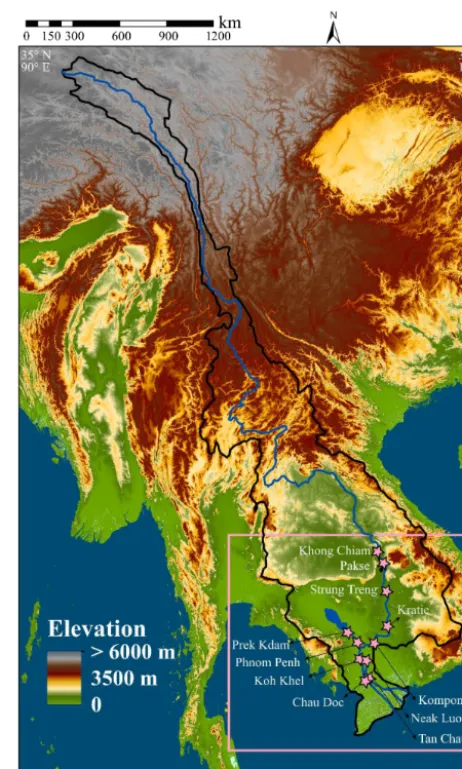
[image:3.612.312.543.65.450.2]The 60 000 km2 Mekong Delta is in South Vietnam (see Fig. 1) with a tropical monsoon climate system. The delta with its agricultural industry is one of the most important sources of food supply to Southeast Asia. This critical region is home to nearly 20 million people, approximately 22 % of the population of Vietnam, and is one of the most densely populated regions in the world. The area has been exposed to exacerbated erosion due to human activities and increased sea level rise and lowland flood events in the recent decades (e.g., Syvitski et al., 2005; Ericson et al., 2006; Nicholls and Cazenave, 2010; Tessler et al., 2015). Improved quantifica-tion of (near) real-time inundaquantifica-tion of the Mekong Delta can
Figure 1.Map and digital elevation of the Mekong River basin (area=795 000 km2) and its delta. The study area is delineated by a pink rectangle. The 11 stations (from Mekong River Commission) that monitor the water level are also marked by pink stars.
help (1) to improve flood forecasting by identifying the in-undated and thus soil saturated zones and (2) to identify ero-sional and depositional hotspots that can improve geomor-phologic and ecosystem modeling. The proposed retrieval al-gorithm is applied to estimate sub-daily inundation fraction at resolution of 12.5 km over some of the lower regions of the Mekong Delta in calendar year 2015 (Fig. 1).
the earth in opposite directions: Terra has an ascending orbit with the local equatorial crossing time of 10:30 LT and Aqua has a descending orbit with the local equatorial crossing time of 01:30 p.m. MWP products are binary information of in-undation based on the Dartmouth Flood Observatory (DFO) algorithm, which uses a thresholding scheme on MODIS ob-servations at band 1 (0.62–0.67 µm), band 2 (0.84–0.87 µm), and band 7 (2.10–2.15 µm). To minimize the contamination effects of cloud and terrain shadows, we focus on 3-day com-posite MWP products (3D3ON). Clearly, the use of the 3-day composite MODIS-MWP data can affect daily inundation re-trievals; however, in the context of the presented algorithm this is the best choice because, daily MODIS-MWP compos-ites are very uncertain due to the terrain shadows and clouds (Nigro et al., 2014). Typically, there are numerous missing pixels in the daily products, which reduce the sample size dramatically. These errors are significantly reduced in 3-day composite products, as it is less likely that clouds (and their shadows) stay at the same spot during a 3 day period (Nigro et al., 2014).
The microwave data are obtained from the DMSP SSM/I-SSMIS Pathfinder Daily Equal-Area Scalable Earth Grid (EASE-Grid; see Armstrong and Brodzik, 1995) brightness temperatures distributed by the National Snow and Ice Data Center (NSIDC). These datasets are at four central frequen-cies 19, 22, 37, and 91 GHz. All channels are vertically and horizontally polarized except channel 22 GHz. The effec-tive resolution of the highest frequency channel is∼12.5 km while low-resolution channels are projected onto a grid size of ∼25 km. DMSP SSM/I-SSMIS brightness temperature data products are from observations by the SSM/I and SSMIS radiometer on board the DMSP F8, 11, 13, or 17. Since De-cember 2006, the F17 satellite has been the only operational satellite from the DMSP series, which carries on board the SSMIS instrument with equatorial crossing times of 05:30– 06:30 a.m. and 17:30–18:30 p.m. for the descending and as-cending orbits, respectively. It is important to note that be-cause these satellites revisit every point on Earth at the same local time, repeatedly, the paired MODIS-MWP with DMSP SSMIS data have a fixed diurnal time difference in the entire dataset. Since the MODIS-MWP data are from the combina-tion of Terra and Aqua observacombina-tions, their time tag is advan-tageous in the sense that it allows us to enrich the number of samples for the diurnal cycle of inundation dynamics.
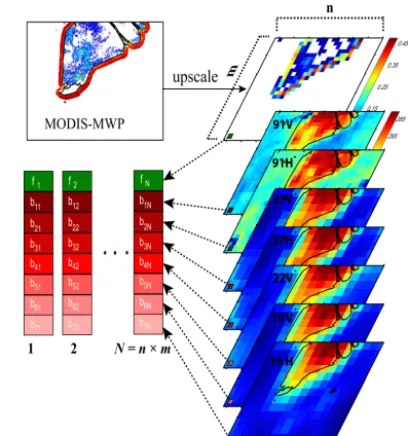
The first step for building the a priori dataset is to match the different space–time resolutions of the multi-sensor infor-mation. To unify the spatial resolution of the microwave data, the brightness temperatures of the three lower-frequency channels are mapped onto the latitude–longitude grids of the high-frequency channel of 91 GHz with a resolution
∼12.5 km, using a nearest-neighbor interpolation. Then the clear-sky MWP data are also upscaled from 250 m to 12.5 km and projected onto the same grids. In the process of upscal-ing the binary MWP data, we assigned to each upscaled pixel a scalar inundation fraction numberf that represents the
ra-Figure 2.A schematic showing construction steps of the a priori dataset for dictionaries. The top slab is the upscaled MODIS-MWP and the other slabs are the brightness temperature data at seven fre-quency bands. Each vector on the left is created by stacking a pixel-level information of the multi-frequency brightness temperatures by the SSMIS radiometer and their corresponding inundation fractions from the MWP product at 12.5 km resolution. This process is re-peated for each orbit to generate a large number of vectors and form separate dictionaries for ascending and descending orbits using all satellite overpasses in 5 years from 2010 to 2014.N=n×mis the number of collected vectors for 1 day in a year. The same process is conducted for each day in 5 years (2010–2014) to create the dictio-naries withM=
5×365 P
i=1
Ni vectors.
tio of the number of inundated sub-pixels to the total number of sub-pixels within a pixel size of 12.5 km. For matching the timescales of Tb and MWP values, the Tb values are av-eraged over a 3-day time window to minimize the possible effects of cloud contamination in the VNIR data. Figure 2 demonstrates schematically the process of producing the ex-plained dataset.
3 The retrieval algorithm
[image:4.612.323.527.66.284.2]con-sists of scalar values of inundation fractions for each corre-sponding pixel in Tb. In other words, the inundation frac-tion for each Tb in the brightness temperature dicfrac-tionary is known. The algorithm uses the information embedded in these two dictionaries to estimate the unknown inundation fractions for each Tb observation vector. First, it searches the brightness temperature dictionary to find theKmost similar vectors in the Euclidean sense to the Tb observation vector through the K-nearest-neighbors algorithm. Then, for these K-nearest-neighbors, the corresponding known scalar values in the inundation fraction dictionary are picked. If the ratio of the number of inundated vectors in K-nearest neighbors is greater than a threshold (which will be explained later), this pixel is called inundated and the algorithm goes to the estimation step. In the estimation step, the coefficients that can optimally estimate the Tb observation vector based on its K-nearest neighbors are calculated through a least-squares regularization approach. Those coefficients are then used to linearly combine theK known inundation fractions that are associated with the neighboring Tb vectors for calculating the unknown inundation fraction. The above detection and estimation steps are repeated for each orbit at a pixel level of 12.5 km over the study area. The algorithm is mathematically described in what follows.
To organize the dataset in an algebraically tractable man-ner, M vectors of microwave brightness temperaturesbi=
(Tb1i,Tb2i, . . .,Tbni)T∈Rnatnfrequency channels are
col-lected. These vectors form the column space of an n-by-M matrix B=[b1|b2|. . .|bM]∈Rn×M, called a brightness
temperature dictionary, whereMn. Analogously, the cor-responding inundation fraction values {fi}Mi=1 can be
col-lected in the column space of the inundation dictionaryF=
f1|f2|. . .|fM∈R1×M. For each vectorbiin the dictionary
of brightness temperatures there is an inundation fractionfi
from MODIS-MWP. The collection of these pairs from his-torical observations forms the two dictionariesBandF. The algorithm follows two sequential steps: a detection and an estimation step. In the detection step, for each observed vec-tor of brightness temperaturebobs, the algorithm first finds its K-neighboring brightness temperatures inBin the Euclidean sense and stores them in the column space of Bs∈Rn×K. Then, knowing the column indices of the neighboring bright-ness temperatures, it isolates their corresponding inundation fraction values in Fs∈R1×K. In this step, if at leastp×K number of nearby inundation fraction values inFs are non-zero, the algorithm assumes that bobs is over an inundated pixel and attempts to estimate the fraction of inundation in the estimation step. Here,p∈(0−1)is the detection proba-bility parameter. It should be also noted that the K-nearest-neighbor algorithm in this paper does not directly constrain its search to any specific time or location. In other words, for every pixel-level vector of Tb, theK-nearest-neighbors algo-rithm searches the entire dictionary regardless of any specific time or spatial coherency.
In the estimation step, the method assumes thatbobscan be estimated by a linear combination of a few column vectors of Bsas follows:
bobs=Bsc+e, (1)
where the vector c∈RK contains a set of representation coefficients to be estimated ande∈Rn is the error vector. Clearly, for an observed vector of brightness temperatures
bobs, the goal is to estimate its unknown inundation fraction valuefˆ. We assume that the two paired dictionariesBs and Fsrepresent similar manifolds in a geometric sense that their local structures can be approximated well with the same lin-ear model. This allows us to assume that the representation coefficients in vectorcfrom Eq. (1) can be used to estimate the inundation fractionfˆas follows:
ˆ
f =Fsc. (2)
As a result, using a classic-weighted least-squares method, the representation coefficientsccan be estimated as
ˆ
c=argmincnkWbobs−Bsck22
o
, (3)
whereW is a weight matrix (to be discussed later in this section) that characterizes the importance of each channel in the retrieval scheme. The number ofK-nearest neighbors is often larger than the number of frequency channels,kn, makingBsa rank-deficient matrix and the above problem ill-posed. To make the optimization problem (Eq. 3) well-posed, we use a mixed`1–`2-norm regularization as follows:
c=ArgmincnkW(bobs−Bsc)k22+λ1kck1+λ2kck22
o
subject toc0,1Tc=1, (4)
which has been successfully used for passive microwave precipitation retrievals (Ebtehaj et al., 2015a, b). The non-negativity of the coefficients assures positivity of the bright-ness temperatures and the sum-to-one constraint enforces an unbiased estimation. The regularization involves both the `1-normkck1=
K P
i=1
|ci|and the`2-normkck2=(
K P
i=1
|ci|2) 1 2. The parametersλ1andλ2in Eq. (4) are regularization param-eters that enforce a trade-off between the two regularizations `1and`2. In this mixed regularization, the`1-norm leverages sparsity in the solution (i.e., forces some of the elements of
Yes Yes
Is the number of inundated pixels within the Knn
greater than p K× ?
Find K-nearest neighbors of bobs i from B to create Bs
i = 1: N
Find the K corresponding fi from F to create Fs
ˆ
f = 0
( )
{
2 2}
obs 2 1 1 2 2
Argmin − s + λ +λ
c W b B c c c
ˆi F cs ˆ
f ≈
i = N
No End
No
Create B and F dictionaries
Input Tb images at 7 frequency Channels that has N pixels (number of bobs vectors) Input fixed parameter: K, , , , λ λ α1 2 p
[image:6.612.83.247.66.408.2]Input coincidentalfs and Tbs Start
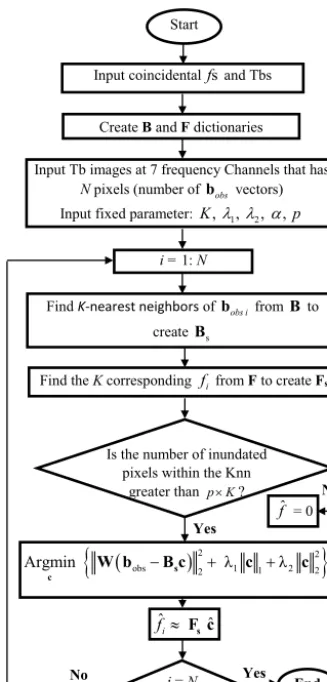
Figure 3.Flowchart of the inundation retrieval algorithm forN pix-els in each orbit, where Knn stands for theK-nearest neighbor. See text for definitions of the notations and detailed explanation.
the potential correlation between those clustered neighbors and makes the problem sufficiently stable. The proposed al-gorithm is summarized in a flowchart shown in Fig. 3.
As previously noted, in the current implementation of the proposed retrieval algorithm, we focus on (almost) co-incidental observations of the brightness temperatures and inundation fractions by the SSMIS and MODIS instru-ments, respectively. The dictionariesBandFare constructed using 5 years of overlapping data (2010–2014) over the Mekong Delta (latitude: 0–10◦N and longitude: 100–110◦E) at 12.5 km grid resolution (Fig. 1).
To build the dictionary, only the clear-sky MODIS-MWP products were considered. At resolution 12.5 km, we labeled a pixel as clear-sky when less than 50 % of the VNIR data at resolution 250 m is flagged as non-cloudy. Because the MODIS sensor has a much higher resolution than the foot-print of SSMIS and because the number of cloud-free sam-ples over the Mekong are very limited, a threshold above zero is deployed to keep a certain number of partially cloudy pix-els and make sure that the dictionary will not be
undersam-pled. For choosing the threshold, we conducted some sensi-tivity analysis (not shown here) and found a 50 % threshold, as a fair probability choice, results in a minimum of potential biases.
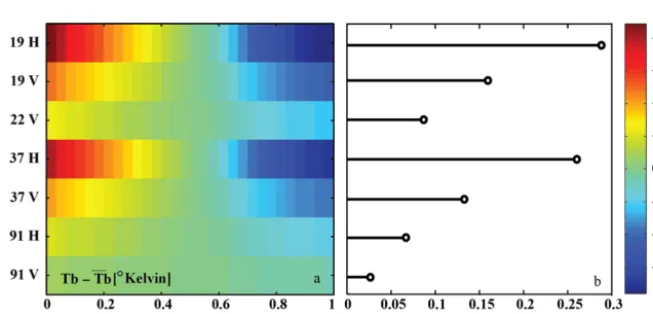
Since the DMSP satellites have two different equatorial crossing times, here, we use two sets of dictionaries for Tb values in the ascending (day or morning) and descending (night or evening) orbits. From all the available coincident observations, we randomly chose 2×10⁶pairs of brightness temperatures and inundation fractions in each ascending and descending dictionary. The purpose of stratifying the dictio-naries into ascending and descending orbits is to exclude the effects of Tb modulations from the retrieval process caused by the systematic diurnal variation of surface temperature. In other words, the same inundation fraction has different PMW spectral signature in a daytime versus a nighttime overpass largely due to the diurnal variability of skin temperature, pre-cipitation, and soil moisture (see Mears et al., 2002; Ramage and Isacks, 2003; Norouzi et al., 2012). Figure 4a presents the systematic difference between the Tbs of the ascending versus descending tracks for various ranges of pixel-level inundated fractions. In effect, in this figure, the Tbs in the dictionaries are grouped into five intervals based on their corresponding inundation fraction (from 0 to 1) inF. Then for each interval, the average of Tb values is shown. The plot clearly demonstrates that the daytime Tbs are thermally warmer than their nighttime counterparts and this difference begins to shrink when the inundation fraction increases. It is worth noting that the difference between ascending and descending brightness temperatures is larger over the low-frequency channels (≤37 GHz) as they respond more to the land surface structural variability than the higher-frequency channels that capture atmospheric signatures. Figure 4b de-picts|TbA−TbD|where TbAand TbDstands for ascending and descending overpasses, respectively. It can be observed that high values of|TbA−TbD| depict the coastlines, i.e., regions with the transient presence and/or absence of water over land.
The probability of detection,p∈(0−1), determines if a pixel is inundated or not if the number of inundated vectors inK-nearest neighbors is≥p×K. We found that the in-undation detection withK≥50 gives a reasonable rate for the probability of hit and false alarms. In other words, the probability of detection does not change significantly for a larger number of nearest neighbors. In the estimation step, to characterize the weight matrixW∈Rn×n, we used the
Figure 4. (a)The systematic difference between passive microwave observations from the ascending (solid lines) and descending orbits (broken lines) as a function of five different sub-pixel intervals of inundation fractions. (b)July to December daily average of absolute differences between the ascending (TbA)and descending (TbD)brightness temperatures at vertically polarized 19 GHz channel. The values
of|TbA−TbD|mainly capture the coastal regions with significant variability in their surface emissivity values due frequent diurnal tidal
[image:7.612.133.460.67.209.2]effects.
Figure 5.The normalized coefficients of variation (right panel) of the brightness temperatures (Tb) (left panel) averaged over the entire dataset for different intervals of inundation fractions. Here,Tb denotes the average of brightness temperatures over the inundation fractions.¯
The coefficients of variation of each channel are used to determine the channel weights for the retrieval algorithm. Channels 19 H GHz and 37 V GHz are the most responsive channels to the variability of inundation fraction and are given higher weights.
to lower-frequency channels. The high-frequency channels mainly capture the information content of the atmospheric profile. Therefore, incorporating them in the proposed re-trieval framework allows us to indirectly consider the effect of atmospheric conditions by narrowing down the search for K-nearest neighbors to those Tb candidates that best match both the underlying land surface emissivity and the atmo-spheric conditions.
For implementation of the algorithm, the regularization parameters are set asλ1=λ(1−α)andλ2=αλ, whereα∈ (0,1). Here, through validation studies, through cross-validation we empirically found thatλ=0.001 andα=0.1 provide a reasonable balance between sparsity and stability of the solution in Eq. (4). It should be noted that Eq. (4) is converted to a constrained quadratic programming problem and solved using an iterative Newton’s method with MAT-LAB optimization Toolbox (see Coleman et al., 1999).
4 Results, validation, and discussion
The inundation fractions were estimated during the wet pe-riod of calendar year 2015 from July to December when the water levels across the delta begin to rise and eventually re-cede (see Fig. 6). The wet season of the region is largely characterized by heavy precipitation as a result of the inter-actions of two monsoons including the Indian monsoon and the East Asia–western North Pacific summer monsoon (Del-gado et al., 2012).
[image:7.612.134.461.286.443.2]Figure 6.Inundated map of the Mekong Delta in the wet (July–December) and dry (January–June) seasons for the ascending orbits. The results of the proposed retrieval algorithm are presented using the ascending dictionary (top row) against the upscaled MODIS near-real-time (NRT) water product (MWP) data (bottom row). Overall, a good agreement is observed with some overestimation of inundated areas by the proposed algorithm compared to MODIS-MWP data around the river banks.
dry season and reaches the value of 0.34 for the wet sea-son, which might be due to the generalization of the algo-rithm and MODIS missing data during the wet season. The MODIS daily data, especially in the wet season, contain a large number of missing values due to cloud blockages and frequent heavy rains over the study area. In fact, while we were collecting the overlapping data for constructing the dic-tionaries, we observed that over 88 % of the MWP products have some missing portion in the 12.5 km resolution. As a result, it is very likely that the MWP data underestimate the actual inundation fraction of regions with prolonged precipi-tation events.
Figure 6 shows that the algorithm is capable of identifying hotspots of inundation when its outputs are compared with the MODIS-MWP; however, the algorithm slightly overesti-mates the inundation fractions for some pixels farther from the coastlines, most of which are completely dry in MWP. Here for brevity, we only show the results for ascending overpasses, while similar spatial patterns are observed for descending overpasses. Figure 6 also shows some overesti-mation of inundation fractions near the riverbanks of ma-jor rivers. This might be due to the high soil moisture con-tent (≥0.8) during the wet season that increases the dielec-tric constant of the soil up to 30–50 (Alharthi and Lange, 1987), which is close to the dielectric constant of the wa-ter surfaces (75–80). Another reason is the cloud coverage. Since the riverbanks are inundated less frequently than the coastlines, it is possible that these few inundation events were
missed by MODIS because of the cloud blockages. There is also some underestimation in the inundation fractions from the proposed algorithm over the hillslopes far away from the riverbanks compared to the MODIS-MWP product. Those sporadically inundated areas, which appear on the MODIS-MWP map (Fig. 6b, c), can be due to the terrain shadows that are misclassified as water. While we cannot directly prove the above assertion within the scope of this paper, the elevation map (Fig. 1) indicates that those hillslopes are very unlikely to get inundated.
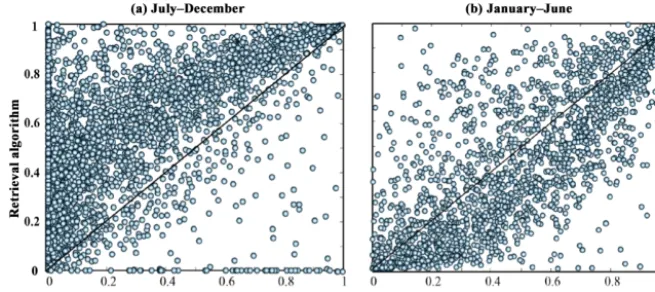
Figure 7.Scatterplots of daily inundation fractions (f )from the retrieval algorithm against those from MODIS-MWP in wet(a)and dry seasons(b)shown in Fig. 6. The scatterplots demonstrate larger inundation fractions from the retrieval algorithm in July to December(a)
compared to MODIS-MWP data. However, in January to June, when there are fewer clouds, the inundation fractions from the proposed algorithm are more correlated with the MODIS-MWP data, with only a slight underestimation of their variability.
is masked because of the all-sky retrieval capability of the proposed algorithm in the presence of the clouds and heavy rains. The reason for this underestimation might stem from the choice of 50 % threshold for selecting the clear-sky pix-els. In other words, there are a set of brightness tempera-tures for which the corresponding MODIS data are partially cloudy and potentially underestimate the actual inundation fraction. As a result, it is likely that those pairs will be iso-lated, used in the retrievals, and eventually lead to some un-derestimation in passive microwave retrievals.
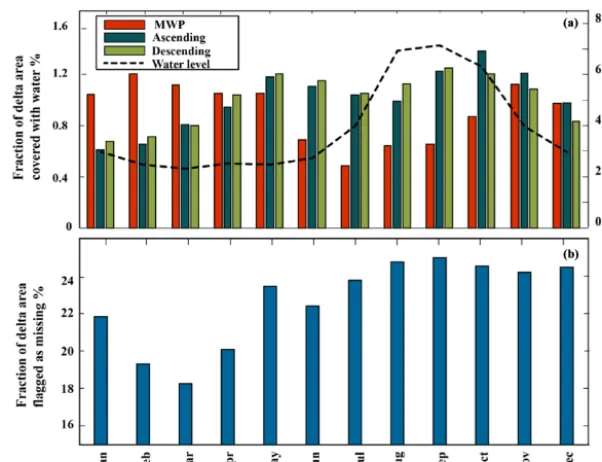
As previously mentioned, the interannual climatology of the Mekong Delta is highly affected by two tropical mon-soons that characterize the seasonal patterns of precipitation, river stages, and water levels (Delgado et al., 2012). To better understand whether the results of our retrieval algorithm fol-low the regional climatology, the monthly percentage of in-undated area over the Mekong Delta is calculated and shown against the monthly water level data in Fig. 8a. The monthly water level data are obtained by averaging over all 11 stations shown in Fig. 1. The specific goal is to compare the monthly variability of the algorithm outputs with the MWP products and investigate whether they are consistent with the regional variations of the surface water level (river stage), which is considered a surrogate for the extent of inundation. It should be acknowledged that this approach is not a direct validation; however, it can provide insight into the performance and cli-matological consistency of the proposed model as the surface water level data are positively correlated with the extent of the inundated surfaces.
The seasonal variations in the monthly percentage of the total inundated surfaces from the proposed model follow the trend of monthly water level data better than the standard MWP products (Fig. 8a). We can see that during the wet months of June to November, the MWP data report much less inundated area than the outputs of the proposed algo-rithm, whereas this pattern is reversed during the dry months
of January to March. As previously noted, we suspect that the differences in the wet season are due to the large portion of missing data in the MWP products because of the high cloud coverage in the rainy season (Fig. 8b). For quantita-tive comparison of the outputs of the algorithm with MWP, a Euclidean distance between normalized version of the algo-rithm outputs and water level data is calculated and compared with its MWP counterpart. The Euclidean distance between water level and the retrieved inundation from ascending and descending orbits is 3.46 and 3.56, respectively, while this distance for MWP and water level data is about 7.89, which is more than twice the distances calculated from the microwave retrieval results. This indicates the superior performance of the proposed inundation fraction retrievals as compared to the MWP products, chiefly because of its all-sky skills dur-ing the rain dominant seasons.
When is compared to MODIS-MWP, the inundated area obtained by the retrieval algorithm in the dry months (Fig. 8a) shows some underestimation. One reason for this underestimation is the general limitation of the empirical Bayesian estimation method regarding the extreme events (see Coles and Powell, 1996, and the references therein) and we suspect that it is not just limited to the months of Jan-uary to March but it affects the retrievals at other months to a lesser extent, as well. This limitation arises by the sample scarcity of large flooding scenarios during the warm months of the year, which probably lead to the underestimation of in-undation fractions related to those events by our retrieval al-gorithm. We expect that by improving the representativeness of the dataset – especially for extreme events in the summer months – this shortcoming can be significantly improved.
Figure 8.The monthly inundated areas of the Mekong Delta calculated from the proposed retrieval algorithm and MODIS near-real-time (NRT) water product (MWP) data in comparison with ground-based monthly water level data.(a)Comparison of the total inundated surface of the Mekong Delta from MWP products and the retrieval algorithm from ascending and descending dictionaries. From visual inspection, it is obvious that the retrieval algorithm can better follow variations of the water levels compared to MWP. More inundation over the dry season is reported by MWP products than the wet season, which contradicts the causality between rivers’ stages and the extent of inundated areas.
(b)The total fraction of land surface areas that are labeled as missing in MWP product because of atmospheric contaminations. The larger deviations of the MWP products from water level data during the wet months might be attributed to the larger percentage of missing values.
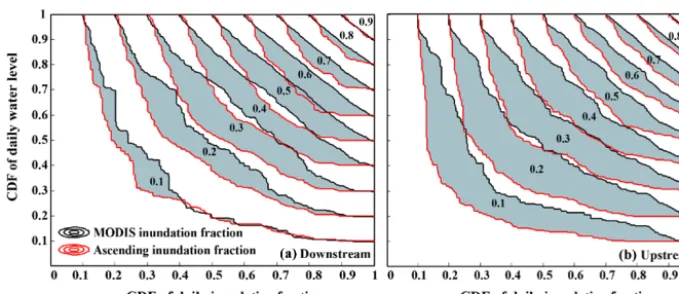
diurnal patterns of the precipitation over the Mekong Delta. Indeed, it is well documented (Gupta 2005) that localized convective precipitation events are more likely during the evening, which can increase the extent of the inundated ar-eas. To further assess the proposed algorithm performance at a daily scale, we compare the dependence of the total area of ascending daily inundation fractions of the algorith-mic outputs with the average daily water level data, using Spearman’s rank-correlation coefficient. The rationale is that a stronger rank correlation of an inundation product with the water level data implies an improved retrieval. The correla-tion coefficient between the daily water level of the rivers and the total inundated surfaces of the Mekong Delta is equal to 0.22, which drops to−0.38 for the MWP products. To go be-yond a rank correlation, we also examined the dependence structures across different ranges of inundation and water level quantiles using an empirical copula (see Appendix A1). Copulas provide an effective non-parametric way for sim-ple representation of multivariate joint distributions of high-dimensional random variables to describe their dependence structure. When dependence of two random variables in-creases, their bivariate “L-shaped” cumulative copulas tend more to the origin. In Fig. 9, the axes show the marginal quantiles of daily inundation fractions versus those of water level elevations and the contours trace the cumulative copu-las. To characterize the dependence of water level and
inun-dation as a function of topography, we divided the study area into two sub-regions covering the steeper upper parts (above the Phnom Penh gauge in Fig. 1) and the flatter downstream region. The copula analysis for each region was presented separately in Fig. 9. As is evident, the empirical copula of the total daily inundation fraction from the proposed algo-rithm shows higher degree of dependence to the water level, as compared to MWP, especially for the quantiles with less than 0.8 cumulative probability for both upstream and the downstream regions. However, comparing the downstream (Fig. 9a) and the upstream (Fig. 9b) regions, we see an in-creased dependency of the retrievals with the water levels in the upstream region. This observation seems to be consis-tent from a geomorphological point of view, because over a steeper region of the basin the hill slopes are naturally steeper and any small water variability can give rise to signif-icant water extension of inundated areas. However, over fat floodplains water levels and extent of inundations may not be strongly correlated as small changes of water levels may give rise a large extension of flooded surfaces.
5 Conclusions and future directions
mi-Figure 9.The empirical copula (joint probability distribution of quantiles) of the average daily water level and total daily inundated areas from the proposed retrieval algorithm (red curves) and MODIS-MWP data (black curves) for 2015. These plots indicate that our products have stronger dependence to water levels than the MWP products (more L-shaped curves) for both the downstream(a)and upstream(b)
regions of the Mekong Delta. The shaded areas (which quantify the difference between the degree of dependence of our products and the MWP products to the daily water levels) are larger in the upstream region, indicating an enhanced performance of the proposed algorithm to retrieve inundation fraction where potential inundation areas are better defined due to topography, e.g., around major riverbanks.
crowave bands. The key idea of the proposed method was to explore the links between overlapping daily high-resolution observations in the visible and near-infrared bands from the MODIS and the lower-resolution passive microwave ob-servations from the Special Sensor Microwave Imager and Sounder (SSMIS) sensor. The developed multi-frequency in-undation retrieval algorithm uses the K-nearest matching method in conjunction with a sparsity-promoting regulariza-tion technique. The proposed method demonstrated promis-ing results in resolvpromis-ing the spatial patterns of inundation, compared with the MODIS-MWP data. Over the months with high cloud coverage, the monthly results are consistent with the seasonal dynamics of water level variation, which is controlled by tropical monsoons in the Mekong Delta. Anal-ysis also showed that, at a daily timescale, the outputs of the algorithm exhibit stronger dependency with the water level data than the MWP data.
There were three major sources of uncertainty in the pro-posed retrieval model in this paper. The first one related to the use of the 3-day composite MODIS-MWP data (daily prod-ucts of MODIS-MWP were avoided due to missing values and cloud blockages), which might have introduced some bias in the daily retrievals due to mismatch of timescales. This source of error can be significantly reduced if the MODIS dictionary is populated with more accurate daily products. The second source of error related to the lack of adequate fully clear-sky samples in our dictionary and there-fore the need to define a cloud coverage threshold in order to increase the sample size. Using partially cloudy MODIS data was the main reason for some observed underestimation of inundation fractions, especially in the dry months (Figs. 7 and 8), which can be mitigated by increasing the sample size. The last source of error was more related to the general lim-itation of the Bayesian estimation method regarding the
re-trieval of extreme events (see Coles and Powell, 1996, and references therein). This limitation is due to scarcity of large floods in the dictionary, which can be treated by adding more scenarios of extreme events to the dataset from different ge-ographic locations.
One of the limitations of the proposed algorithm (because of the spatial resolution of microwave data used in this pa-per) was its lack of information about the spatial patterns of inundation within the 12.5 km pixels. The spatial pattern of the estimated inundation fractions can be further enhanced by using the guidance of a high-resolution topographic data (see Galantowicz, 2002). The database can also expand to in-clude some high-resolution cloud-free imageries from newly launched satellites, such as Sentinel-2, which can aid in cap-turing the high-resolution inundation areas. Finally, expand-ing the dictionary to include data from the passive microwave channels of the new satellites, such as Global Precipitation Mission (GPM) Microwave Imager (GMI), will increase the spatial resolution of the retrievals to approximately 5 km. In this paper, the seasonality and also different land surface classes have not been directly taken into account in the re-trieval algorithm. Future research should include the stratifi-cation of the dictionary based on different land surface types and time periods (e.g., seasons).
Code availability. MATLAB code available at ftp://ebtehaj.safl.
[image:11.612.128.468.64.211.2]Appendix A: Copula
LetX1andX2denote two random variables with marginal cumulative distributionsF1(x1)≡P[X1≤x1]andF2(x2)≡ P[X2≤x2]with the cumulative joint distribution function F (x1, x2)≡P[X1≤x1, X2≤x2]. According to the Sklar’s theorem (Nelsen, 1999), the cumulative joint distribution F (x1, x2)ofX1andX2is equal to the cumulative joint dis-tribution functionC(u1, u2)of the quantilesu1=F1(x1)and u2=F2(x2)by
F (x1, x2)=P[X1≤x1, X2≤x2]
=PhX1≤F1−1(u1), X2≤F2−1(u2)
i
≡C[U1≤u1, U2≤u2]
=C (u1, u2, ) (A1)
where C (u1, u2), is the cumulative copula with uniform marginal random variablesF1(x1)andF2(x2)on the inter-val[0,1]. The multivariate density function f (x1, x2), if it exists, can be calculated by taking the derivative ofCandF, which results in the following:
f (x1, x2)=c(u1, u2)·f (x1)·f (x2)
Appendix B
Table B1.Acronyms and abbreviations.
SSMIS Special Sensor Microwave Imager and Sounder SSM/I Special Sensor Microwave Imager
DMSP Defense Meteorological Satellite Program MSS Multispectral scanner system
VNIR Visible to near infrared
MODIS Moderate Resolution Imaging Spectroradiometer NIR Near infrared
MIR Mid-infrared PMW Passive microwaves
ESMR Electrically scanning microwave radiometer SMMR Multi-frequency Microwave Radiometer BWI Basin wetness index
WSF Water surface fraction
AMSR-E Advanced Microwave Scanning Radiometer - Earth Observing System NRT Near-real time
NSIDC National Snow and Ice Data Center DFO Dartmouth Flood Observatory
MODIS-MWP MODIS near-real-time (NRT) water product CDF Cumulative probability function
M Number of vectors of microwave brightness temperaturesB k Number of nearest neighbors
B Brightness temperature dictionary
f Inundation fraction
F Inundation dictionary
bobs Observed vector of brightness temperature
K Number of nearest neighbors
Bs Sub-dictionary ofB Fs Sub-dictionary ofF
c Vector of representation coefficients
ˆ
f Estimated inundation fraction
W Weight matrix
n Number of frequency channels
p Detection probability∈(0,1) `1&`2 Regularizations norms
Competing interests. The authors declare that they have no conflict of interest.
Acknowledgements. This work was supported by the NASA Global
Precipitation Measurement Program under grants NNX13AG33G and NNX16AO56G. It was also partially supported by NSF under the Belmont Forum DELTAS project (EAR-1342944) and the LIFE project (EAR-1242458). The MODIS-MWP data over the Mekong Delta were kindly provided by Dan Slayback from the NASA Goddard Space Flight Center. The first author would like to thank Professor Robert Brakenridge for his advice on this research during the AGU Fall Meeting 2015.
Edited by: M. McCabe
Reviewed by: two anonymous referees
References
Alharthi, A. and Lange, J.: Soil water saturation: Dielec-tric determination, Water Resour. Res., 23, 591–595, https://doi.org/10.1029/WR023i004p00591, 1987.
Allison, L. J., Schmugge, T. J., and Byrne, G.: A hydrolog-ical analysis of East Australian floods using Nimbus-5 electrically scanning radiometer data, B. Am. Meteo-rol. Soc., 60, 1414–1427, https://doi.org/10.1175/1520-0477(1979)060<1414:AHAOEA>2.0.CO;2, 1979.
Armstrong, R. L. and Brodzik, M. J.: An earth-gridded SSM/I data set for cryospheric studies and global change monitor-ing, Adv. Space Res., 16, 155–163, https://doi.org/10.1016/0273-1177(95)00397-W, 1995.
Basist, A., Grody, N. C., Peterson, T. C., and Williams, C. N.: Using the Special Sensor Microwave/Imager to Moni-tor Land Surface Temperatures, Wetness, and Snow Cover, J. Appl. Meteorol., 37, 888–911, https://doi.org/10.1175/1520-0450(1998)037<0888:UTSSMI>2.0.CO;2, 1998.
Brakenridge, G. R. and Anderson, E.: MODIS-based flood detection mapping and measurement: The potential for operational hydro-logical applications, in: Transboundary Floods: Reducing Risks Through Flood Management, edited by: Marsalek, J., Stancalie, G., and Balint, G., Nato Science Series: IV: Earth and Environ-mental Sciences, 72, Springer, Dordrecht, 2006.
Brakenridge, G. R., Nghiem, S. V., Anderson, E., and Chien, S.: Space-based measurement of river runoff, Eos T. Am. Geophys. Un., 86, 185–188, 2005.
Brakenridge, G. R., Nghiem, S. V., Anderson, E., and Mic, R.: Orbital microwave measurement of river dis-charge and ice status, Water Resour. Res., 43, 1–16, https://doi.org/10.1029/2006WR005238, 2007.
Choudhury, B. J.: Passive microwave remote sensing contribution to hydrological variables, Land Surface–Atmosphere Interactions for Climate Modeling, Springer Netherlands, 63–84, 1991. Coleman, T. F., Branch, M. A., and Grace, A.: Optimization
Toolbox: For Use with MATLAB: User’s Guide, Version 2. MathWorks, available at: https://pdfs.semanticscholar.org/35e3/ d60a0bdbd53c008fad425e9f8668e1528542.pdf (last access: 5 June 2017), 1999.
Coles, S. G. and Powell, E. A.: Bayesian methods in extreme value modelling: a review and new developments, Int. Stat. Rev., 119– 136, https://doi.org/10.2307/1403426, 1996.
Crétaux, J.-F., Bergé-Nguyen, M., Leblanc, M., Abarca Del Rio, R., Delclaux, F., Mognard, N., Lion, C., Pandey, R. K., Tweed, S., Calmant, S., and Maisongrande, P.: Flood mapping inferred from remote sensing data, Int. Water Technol. J., 1, 48–62, 2011. De Groeve, T.: Flood monitoring and mapping using passive mi-crowave remote sensing in Namibia, Geomatics Nat. Hazards Risk, 1, 19–35, https://doi.org/10.1080/19475701003648085, 2010.
Delgado, J. M., Merz, B., and Apel, H.: A climate-flood link for the lower Mekong River, Hydrol. Earth Syst. Sci., 16, 1533–1541, https://doi.org/10.5194/hess-16-1533-2012, 2012.
Ebtehaj, A. M., Bras, R. L., and Foufoula-Georgiou, E.: On eval-uation of ShARP passive rainfall retrievals over snow-covered land surfaces and coastal zones, arXiv Prepr., 17, 1013–1029, https://doi.org/10.1175/JHM-D-15-0164.1, 2015a.
Ebtehaj, A. M., Bras, R. L., and Foufoula-Georgiou, E.: Shrunken Locally Linear Embedding for Passive Microwave Retrieval of Precipitation, IEEE T. Geosci. Remote Sens., 53, 3720–3736, https://doi.org/10.1109/TGRS.2014.2382436, 2015b.
Ericson, J. P., Vörösmarty, C. J., Dingman, S. L., Ward, L. G., and Meybeck, M.: Effective sea-level rise and deltas: Causes of change and human dimen-sion implications, Global Planet. Change, 50, 63–82, https://doi.org/10.1016/j.gloplacha.2005.07.004, 2006.
Ferraro, R., Grody, N., and Kogut, J.: Classification of Geo-physical Parameters Using Passive Microwave Satellite Mea-surements, IEEE T. Geosci. Remote Sens., 24, 1008–1013, https://doi.org/10.1109/TGRS.1986.289564, 1986.
Frazier, P. S. and Page, K. J.: Water Body Detection and Delineation with Landsat TM Data, Photogramm. Eng. Rem. S., 66, 1461– 1467, 2000.
Galantowicz, J. F.: High-resolution flood mapping from low-resolution passive microwave data, IEEE Int. Geosci. Remote Sens. Symp., 3, 1499–1502, https://doi.org/10.1109/IGARSS.2002.1026161, 2002.
Gao, B. C.: NDWI – A normalized difference water index for re-mote sensing of vegetation liquid water from space, Rere-mote Sens. Environ., 58, 257–266, https://doi.org/10.1016/S0034-4257(96)00067-3, 1996.
Giddings, L. and Choudhury, B. J.: Observation of hydro-logical features with Nimbus-7 37 GHz data, applied to South America, Int. J. Remote Sens., 10, 1673–1686, https://doi.org/10.1080/01431168908903998, 1989.
Grody, N. C.: Classification of snow cover and precipitation using the special sensor microwave imager, J. Geophys. Res., 96, 7423, https://doi.org/10.1029/91JD00045, 1991.
Guerschman, J. P., Warren, G., Byrne, G., Lymburner, L., Mueller, N., and Van Dijk, A.: MODIS-based standing water detection for flood and large reservoir mapping: algorithm development and applications for the Australian continent, CSIRO: Water for a Healthy Country National Research Flagship Report, Canberra, 2011.
Gupta, A.: The physical geography of Southeast Asia, Vol. 4, Ox-ford University Press on Demand, 2005.
Resour. Manage., 19, 333–347, https://doi.org/10.1007/s11269-005-3281-5, 2005.
Kuenzer, C., Klein, I., Ullmann, T., Georgiou, E., Baumhauer, R., and Dech, S.: Remote Sensing of River Delta Inundation: Ex-ploiting the Potential of Coarse Spatial Resolution, Temporally-Dense MODIS Time Series, Remote Sens., 7, 8516–8542, https://doi.org/10.3390/rs70708516, 2015.
Leinenkugel, P., Kuenzer, C., and Dech, S.: Comparison and enhancement of MODIS cloud mask products for Southeast Asia, Int. J. Remote Sens., 34, 2730–2748, https://doi.org/10.1080/01431161.2012.750037, 2013.
Mears, C. A., Schabel, M. C., Wentz, F. J., Santer, B. D., Govin-dasamy, B., and Ieee: Correcting the MSU middle tropospheric temperature for diurnal drifts, Igarss 2002 Ieee Int. Geosci. Re-mote Sens. Symp. 24th Can. Symp. ReRe-mote Sensing, Vols. I–Vi, Proc. Remote Sens. Integr. Our View Planet, 1839–1841, 2002. Melack, J. M., Hess, L. L., and Sippel, S.: Remote sensing of lakes
and floodplains in the Amazon Basin, Remote Sens. Rev., 10, 127–142, https://doi.org/10.1080/02757259409532240, 1994. McGinnis, D. F. and Rango, A.: Earth resources satellite
sys-tems for flood monitoring, Geophys. Res. Lett., 2, 132–135, https://doi.org/10.1029/GL002i004p00132, 1975.
NASA Goddard’s Hydrology Laboratory: NRT global flood map-ping, available at: https://floodmap.modaps.eosdis.nasa.gov/, last access: 5 June 2016.
Nelsen, R. B.: An Introduction to Copulas, Lecture notes in statis-tics, 39, Springer-Verlag, New York, New York, 1999.
Nicholls, R. J. and Cazenave, A.: Sea-level rise and its impact on coastal zones, Science, 328, 1517–1520, https://doi.org/10.1126/science.1185782, 2010.
Nigro, J., Slayback, D., Policelli, F., and Brakenridge, G. R.: NASA/DFO MODIS Near Real-Time (NRT) Global Flood Map-ping Product Evaluation of Flood and Permanent Water Detec-tion, available at: http://oas.gsfc.nasa.gov/floodmap/documents/ NASAGlobalNRTEvaluationSummary_v4.pdf (last access: 5 June 2017), 2014.
Norouzi, H., Rossow, W., Temimi, M., Prigent, C., Azarder-akhsh, M., Boukabara, S., and Khanbilvardi, R.: Using mi-crowave brightness temperature diurnal cycle to improve emis-sivity retrievals over land, Remote Sens. Environ., 123, 470–482, https://doi.org/10.1016/j.rse.2012.04.015, 2012.
Ordoyne, C. and Friedl, M. A.: Using MODIS data to characterize seasonal inundation patterns in the Florida Everglades, Remote Sens. Environ., 112, 4107–4119, https://doi.org/10.1016/j.rse.2007.08.027, 2008.
Papa, F., Prigent, C., Rossow, W. B., Legresy, B., and Remy, F.: Inundated wetland dynamics over boreal regions from re-mote sensing: the use of Topex-Poseidon dual-frequency radar altimeter observations, Int. J. Remote Sens., 27, 4847–4866, https://doi.org/10.1080/01431160600675887, 2006.
Prigent, C., Matthews, E., Aires, F., and Rossow, W. B.: Remote sensing of global wetland dynamics with multi-ple satellite data sets, Geophys. Res. Lett., 28, 4631–4634, https://doi.org/10.1029/2001GL013263, 2001.
Prigent, C., Papa, F., Aires, F., Rossow, W. B., and Matthews, E.: Global inundation dynamics inferred from multiple satellite ob-servations, 1993–2000, J. Geophys. Res.-Atmos., 112, 1993– 2000, https://doi.org/10.1029/2006JD007847, 2007.
Ramage, J. M. and Isacks, B. L.: Interannual variations of snowmelt and refreeze timing on southeast-Alaskan icefields, U.S.A, J. Glaciol., 49, 102–116, doi:10.3189-172756503781830908, 2003.
Rango, A. and Anderson, A. T.: flood hazard studies in the mississippi river basin using remote sensing, J. Am. Wa-ter Resour. As., 10, 1060–1081, https://doi.org/10.1111/j.1752-1688.1974.tb00625.x, 1974.
Rango, A. and Salmonson, V.: Regional flood map-ping from space, Water Resour. Res., 10, 1944–7973, https://doi.org/10.1029/WR010i003p00473., 1974.
Rouse, J. W., Haas, R. H., Schell, J. A., Deering, D. W., and Harlan, J. C.: Monitoring the vernal advancement of retrogradation of natural vegetation, NASA/GSFC, Type III, Final Report, 371 pp., Greenbelt, MD, 1974.
Schroeder, R., Rawlins, M. A., McDonald, K. C., Podest, E., Zim-mermann, R., and Kueppers, M.: Satellite microwave remote sensing of North Eurasian inundation dynamics: development of coarse-resolution products and comparison with high-resolution synthetic aperture radar data, Environ. Res. Lett., 5, 15003, https://doi.org/10.1088/1748-9326/5/1/015003, 2010.
Sippel, S. J., Hamilton, S. K., Melack, J. M., and Choudhury, B. J.: Determination of inundation area in the Amazon River floodplain using the SMMR 37 GHz polarization difference, Re-mote Sens. Environ., 48, 70–76, https://doi.org/10.1016/0034-4257(94)90115-5, 1994.
Sippel, S. J., Hamilton, S. K., Melack, J. M., and Novo, E. M. M.: Passive microwave observations of inunda-tion area and the area/stage relation in the Amazon River floodplain, Int. J. Remote Sens., 19, 3055–3074, https://doi.org/10.1080/014311698214181, 1998.
Smith, L. C.: Satellite remote sensing of river inunda-tion area, stage, and discharge: A review, Hydrol. Pro-cess., 11, 1427–1439, https://doi.org/10.1002/(sici)1099-1085(199708)11:10<1427::aid-hyp473>3.0.co;2-s, 1997. Smith, R. B.: Introduction to remote sensing of the environment,
available at: www.microimages.com (last access: 5 June 2017), 2001.
Syvitski, J. P., Vörösmarty, C. J., Kettner, A. J., and Green, P.: Impact of humans on the flux of terrestrial sedi-ment to the global coastal ocean, Science, 308, 376–380, https://doi.org/10.1126/science.1109454, 2005.
Temimi, M., Leconte, R., Brissette, F., and Chaouch, N.: Flood monitoring over the Mackenzie River Basin using pas-sive microwave data, Remote Sens. Environ., 98, 344–355, https://doi.org/10.1016/j.rse.2005.06.010, 2005.
Temimi, M., Lacava, T., Lakhankar, T., Tramutoli, V., Ghedira, H., Ata, R., and Khanbilvardi, R.: A multi-temporal analy-sis of AMSR-E data for flood and discharge monitoring dur-ing the 2008 flood in Iowa, Hydrol. Process., 25, 2623–2634, https://doi.org/10.1002/hyp.8020, 2011.
Tessler, Z. D., Vörösmarty, C. J., Grossberg, M., Gladkova, I., Aizenman, H., Syvitski, J. P. M., and Foufoula-Georgiou, E.: Profiling risk and sustainability in coastal deltas of the world, Science, 349, 638–643, https://doi.org/10.1126/science.aab3574, 2015.
Int. Congr. Model. Simul., 1–9, available at: http://www. microimages.com/documentation/Tutorials/introrse.pdf (last ac-cess: 5 June 2017), 2013.
Ulaby, F. T., Moore, R. K., and Fung, A. K.: Microwave Remote Sensing: Radar remote sensing and surface scattering and emis-sion theory, Vol. 2, Addison-Wesley Publishing Company, Ad-vanced Book Program/World Science Division, 1982.
Wilheit, T., Adler, R., Avery, S., Barrett, E., Bauer, P., Berg, W., Chang, A., Ferriday, J., Grody, N., Goodman, S., and Kidd, C.: Algorithms for the retrieval of rainfall from passive microwave measurements, Remote Sens. Rev., 11, 163–194, https://doi.org/10.1080/02757259409532264, 1994.
Xu, H.: Modification of normalised difference water in-dex (NDWI) to enhance open water features in remotely sensed imagery, Int. J. Remote Sens., 27, 3025–3033, https://doi.org/10.1080/01431160600589179, 2006.