2197
COMPUTATION OF ATTENUATION DUE TO RAIN FOR KU
BAND FREQUENCIES USING DSD FOR THE TROPICAL
REGION
GOVARDHANI.IMMADI1, M.VENKATA NARAYANA1,SARAT K KOTAMRAJU1, T.S.S.P.
SARVANI2,T. MANASA2,CH. VAMSI YASWANT2, J. AKSHAYA KALYAN2
Department of Electronics and Communication Engineering, K. L. University, Green Fields, Vaddeswaram, Guntur- 522502, Andhra Pradesh, India.
E-mail: [email protected]
ABSTRACT
These days we are observing a rise in spectral congestion mainly due to increased usage of wireless technologies. This lead to occupy higher band frequencies for efficient communication. As part of this, antennas operating at Giga Hertz frequencies are being designed and implemented for satellite communications. But, the microwave signals are experiencing loss of signal strength when interfered with various layers of the atmosphere, precipitation, clouds etc. Here the major impairment is due to rain and so a model which can estimate signal attenuation has to be developed. This can be quantified using conventional methods like physical modelling and empirical modelling using regression technique for years of data. This rises complexity in the calculation of attenuation caused by rain. Handling such large data is very difficult and it is also a time-consuming process. Rain drop distribution replaced this hard work with simplified analysis for any specific region. First, a suitable distribution model is selected for the region and attenuation is calculated using Mie scattering for all spherical rain drops, considering a major part of it is due to its size. This is followed by equation modelling using MATLAB. This experiment is conducted at K L University located 16.44o East and 80.60o North.
Keywords: Spectral Congestion, Mie Scattering, Drop Size, Drop Size Distribution, Precipitation,
Attenuation Due To Rain.
1. INTRODUCTION
Latest advancements in communication systems have placed pressure on engineers to develop microwave systems operating at higher frequency bands [7]. The steadfastness of these systems can be severely impaired due to attenuation created by rain at those frequencies. In space application radars, it causes an issue due to precipitation and cloud characterization. Although, system performance is affected by different forms of hydrometeors (snowfall, sleet etc.), attenuation due to rain is severe. Therefore, it’s compulsory to determine a model capable of predicting the behaviour of those systems within the presence of rain.
An EM wave broadcasting through a field comprising of raindrops suffers two attenuating effects: the first is absorption over which a percentage of energy is absorbed by the rain-drops and transformed into a higher temperature (heat), and the second is scattering where part of the energy is dispersed in all directions [9]. The solution for scattering issues is generally obtained
from simple geometry such as a sphere. However, this assumption isn’t clearly true particularly for raindrops with higher diameters.
ISSN: 1992-8645 www.jatit.org E-ISSN: 1817-3195
2198 Generally, modelling of rain attenuation is done in terms of DSD. In various climatic regions variation in nature of drop is the main problem; especially tropical regions have a huge diversity due to changes in the climate. In the deviation of signal strength due to rain, a DSD measurement
[image:2.612.117.499.165.365.2]can provide necessary information in the absence of measured attenuation of data[5]. To characterise the rain attenuation, some attempts have been made in this region.
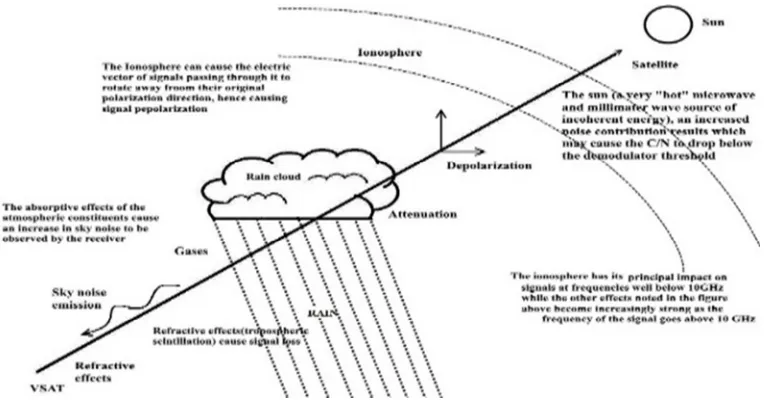
Figure 1:- Various Parameters Effecting The Microwave Signal In Atmosphere
In general, the rain microstructure is defined by the size distribution of the raindrop (DSD) that denotes the predictable number of raindrops per unit volume of air for every specific diameter. DSD is characterised by less number of parameters and has a specific analytical form. The most popular form of DSD is Marshall-palmer formulation although many studies assume general exponential and gamma distributions [6].
2. EXPERIMENTAL SETUP
The project is completely structured from the disdrometer data which records spectrum for every 10sec with 1024 samples of detected rain drops. This setup is placed on the 7th floor of C Block at K L University located 16.44o East and 80.60o North. It records Intensity of rain (mm/hr.), no. of detected particles and some other parameters.
The results from the derived equation are further compared with beacon recorded data. This is done using the experimental set up at K L University, Vaddeswaram (16.44oE, 80.62oN) from which we receive the beacon signal. Using parabolic dish antenna at Ku band frequency beacon data is received. This antenna’s size is 90cm, elevation angle is 65.25o operating at the 11.625GHz
frequency. The beacon signal is applied to Low
noise block convertor (LNBF it contains two oscillator frequencies 9.75 and 10.5 GHZ). Beacon signal amplitudes (dB) are recorded by using the data logging module.
3. DSD MEASUREMENTS
The rain drop size distribution (RDSD) is demarcated as the distribution of rain drops in a standard volume for a given diameter. The quantity and size of rain drop for a unit volume are defined by the concentration number, N (D) [number m−3 mm−1], also called the RDSD, where D the sphere-shaped correspondent diameter of each raindrop [mm].
3.1 Exponential Distribution
Exponential DSD is the most extensively used DSD model that accomplishes analytical parameterization for the rain drop size distribution.
N (D) =N
0e
(-ʌD) (1)Where N(D)(m-3 mm-1) is the concentration of rain-drops per diameter interval ΔD(mm), D(mm) the rain drop diameter,N0 the parameter of
2199 m-3,ʌ(mm-1) the gradient parameter whose power law relation is given by ʌ=4.1 R-0.21 mm
-1
,and R the intensity of rainfall in mm h-1.It is found that exponential distribution under foresees(over forecasts) the tail, of the upper distribution in very light (hefty) rainfall.
Marshall & Palmar suggested that N0=8000 m-3
and λ=4.1R0.21 mm-1, where R the rate of rainfall in mm h-1[2]. This model is not favoured when the sampling time is 1min or less. Due to the withdrawal of the RDSD’s from exponentially, many authors have preferred three parameter models to define rain characteristics [4].
3.2 Gamma Distribution
Gamma distribution, an exponential distribution of two-parameter which shows precise outcomes when compared to practical RDSD for all ranges of rainfall rate. When compared to exponential and lognormal distribution, rainfall rate attained from gamma DSD is determined to have the minutest root mean square error and biasing. To date, the most extensively used parametric forms for exhibiting RDSD is the three-parameter gamma.
Gamma model uses the second, fourth, and sixth instants to model the RDSD is form fitted method used in Singapore. The Disdrometer (Joss) computes a number of rain drops between the drop diameters ranging 0.3mm to 5 mm, the shortened moment appropriate between these drop-diameter ranges are also used for exhibiting the DSD [3]. Gamma DSD entails three-parameter estimation: No, the intercept three-parameter; μ, the structure parameter; and Λ, the slope parameter.
N (D) =N
0 (2)Where
N0= . . . .
0.01709 log & ' 0.1108 log & ' 0.2705 λ=4.1& .
and D is the rain drop-diameter in mm, R is the rain-rate in mm/h.
3.3 Log Normal Distribution
Based on the data collected on rainfall using the three-parameter lognormal distribution for tropical countries that has been projected by some researchers. The lognormal distribution can better estimate DSDs where there are rarer statistics of small drops sizes [2], i.e. for convective rain. The
lognormal distribution can represent instances of DSDs with few small drops.
N (D) =
+,√ ./
01 345
6 (3)
Where N0=108& . 7 ,
R is the rain-rate in mm/h,
D is the diameter of rain-drop in mm, 0.01709 log & ' 0.1108 log &
' 0.2705 σ is the standard deviation
It is determined that the representation of lognormal is appropriate for a wide-range of applications and can facilitate clarification of the bodily processes which control the structure of the distribution. Its parameters have a simple geometrical interpretation.
4. DROP SIZE DISTRIBUTION
From the clear analysis, it was observed that precipitation is offering a high percentage of attenuation for Ku band and higher frequencies. In order to estimate the original strength of the received signal, a standard attenuation model for every specific locality has to be designed.DSD is a key issue for determining rain attenuation from rain rate which considerably varies with drop size. Sided on the various numerical prediction models for weather and analysis from disdrometer[13].
A paper on modelling the average rain drop size distribution in South Nigeria is given by Ajayi. He employed the method of moments regression technique which was derived from the lognormal model that can help is deriving an analytical function followed by fitting resolves a wide range of rain rates of the recorded data. Lognormal 2,3 moments and 5,6 moments are analysed using suitable mean and variances expressions. The data for all this analysis has been collected from the disdrometer with a sampling area of 50 cm2, 20 classes of rain size and velocity. Every event is recorded as an electrical pulse which is further digitalized. The results obtained are compared with the gamma model and finally concluded that lognormal is appropriate model for analysing the rain pattern in the tropical region[12].
ISSN: 1992-8645 www.jatit.org E-ISSN: 1817-3195
[image:4.612.322.534.151.314.2]2200 MATLAB and classified according to the size and velocity classes as defined by ITU-R. This integrated with standard distribution formula gives the drop size distribution N(D). Thus, the DSD characteristics are perceived from the obtained results.
Figure 2:-Exponential Distribution At Different Rain Occasions
The graph describes the exponential downfall of drop distribution for an increase in the rain drop size.
In this plot, an exponential rise in magnitude is perceived for an increase in the intensity of rain. This abrupt change for a minute rise or fall makes it unsuitable for attenuation analysis.
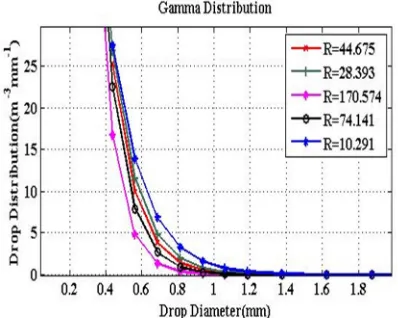
Figure 3:-Gamma Distribution At Different Rain Instances
The above graph of gamma distribution pictures the exponential variation of distribution for every drop diameter. Here the plot is varying for every rain rate. From the lowest rain rate 10mm/hr to
[image:4.612.91.290.175.333.2]higher one i.e. 170mm/hr. it is observed that decrease in distribution is increasing. This is because drops with large diameters are detected for an increase in rain intensity.
Figure 4:- Lognormal Distribution Of Rain For Different Rain Rates
5. ESTIMATION OF SCATTERING OF
RAIN DROP
Ezeh explored that rain attenuation is the main challenge to the frequencies in the microwave region especially above 10GHz which cause severe unavailability of the signal many times. Estimation of rain attenuation has become a vibrant consideration while setting a satellite communication link. For this reason the degradation by the scattered part of signal is medelled using curve fitting tool and some other analytical tools[14]. This can be implemented using the concept of Mie theory.
[image:4.612.90.289.478.637.2]2201 Here the Bessel functions play a crucial role in reducing the modified equation.
To account for the over-all attenuation at a higher frequency in a mechanism, the primary step is to calculate the specific rain attenuation which depends on rain-rate and the raindrop size.
As(dB/km) =4.343 × 10⁻³ 8 9:(D)N dD (4)
Where, N(D) is defined using scientific expressions that are functions of diameter, and the following subcategories describe the four DSD models used for this work. RDSD is one of the most extensively used parameters for understanding and ample description of phenomena of rain.
[image:5.612.323.527.422.565.2]This as multiplied by the effective path length (Le) gives total attenuation. This is then plotted with respect to corresponding diameters. Further a general expression is generated between drop diameter and attenuation for an average rain rate using curve fitting tool. This gives two coefficients a and b which are used to develop a power series equation from which estimation of attenuation becomes simpler [11].
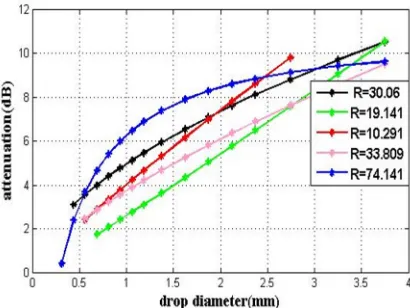
Figure 5: - Change In Attenuation Behavior For Multiple Rain Rates; R = 30.06, R=19.141, R=10.291,
R=33.809, R=74.141
Raindrops differ from each other in both shape and size. A rain drop with insignificant relative motion with respect to surroundings experiences zero net pressure. When a drop falls, the surface tension over the drop creates unequal pressure on the surface. Due to this pressure difference, the bottom of the drop gets flattened and top region
becomes narrower. This deformation depends on the size of the drop. In this analysis, it is observed that the drop diameter with size less than 2mm has less influence when compared to a diameter greater than 2mm. Experimental results in the investigation of falling rain drops showed that drops having a diameter more than 2mm are changed to oblate spheroidal shape due to the change in pressure on the outer surface of the drop [10].
[image:5.612.93.298.444.598.2]In the above figure, if we observe the plot of highest rain rate, it increased logarithmically later for higher diameters the growth in attenuation remained to be constant whereas for lower rain rates linear changes are detected. Thus, as the rain rate is increasing the graph shape changed from linear to logarithmic. So, for higher rain rates the rain drop takes non-spherical shape. As the applied Mie scattering is bounded to the condition assuming that the drop size to be spherical, the above graph is showing a difference in attenuation for increasing rain rates. Though the results in fig5 are plotted considering drop size alone the deviations are noticed which is mainly due to the shape of rain drop.
Figure 6:- Attenuation Resulting Using Generated Model Equation For Two Different Rain Rates
This fig 6 projects the results obtained from the power series equation of the form Y=aXb. Using the curve fitting tool an equation shown below has been derived.
A(dB)=4.01D
0.8827 (5)ISSN: 1992-8645 www.jatit.org E-ISSN: 1817-3195
2202 side is altered only with the change in drop size and not any other parameter and also having
[image:6.612.196.417.151.724.2]common drop sizes resulted in fig 6.
Table 1:- Computed Values Of Attenuation From Beacon And Rain Data For A Certain Period Of Time During 18th
May 2016
Sample
number
Beacon
attenuation(dB)
Rain drop
attenuation(dB)
1
1.6
4.75
2
1.34
4.24
3
1.63
4.49
4
1.6
4.16
5
1.63
4.57
6
1.49
4.24
7
1.03
3.99
8
1.09
4.57
9
0.83
4.49
10
0.98
4.67
11
0.63
4.16
12
0.5
3.94
13
0.6
4.77
14
0.5
3.77
15
0.61
4.74
16
0.72
4.86
17
0.56
3.97
18
0.74
4.59
19
0.7
3.85
2203
21
0.85
3.85
22
1.05
4.79
23
0.78
4.09
24
0.72
3.85
25
0.92
4.57
26
0.63
3.96
27
1.52
4.55
28
0.69
3.8
29
1.07
5.1
[image:7.612.88.524.67.528.2]30
0.78
4.83
Figure 7: -Comparison Of Estimated Attenuation From Rain Drop With The Beacon Attenuation During 19th May 2016
The above figure shows the plot of attenuation with respect to time for the beacon received signal and attenuation due to rain drop. This is given from the analysis done for a particular time period of time, of 19th may 2016. The average value of beacon attenuated signal is 0.96dB whereas attenuation from rain is 4.3dB. The deviation is approximately 3.3dB which also includes cable losses that can range around 1.5dB. Two more parameters that aren’t considered here are drop shape and drop concentration. When the signal is received from the satellite, it gets interfered with rain where we consider that signal starts interfering with rain from a specific height called
ISSN: 1992-8645 www.jatit.org E-ISSN: 1817-3195
[image:8.612.100.476.67.259.2]2204
Figure 8:-Comparison Of Beacon Attenuation With The Estimated Attenuation From Rain Drop On 18th May 2016
Another major factor is scintillations. It can either increase the signal strength or reduce it. Hence, we sometimes receive signal with more than the transmitted strength and sometimes we completely lose the signal. This can be observed in the following plot where scintillations resulted in receiving more than expected strength and so the attenuation is read negative.
6. CONCLUSION:
Thus, from the detailed analysis, it is understood that attenuation caused by rain plays a crucial role in receiving any signal transmitted at Ku band and higher frequencies. While considering the losses due to rain, not only the size of rain drop which holds value but also its shape which has importance at times of cyclone where we experience higher rain rates. So, if we try to analyse this issue including drop shape we can obtain the most appropriate attenuation model.
ACKNOWLEDGEMENTS
The authors especially thank the support given from SERB, Department of Science and Technology (DST), Government of India through
the funded project with F. No:
EMR/2015/000100. The authors also thank the management of KL University for supporting and encouraging this work by providing the facilities
in Centre for Applied Research in
Electromagnetics (CARE) of ECE.
REFERENCES:
[1] Mukesh Chandra Kestwal,1 Sumit Joshi,2 and Lalit Singh Garia1” Prediction of Rain Attenuation and Impact of Rain in Wave Propagation at Microwave Frequency for Tropical Region” International Journal of Microwave Science and Technology, Volume 2014, Article ID 958498.
[2] Siswadi and C. P. Quesenberry “SELECTING AMONG WEIBULL, LOGNORMAL AND
GAMMA DISTRIBUTIONS USING
COMPLETE AND CENSORED
SAMPLES” North Carolina State University, Raleigh, North Carolina.
[3] CE ´ CILE MALLET AND LAURENT BARTHES” Estimation of Gamma Raindrop Size Distribution Parameters: Statistical Fluctuations and Estimation Errors”
Universite´ de Versailles Saint-Quentin en Yvelines, Laboratoire Atmosphe` re, Milieux, Observations Spatiales (LATMOS–CNRS), Ve´lizy, France
[4] R. Uijlenhoet*,1, J.N.M. Stricker” A consistent rainfall arameterization based on the exponential raindrop size distribution”
Journal of Hydrology 218 (1999) 101–127
[5] S.DAS AND A.MITRA AND
A.K.SHUKLA,”Rain attenuation modelling in the 10-100 GHz frequency using drop size distributions for different climatic zones in tropical India”, progress in electromagnetics research B, Vol. 25, 211-224, 2010.
[6] CECILE MALLET AND LAURENT BARTHES, “Estimation of gamma drop size distribution parameters: statistical Fluctuations and Estimation errors”, Journal
of atmospheric and oceanic technology,
2205 [7] M.O.Odedina and T.J.Afullo,”Determination
of rain attenuation from electromagnetic scattering by spherical raindrops, radio
science, VOL. 45, RS1003, 27 January 2010.
[8] Y.YAK AND Z.X. WANG,”A new formula of specific rain attenuation for use in prediction methods”, International Journal of infrared and millimetre waves, vol. 24,
March 19, 2003.
[9] P.Owolawi,”Raindrop size distribution model for the prediction of rain attenuation in Durban”, Piers online, vol. 7, No.6, 2011. [10] H R Pruppacher and K V Beard.” A wind
tunnel investigation of the internal circulation and shape of water drops falling at terminal
velocity in air”. Quart. J. R. Met. Soc., 96:247–256, 1970.