ISSN: 1992-8645 www.jatit.org E-ISSN: 1817-3195
283
A NOVEL SOFTWARE QUALITY PREDICTION SYSTEM
BASED ON INCORPORATING ISO 9126 WITH MACHINE
LEARNING
1OSAMA ALSHAREET*, 2AWNI ITRADAT, 3IYAD ABU DOUSH, 4AHMAD QUTTOUM
1
ICET, Hashemite University, Jordan, corresponding author. 2
Associate Professor, Department of Computer Engineering, Hashemite University, Jordan. 3
Associate Professor, Department of Computer Sciences, Yarmouk University, Jordan.
4
Assistant Professor, Department of Computer Engineering, Hashemite University, Jordan.
Email: 1,* [email protected], 2 [email protected], 3 [email protected], 4 [email protected]
ABSTRACT
To begin with, this research defines Software Quality Prediction System (SQPS) as a system composed of a Classification Algorithm (CA) and a Software Quality Measurement Model (SQMM). Machine Learning applications in software quality measurement are expanding as research intensifies in two directions, the first direction focuses on improving the performance of CAs while the other direction concentrates on improving SQMMs. Despite of the increasing attention in this area, some well-designed SQPSs showed considerable false predictions, which could be explained by faults in the design of the CA, the SQMM, or the SQPS as a whole. In this context, there is a debate on which CA is better for measuring software quality, as well as there is a debate on which SQMM to follow. To start with, the research studied an original dataset of 7311 software projects. Then, the research derived quality measurements from the ISO 9126 Quality Model and developed the SQMM accordingly. Next, the research compared statistical measures of performance of four CAs, using WEKA and SPSS. Our experimental results showed that ISO 9126 is general, but flexible enough to act as a SQMM. Despite of their convergent performance, our experiments showed that Multilayer Perceptron Network (MLPN) have more balanced predictions than Naïve Bayes does. Following a rarely researched approach, the SQPS predicted five levels of software quality instead of making a binary prediction, limited with defect or non-defect software.
Keywords: Software Quality Prediction System (SQPS), ISO 9126 Software Quality Model, Multilayer Perceptron Network (MLPN), Classification Algorithm (CA), Software Quality Measurement Model (SQMM), Machine Learning.
1. INTRODUCTION
The demand on computer software applications is expanding in wide variety of application areas. Moreover, software quality is critical for software industry [1]. Indeed, developing and engineering high quality software application, which meets user requirements, is therefore of high importance. Interpreting user definition to software quality is a decisive factor in ensuring competitive software products [2]. In fact, software engineers achieve this goal by forming consistent quality measurements, based on the requirements and objectives of the software product [3]. Hence, it is
critical to use adequate quality metrics to measure software quality characteristics accurately [4].
ISSN: 1992-8645 www.jatit.org E-ISSN: 1817-3195
284 In this context, the researchers compared four different classification algorithms, which are: Multilayer Perceptron (MLPN), K-nearest neighbors, Naïve Bayes, and J48 tree. On the other hand, they selected ISO 9126 as a base for developing the software quality model. One of this research main assumptions is that ISO 9126 extensively defines the factors behind software development process and provides a rich framework for modeling software development process. The next section provides further details on the bases for this assumption.
1.1 ISO 9126 as a SQMM
SQMMs are frameworks utilized for analyzing and describing the quality factors of various types of software products (e.g., commercial off-the-shelf software, a web service, Windows application) [5]. Moreover, SQMMs provide the ability to evaluate software quality factors accurately [6]. Software engineers utilize SQMMs and their measurements
in various domains; for instance, during the software development phase or during test phase.
There are many frameworks for defining and representing software quality factors [7, 8]. In this research context, the researchers utilized ISO 9126 quality model [9] as a base for defining the attributes of the software quality model.
The ISO 9126 is considered as one of the most reliable quality models [9], because it is built on solid understanding of software developments aspects. However, there is ambiguity surrounding the process of developing software quality models based on ISO 9126 model [10]. Indeed, some of ISO 9126 concepts are not consistently defined [11]. The next section discusses the hierarchy of ISO 9126 characteristics.
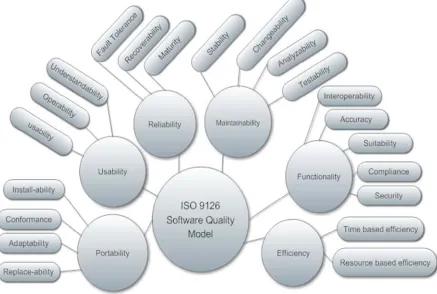
1.2 The Hierarchy of ISO 9126 Characteristics
[image:2.612.95.532.355.649.2]Figure 1. Shows the hierarchy of ISO 9126 characteristics [12], which are explained as follows:
Figure .1. The Hierarchy Of ISO 9126 Characteristics.
1) Functionality
Functionality is the compliance between software functions and the stated requirements by users. Functionality consists of five sub-elements:
ISSN: 1992-8645 www.jatit.org E-ISSN: 1817-3195
285 associated with predetermined frameworks. Compliance implies that the application is agreeable with norms, traditions or regulations in laws. Security is the capacity to anticipate unapproved access, whether it is not intentional or intentional.
2) Reliability
Reliability refers to the ability of the software product to sustain its functionality under certain conditions.
Reliability consists of three sub-elements: Maturity is the frequency of software faults. Fault tolerance is the ability of a software to deal with software faults in interface. Recoverability is the capability to recover data affected in case of a failure. Recoverability is measured by the time and effort required to achieve it. Maturity is the recurrence of programming deficiencies. Fault tolerance is the capacity of software to manage programming issues or consistency between business code and interface.
3) Usability
Usability refers to software product ability to be understood and used effectively by the users.
Usability consists of three sub-elements: Understandability portrays the required effort for perceiving the logical flow of an application and the appropriateness of that application. Learn ability is the required effort for perceiving the application illustration. Operability represents the client efforts to manage operations.
4) Efficiency
Efficiency refers to the compliance between software product performance and the amount of used resources. Efficiency consists of two sub-elements: the time based efficiency depicts throughput rates and processing time. On the other hand, resource based efficiency means the measure of utilized resources and utilization period.
5) Maintainability
Maintainability refers to the ability of the software product to accept modifications. Indeed, software products must be able to adopt with variable requirements. Maintainability consists of four sub-elements: Analyzability, the required effort for the analysis of inadequacies and for the recognizable proof of inadequate components. Changeability is the ability of the software system to accept important modifications. Stability is the resistance of the application towards unforeseen
developments. Testability is the required effort for accepting change.
6) Portability
Portability refers to the ability of the software product to operate in different environments, whether it is hardware or software environment. Portability consists of four sub-elements: Adaptability is adjusting the application to adopt with diverse situations. Install ability is the required effort for setting up the product on operation environment. Conformance implies the conformance of an application to unpredictable situations. Replace ability is the ability to substitute an application with another one.
2.RELATEDWORK
Reviewing literature, the majority of research in SQPSs focus on determining whether the software is defected or non-defected (13-16). In supervised learning context, SQPSs work by learning from thousands of training examples, which are used to construct a prediction model. Then, this model is used to predict the outcome of unseen data.
Researchers widely use categorical prediction in predicting software quality as this method include many classifiers, including MLP, J48, Bayesian Networks, and other CAs. Moreover, some researchers believe that CAs are context–specific while others believe that there are considerable adaptive classifiers [17].
Chidamber and Kemerer (CK) [18] demonstrated the impact of OO design and metrics over software quality while other studies showed in consistent results [19,20].
Khoshgoftaar and Gao [21] developed quality estimation models with complexity metrics using zero-inflated Poisson and Poisson regression.
McCabe's [22] developed cyclomatic complexity measurement to measure software quality using the value of independent paths in software source code. Fenton and Neil [23] studied various SQMMs and concluded with criticizing these models because of the lack of precision and problems in their applications. Arguably, Fenton and Neil [23] claimed that the Bayesian method is very effective in solving the studied problem. Similarly, Menzies et al. [24] stated that Naïve Bayes provides better False Positive Rate (FPR) and True Positive Rate (TPR). Accordingly, this research includes evaluation of Naïve Bayes algorithm against other classification algorithms.
ISSN: 1992-8645 www.jatit.org E-ISSN: 1817-3195
286 study, especially in justifying the selected variables for the classification.
Gayathri M, Sudha [26] used MLP to predict defects within NASA Metrics Data Program Dataset. Moreover, they compared MLP method with CART algorithm and logistic regression, concluding with MLP superiority over the tested classification methods.
Likewise, Katiyar and Singh [27] analyzed a dataset from Ada Military data using MLP model. Comparing to other classifications methods, MLP results showed smaller error values.
Singh and Salaria [28] Incorporated MLP and Levenberg-Marquardt (LM) algorithm to develop a tool for detecting defects in software. The tool used PROMISE repository dataset as a base for algorithm training. Comparing to other function-based neural network classifications algorithms, results showed that MLP have higher accuracy rate.
First, one of this research objectives is to expand the current research efforts through highlighting the significance of adopting a SQMM based on ISO 9126 quality model. Secondly, the research aims to compare the performance of diverse CAs in terms of software prediction, particularly MLP and Naïve Bayes. Final, the researchers train the CAs using an entirely new dataset with thousands of instances. Reviewing literature, the research objectives were barely scratched by some of the researchers [13-29] with diverse conclusions. Additionally, the software quality models [13-29] focus on predicting defects or non-defects in software while this research contributes to this area through developing a SQPS that predicts the level of software quality. The following sections explain research methodology.
3.METHODOLOGY
The research methodology is divided into three subsections. The first subsection introduces the process of deriving measurements from the ISO 9126 Quality Model. After that, the second sub-section defines the process of forming the research dataset. Finally, yet most importantly, the research describes MLPN as it is mainly utilized to develop the CA.
3.1 Deriving Measurements from the ISO 9126 Quality Model
Zeiss et al.(30) Applied ISO 9126 to generate measurements for the Testing and Test Control Notation (TTCN-3). Moreover, Zeiss et al. [30] believed that ISO 9126 can be utilized successfully to measure software quality. This research converted ISO 9126 general specifications into
measurements based on Zeiss et al. [30] research. To illustrate, the following represent examples of converting ISO 9126 general specifications into measurable variables:
Concerning Suitability sub-characteristic of Functionality, the number of test objectives achieved by the software test is compared against the number of test objectives required in the software project. Formula (1) shows how to calculate this measurement.
!" ## $
………..(1)
With regard to accuracy sub-characteristic of Functionality, this sub-characteristic is measured by comparing the number of paths tested correctly in a test case to all number of paths in a test case. Formula (2) shows how to calculate accuracy.
%&& ' &
( ) # !*
## ( (2)
On the subject of changeability sub-characteristic of Maintainability, for a given SQPS case, this sub-characteristic is measured by comparing the number of duplicated lines in source code to the number of all lines of code. Formula (3) demonstrates how to calculate this measurement.
&+ ,-.
1 0 (# #
## # …..(3)
Touching Maturity sub-characteristic of Reliability, for a given SQPS case, this sub-characteristic is measured by comparing the number of errors and warnings in source code to the total number of statements in source code. Formula (4) demonstrates how to calculate this measurement.
1 ' 1 0 2 )
# …………(4)
3.2 Research DATASET
ISSN: 1992-8645 www.jatit.org E-ISSN: 1817-3195
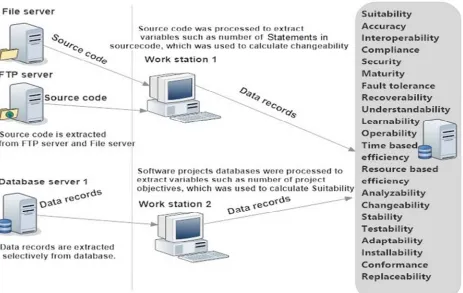
287 it. With thousands of comprehensively documented software projects, ICET is a rich source for studying software applications academically. Figure 2 explains the process of extracting the research dataset. Using developed software tools, researchers extracted the information of 7311 software projects from ICET projects database as these software projects were developed in either ASP.NET or Oracle. After preliminary
[image:5.612.95.558.206.499.2]examination for the dataset, 885 of software projects were excluded because of missing data. Consequently, the dataset were filtered to hold only 6426 software projects. Table 1 shows the dataset processing summary with the resulted twenty one fields. Since the dataset fields were basically ratios, the data type of the data fields is real number.
[image:5.612.120.492.542.619.2]Figure 2. The Process Of Extracting Research Dataset.
Table 1. Dataset Processing Summary.
Frequency Percent Valid Percent Cumulative Percent
Valid 1 378 5.9 5.9 5.9
2 2142 33.3 33.3 39.2
3 2961 46.1 46.1 85.3
4 756 11.8 11.8 97.1
5 189 2.9 2.9 100.0
Total 6426 100.0 100.0
With respect to statistical tools, the researcher utilized WEKA machine learning software available at
(http://www.cs.waikato.ac.nz/ml/weka/) and IBM SPSS software available at
(www.ibm.com/software/analytics/spss/) to implement t-test and statistical experiments. It is essential to note that the prediction procedures
examined in this paper are restricted only by WEKA and IBM SPSS mechanisms.
3.3 Multilayer Perceptron Neural Networks (MLPNs)
ISSN: 1992-8645 www.jatit.org E-ISSN: 1817-3195
288 coordinated graph, with every layer completely joined with the following one. With the exception of the input nodes, every node is called a neuron with a nonlinear initiation mechanism [33]. MLPN uses an administered learning method called back propagation for programming the neural network [34].
Developers train MLPNs to figure out how to transform data input to a required output, and fit the model to a specified prediction context [35,32].
MLPN also acts as managed learning simulated neural network that is utilized broadly for analyzing and solving various logical problems, including classification, systems simulation, and pattern recognition [36]. Back-propagation forms error functions through comparing the values of the actual output with the values of the desired output. The MLPN algorithm modifies the weights of every connection to diminish the value of errors in the network output. If these actions lead to error reduction, then the MLPN has learned a specified target function.
4.RESULTSANDDISCUSSION
This section discusses the research main results,
which were processed using SPSS and WEKA tool. The researchers conducted three experiments,
which are as follow:
4.1 Experiment 1, testing the performance of different classification algoritms
The first experiment aims to test different CAs in terms of correctly classified instances, incorrectly classified instances, mean absolute error, root mean squared error, relative absolute error, and root relative squared error. Error values are used to measure how close model predictions are to real output.
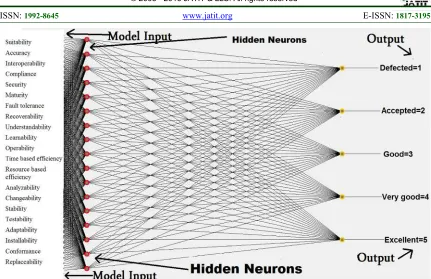
Looking at figure 3, MLPN model took about 1.69 seconds to build. With 21 inputs and 5 outputs, the MLPN covered 90.1961 % of the
dataset cases. Moreover, Table 2 Shows that the number of correctly classified instances in MLPN is relatively higher than other CAs. MLPN predicted 5040 (78.4314 %) correctly classified instances. Additionally, error values for MLPN are relatively lower than other algorithms. Naïve Bayes classification follows MLPN in terms of correctly classified instances with 4914 (76.4706 %) instances. Thus, Naïve Bayes error values are higher than MLPN error values, except for Root relative squared error. The J 48 model took about 0.02 seconds to build as it covered 94.1176 % of the dataset cases. However, J48 performance is the worse with only 4284 correctly classified instances. Looking at table 3, confusion matrix reveals further details about the classification mechanisms. Concerning option “a”, defected, K-nearest neighbor predicted this outcome correctly with 378 out of 378 instances. Concerning option “b”, accepted, Naïve Bayes classifier predicted this output with 1827 out of 2142 instances, which was the best among the other classifiers. Looking at output “c”, Good, Naïve Bayes prediction was the best among other classifier with 2457 out of 2961. Concerning output “d”, very good, MLPN predicted 504 out of 756 instances, which was the best among the other classifiers. in accordance with the previous results and in the light of research objectives, the researcher selected MLPN for developing the SQPS.
Pproviding 5040 (78.4314 %) correctly classified test cases is a good indication for the feasibility of developing a SQPS using both MLPN and ISO 9126 model.
In summary, MLPN preceded other models in terms of correctly classified instances with considerably lower error values. However, since the performance of MLP and Naïve Bayes is convergent, the researchers decided to focus on both CAs with further two experiments.
ISSN: 1992-8645 www.jatit.org E-ISSN: 1817-3195
[image:7.612.91.522.66.345.2]289
[image:7.612.69.547.399.692.2]Figure. 3. Using WEKA Tool, A Visualization Of The Generated Multilayer Perceptron Neural Network (MLPN) Model.
Table 2. Comparing Different Machine Learning Algorithms.
Comparison feature Multilayer
Perceptron(MLPN)
K-nearest neighbours Naïve Bayes J48 tree
Correctly Classified Instances 5040 (78.4314 %) 4599 (71.5686 %) 4914 (76.4706 %) 4284 (66.6667 %)
Incorrectly Classified Instances 1386 (21.5686 %) 1827 (28.4314 %) 1512 (23.5294 %) 2142 (33.3333 %)
Mean absolute error 0.0904 0.1304 0.132 0.1507
Root mean squared error 0.264 0.2998 0.2542 0.3131
Relative absolute error 33.9128 % 48.9078 % 49.4774 % 56.4896 %
Root relative squared error 72.5942 % 82.4504 % 69.8988 % 86.0958 %
Table 3. Confusion Matrices For The Experimented Cas.
a) Confusion Matrix for Multilayer Perceptron b) Confusion Matrix for Naïve Bayes
a b c d e <-- classified as 252 126 0 0 0 | a = Defected 63 1764 315 0 0 | b = Accepted 0 441 2331 189 0 | c = Good 0 0 252 504 0 | d = Very good 0 0 0 0 189 | e = Excellent
a b c d e <-- classified as 63 315 0 0 0 | a = Defected 0 1827 315 0 0 | b = Accepted 0 441 2457 63 0 | c = Good 0 0 6 189 0 | d = Very good 0 0 0 0 189 | e = Excellent
c) Confusion Matrix for J48 tree d)Confusion Matrix for K-nearest neighbours
a b c d e <-- classified as 315 63 0 0 0 | a = Defected 63 1323 756 0 0 | b = Accepted 0 504 2142 315 0 | c = Good 0 0 441 315 0 | d = Very good 0 0 0 0 189 | e = Excellent
a b c d e <-- classified as 378 0 0 0 0 | a = Defected 126 1575 441 0 0 | b = Accepted 0 756 2142 63 0 | c = Good 0 0 441 315 0 | d = Very good 0 0 0 0 189| e = Excellent
ISSN: 1992-8645 www.jatit.org E-ISSN: 1817-3195
290
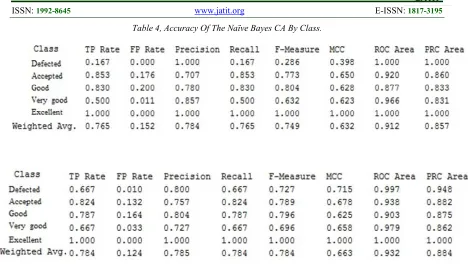
4.2 Experiment 2, Testing Naïve Bayes And MLP In Terms Of Statistical Measures Of The Performance.
Formula (5) presents True Positive Rate (TPR) or sensitivity. Looking at tables 4 and 5, as TPR demonstrates the proportion of correctly predicted positives, the overall TPR value in MLP classes are higher than the overall TPR value in Naïve Bayes classes. However, there are clear imbalance problem in Naïve Bayes. Although there are slight advantage for Naïve Bayes in both accepted and good classes, Naïve Bayes classification to defected class is way behind MLP (0.67) with 0.167 as TPR, which was also proved in table 2.
3 4
5 * 65*7
5 * 65*789 # : ) 69:7………..….(5)
Formula (6) shows False Positive Rate (FPR). Looking at tables 4 and 5, as FPR demonstrates the proportion of falsely predicted positives, obviously, the overall FPR in MLP classes are basically lower than the overall FPR in Naïve Bayes classes, which proves that MLP is more efficient than Naïve Bayes in worse in predicting positive cases correctly.
; 4 9 # * 69*7
9*85 : ) 65:7
………..(6)
Defined as the proportion of relevant instances, Formula (7) demonstrates precision. When compared with Naïve Bayes, the weighted average of Precision value in MLP is slightly higher and more balanced, which means that MLP ability to predict negative cases is better.
Precision= 5*
5*89*……….………
…..(7)
Representing harmonic mean of precision and recall, F-measure is calculated using Formula (8). Relatively higher in MLP, F-measure shows better predication and balance with MLP algorithm.
; 0 <. = '. 2 ?
* ?5*@
* 85*@……….(8)
Looking at tables 4 and 5, the precision-recall curve (PRC) or precision to sensitivity provides indications for the accuracy of the CA. Reflecting better accuracy, PRC values are higher in MLP case, table 5. Similarly, Receiver Operating Characteristic (ROC) values are relatively higher in MLP, which means that the total ability of MLP classes to distinguish between a correct level of
quality and a false level of quality is higher than their counterparts in Naïve Bayes.
Looking holistically at statistical measures of the performance in both MLP and Naïve Bayes, MLP performance is better in most measure, as well as MLP measures shows considerably better balance when compared to Naïve Bayes. Accordingly, the researchers decided to select MLP as an appropriate CA for the SQPS.
4.3 Experiment 3, testing the developed SQPS against real test cases
After developing the SQPS, the researchers used the SQPS to predict quality for already verified and tested 619 real software products from ICET.
Looking at table 6, obviously, testing real 619 instances provides results that align with 10-fold cross validation paired t-test of the training cases. To illustrate, 78.4314% of the cases were classified correctly in the training test while 66.559% of the cases where classified correctly in the second test with 619 instance. Similarly, errors values in both tests a and b are consistent with higher error values in test b. Referring to results from other researches [4, 13, 16, 17, 19, 23-26, 28] where the classification algorithms predict a limited binary prediction. Though these results may have higher success rate, their SQPSs cannot be directly compared to SQPSs where the prediction has five different possible outcomes with 20% as success rate instead of 50% as a success rate in the binary prediction. Considering less varied instances in test b, the results show that the MLPN model fits to a considerable amount of test data, which is derived from real software development environment.
ISSN: 1992-8645 www.jatit.org E-ISSN: 1817-3195
[image:9.612.79.547.71.335.2]291
Table 4, Accuracy Of The Naïve Bayes CA By Class.
Table 5. Accuracy Of The MLP CA By Class.
Table 6. Comparing The MLPN Training Data Against Real Test Cases.
Comparison feature
a)Testing the MLPN with 10-fold cross validation paired t-test of the training cases (102 instance)
b)Testing the MLPN with real test cases (619 instance)
Correctly Classified Instances 5040 (78.4314 %) 412 (66.559%)
Incorrectly Classified Instances 1386 (21.5686 %) 207 (33.441)
Mean absolute error 0.0904 0.1536
Root mean squared error 0.264 0.3247
Relative absolute error 33.9128 % 57.2996%
Root relative squared error 72.5942 % 88.4432 %
Table 7. Comparing The MLPN Training Confusion Matrix Against Real Tested Confusion Matrix. a) Confusion Matrix for the MLPN with 10-fold cross
validation paired t-test (6426 instance)
b) Confusion the MLPN with real test cases (619 instance)
a b c d e <-- classified as 252 126 0 0 0 | a = Defected 63 1764 315 0 0 | b = Accepted 0 441 2331 189 0 | c = Good 0 0 252 504 0 | d = Very good 0 0 0 0 189 | e = Excellent
a b c d e <-- classified as 114 53 11 1 0 | a = Defected 45 207 20 4 1 | b = Accepted 14 40 69 0 1 | c = Good 5 9 3 17 0 | d = Very good 0 0 0 0 5 | e = Excellent
5.CONCLUSIONS
In conclusion, the research provided evidence to support the feasibility of integrating a CA with ISO 9126 quality model in order to develop a SQPS. As an experimented SQMM, ISO 9126 approved its flexibility and comprehensibility, especially in covering software development factors adequately. Thus, this research highlights the generality of ISO
9126 model and its implications over integrating ISO 9126 with Machine learning.
ISSN: 1992-8645 www.jatit.org E-ISSN: 1817-3195
292 predications whereas MLP showed more balanced predictions. Hence, this research recommends using MLP to develop CAs for SQPSs, standing with researchers who support the use of MLP in software quality classification [26-28].
Having five different predictions instead of two may increase the possibility of predicting incorrectly. However, research results are original and should be employed to develop software quality systems with better performance, which could be the subject of future research.
Using a never studied before dataset enriched the research and enabled the researchers to conclude originally.
Of course, developers can integrate the developed SQPS within any automated solution for supporting quality measurement. Additionally, the model can be leveraged into a fully capable decision support system for measuring quality.
REFERENCES
[1] C. Rettig, “The trouble with enterprise software”. MIT Sloan Management Review, Vol. 49 (2013) No. 1.
[2] K. Mordal, N. Anquetil, J. Laval, A. Serebrenik, B.Vasilescu, S. Ducasse, “Software quality metrics aggregation” ,Industry Journal of Software: Evolution and Process, Vol. 25 (2013) No. 10, 1117-1135. [3] S. Norbert, M. Rosenmuller, C. Kastner, P.G.
Giarrusso, S. Apel, and S.S. Kolesnikov, "Scalable prediction of non-functional properties in software product lines". In Software Product Line Conference (SPLC) 15th International, IEEE, 2011, 160-169. [4] 4)C. Shilpee, G. Tenne, and S. Bhatia,
"Analysing Software Metrics for Accurate Dynamic Defect Prediction Models”. Indian
Journal of Science and Technology , Vol. 8
(2015) No. S4, 96-100.
[5] J. Ghayathri, E. M. Priya, “Software Quality Models: A Comparative Study”. International Journal of Advanced Research in Computer
Science and Electronics Engineering
(IJARCSEE), Vol. 2 (2013) No. 1, 42.
[6] L. Ming-Chang, "Software Quality Factors and Software Quality Metrics to Enhance Software Quality Assurance." British Journal of Applied Science & Technology, Vol. 4 (2014) No. 21, 3069.
[7] K. Dejaeger, T. Verbraken, B. Baesens, "Toward comprehensible software fault prediction models using bayesian network classifiers." Software Engineering, IEEE Transactions on, Vol. 39 (2013) No. 2, 237-257.
[8] H. Al-Jamimi, M. Ahmed, "Machine learning-based software quality prediction models: state of the art". In International Conference of Information Science and Applications (ICISA), IEEE, 2013, 1-4.
[9] D. P. Naragani, P. Uniyal,"Comparative analysis of software quality models." International Journal of Computer Science and Management Research, Vol. 2 (2013) No. 3. [10]T. A. Alrawashdeh, M. Muhairat, A.
Althunibat, "Evaluating the quality of software in erp systems using the ISO 9126 model." International Journal of Ambient Systems and Applications (IJASA), Vol. 1 (2013) No. 1. [11]S. Mittal, P.K. Bhatia, "Software component
quality models from ISO 9126 perspective: A review." IJMRS’s International Journal of Engineering Sciences, Vol. 2 (2013) No. 2. [12]R.B. Svensson, T. Olsson, B. Regnell, "An
investigation of how quality requirements are specified in industrial practice." Information and Software Technology, Vol. 55 (2013) No. 7, 1224-1236.
[13]Prasad, M. C., Florence, L., & Arya, A., A Study on Software Metrics based Software Defect Prediction using Data Mining and Machine Learning Techniques. International. Journal of Database Theory and Application, Vol. 8 (2015) No. 3, 179-190.
[14]Moeyersoms, J., de Fortuny, E. J., Dejaeger, K., Baesens, B., & Martens, D., "Comprehensible software fault and effort prediction: A data mining approach. Journal of Systems and Software", Vol. 100 (2015), 80-90.
[15]Yadav, D. C., & Pal, S. (2015). Software Bug Detection using Data Mining. International Journal of Computer Applications, 115(15). [16]Prakash, V. A., Ashoka, D. V., & Aradya, V.
M, Application of Data Mining Techniques for Defect Detection and Classification. In
Proceedings of the 3rd International
Conference on Frontiers of Intelligent
Computing: Theory and Applications (FICTA)
2014, 387-395, Springer International
Publishing.
ISSN: 1992-8645 www.jatit.org E-ISSN: 1817-3195
293 [18]S.R. Chidamber and C.F. Kemerer, “A metrics
suite for object-oriented design”. IEEE Transactions on Software Engineering, Vol 20 (1994) No.6, 476-493.
[19]R. Subramanyan and M. S. Krisnan, “Empirical Analysis of CK Metrics for Object-Oriented Design Complexity: Implications for Software Defects”, IEEE Transactions on Software Engineering, Vol. 29 (2003) No. 4, 297-310.
[20]P. Yu, T. Systa, and H. Muller, “Predicting Fault-Proneness Using OO Metrics: An Industrial Case Study”, in Proceedings of Sixth
European Conference on Software
Maintenance and Reengineering, (2002), 99-107.
[21]T.M. Khoshgoftaar and K. Gao, “Count Models for Software Quality Estimation”, IEEE Transactions on Reliability, Vol. 56 (2007) No. 2, 212 – 222.
[22]T.J. McCabe, “A Complexity Measure,” IEEE Transactions on Software Engineering, Vol.2 (1976) No.4, 308-320.
[23]N.E. Fenton and M. Neil, “A critique of software defect prediction models”, IEEE Transactions on Software Engineering, Vol. (1999) No. 5, 675–689.
[24]T. Menzies, J. Greenwald, A. Frank, Data mining static code attributes to learn defect predictors, IEEE Trans. Softw. Eng. Vol. 33 (2007) No. 1, 2–13.
[25]S. Bibi, G. Tsoumakas, I. Stamelos and I. Vlahavas, “Software defect prediction using regression via classification”, IEEE International Conference on Computer Systems and Applications, (2006), 330-336. [26]Gayathri M, Sudha A. Software defect
prediction system using multilayer perceptron neural network with data mining. International Journal of Recent Technology and Engineering (IJRTE) ISSN: 2277-3878. Vol. 3 (2014) No. 2, 54-59.
[27]Katiyar, N., and R. Singh. "Prediction of software development faults using neural network." VSRD-IJCSIT Vol.1(2011) No. 8, 556-566.
[28]Singh M, Singh Salaria D. Software defect prediction tool based on neural network. IJCA. Vol. 70 (2013) No.22, 22–28.
[29]M. Agüero, B. Aires, A.F. MADOU, A. G. ESPERON, “Improving Software Quality with Artificial Intelligence”. Ciencia y Tecnologia, Vol. 11(2011) No. 2.
[30]Zeiss, Benjamin, et al. "Applying the iso 9126 quality model to test specifications." Software Engineering 15.6 (2007): 231-242.
[31] G. Jozanikohan, Golnaz, G.H. Norouzi, F. Sahabi, H. Memarian, and B. Moshiri. "The application of multilayer perceptron neural network in volume of clay estimation: Case study of Shurijeh gas reservoir, Northeastern Iran." Journal of Natural Gas Science and Engineering, Vol. 22 (2015) January, 119-131. [32]O. Alshareet, “An Empirical Study to Develop
a Decision Support System (DSS) for Measuring the Impact of Quality Measurements over Agile Software Development (ASD)”. Indian Journal of Science and Technology, Vol. 8 (2015) No. 15. [33]G.W. Burr, R.M. Shelby, C. di Nolfo, J.W. Jang, R.S. Shenoy, P. Narayanan, K. Virwani, E.U. Giacometti, B. Kurdi, H. Hwang. "Experimental demonstration and tolerancing of a large-scale neural network (165,000 synapses), using phase-change memory as the synaptic weight element." In Electron Devices Meeting (IEDM), 2014 IEEE International, IEEE, 2014, 29-5.
[34]S. Bhattacharyya, S. Bhattacharjee, N.K. Mondal. "A quantum backpropagation multilayer perceptron (QBMLP) for predicting iron adsorption capacity of calcareous soil from aqueous solution." Applied Soft Computing, Vol. 27 (2015), 299-312.
[35]M. Hamedi, S.H. Salleh, M. Astaraki, A. M. Noor, and A. R. Harris, "Comparison of multilayer perceptron and radial basis function neural networks for EMG-based facial gesture recognition." In The 8th International Conference on Robotic, Vision, Signal Processing & Power Applications, Springer Singapore, 2014, 285-294.