ISSN: 1992-8645 www.jatit.org E-ISSN: 1817-3195
AN EFFICIENT METHOD TO CONSTRUCT DIAGONAL
PERMUTATION SHIFT (DPS) CODES FOR SAC OCDMA
SYSTEMS
1HASSAN YOUSIF AHMED, 2Z. M. GHARSSELDIEN AND 3S. A. ALJUNID
1
Electrical Engineering Department, College of Engineering at Wadi Aldawaser, Prince Sattam Bin Abdulaziz University, KSA,
2
Mathematics Department, College of Art and Science, Prince Sattam Bin Abdulaziz University, KSA 3School of Computer and Communication Engineering, Universiti Malaysia Perlis, Malaysia
1
[email protected], [email protected]
ABSTRACT
This work introduces a proficient method to build a newly proposed code, named diagonal permutation shifting (DPS) code for the spectral-amplitude-coding (SAC) optical code-division multiple-access (OCDMA) system. The DPS code is derived and constructed from well-known prime codes and certain matrix operations. This proposed code possesses numerous properties such as the cross-correlation (CC) between any two sequences is always equal to 1, short code length and proper design of the transmitter - receiver structure. In particular, the DPS is capable of removing the impact of multiple access interference (MAI) and further alleviate phase-induced intensity noise (PIIN). Numerical results demonstrate noticeable improvement for the DPS compared to the reported codes and can improve system performance considerably.
Keywords:DPS, SAC, OCDMA, MAI, In-phase CC)
1. INTRODUCTION
This Communication networks with higher bandwidth and affordable cost are growing rapidly in our daily lives. This is because the need for higher throughout networks (i.e., more successful transmission) for online users is always associated with massive bandwidth. The demand for high speed access networks becomes more vital which makes the optical fibers closer to end user. Optical fibers offer vast amounts of bandwidth in THz and to utilize this bandwidth, a multiple access technique should be used. OCDMA is a multiple access technique that is based on assigning a unique code sequence to each user. Concurrent access could be made by sending/receiving these unique code sequences [1-2]. MAI is defined as the key source of OCDAM system’s impairment. MAI is unavoidable noise caused by other users trying to use the same medium simultaneously. Various approaches are used to mitigate the impact of the MAI for different OCDMA techniques. Among these approaches, spectral amplitude-coding (SAC) OCDMA system draws more concerns due to MAI
elimination feature, SAC OCDMA utilizes cheap broadband incoherent sources such as light emitting diodes (LED) [7]. As long as the CC between the users is large, PIIN attributed to the square law photodetection of incoherent sources is another problem leads to system performance deterioration [4]. By using a subtraction technique, an MAI effect can be successfully eradicated when the CC between concurrent users is fixed [3-6-11]. To overcome the performance limitations aforementioned, researchers extensively studied the design of the fixed CC at the code’s construction stage.
ISSN: 1992-8645 www.jatit.org E-ISSN: 1817-3195
length named dynamic cyclic shift (DCS). In contrast, the cardinality of this system is limited by the fact that the number of users must equal the code length. Partitioned partial prime (PPP) code is constructed good orthogonality low CC values with a complicated method using Kronecker Tensor product, multiplication operation and matrix complement [10]. The DPS code family is presented in this paper to overcome these problems. The DPS code possesses numerous properties such as the cross-correlation (CC) between any two sequences is always equal to 1, short code length and proper design of the transmitter - receiver structure using Fiber Bragg grattings (FBGs). The remaining parts of this paper are organized as follows. The mathematical model of the DPS code construction and its features are described in Section 2. The DPS OCDMA network structure is presented in Section 3. Section 4 shows the DPS’s performance analysis. Calculated results and simulation results are elaborated in Section 5. Study findings are drawn in Section 6.
2. CODE CONSTRUCTION
The mathematical model of Diagonal-Permutation-Shift (DPS) code is presented in this section. The DPS characterized by the code weight P, number of users N, code’s length P2+P, cross correlation λc. The DPS is constructed by using some simple algebraic ways and certain matrix operations. It has been derived from the prime code sequences based on the Galois field GF (P) = {0, 1,…, P-1} for P > 2 where P is a prime number. The DPS code can be constructed by using the following steps.
Step 1. (Diagonal process):
Construct primary diagonal sequences of integer numbers as shown in Table. 1 using Eq. (1).
d
i j,= ⋅
(
i j
) mod
P
(1) where i and j represent the position of each element over Galois fields and mod represents the modulo operation. Based on Eq. (1), a generator sequence Dp is constructed as follows.
(2)
For any
P
the following elements are fixed
0 ,0 1,1 1, 1
2
0,
1
(
1) (
1) m od( )
(
2
1) m od( )
1
P P
d
d
d
P
P
P
P
P
P
− −
=
=
=
−
⋅
−
=
−
+
=
(3)
For and 7, the following sequences are generated based on Eq. (2).
{
}
{
}
{
}
3 5 70 1 1
0 1 4
4 1
0 1 4
2
2
4 1
D
D
D
=
=
=
(4)Step 2. (Permutation process):
Construct the basic matrix
B
P0 by takingD
P as a first row, then make a permutation of one time in the next rows to get aP P
×
zero-diagonal symmetric matrix without repeating any row as follows.(5)
For P= 3, 5and 7 the following matrices are obtained based on Eq. (5).
(6)
Step 3. (Shifting process): Construct (P-1) shifted matrices
B
Pk by adding k to each element of the matrixB
0P , where k= 1, 2, P-1. In doing so, the following metrics are obtained in Eq. (7).Step 4. (Joining process): In joining process, the matrix A is obtained by joining
B
Pk in each sequence, then an extra column of matrix mp is added to each correspondingB
Pk .{
0,0 1,1 2,2 1, 1}
P P P
D
=
d
d
d
L
d
− −0,0 1,1 2,2 1, 1
1, 1 0,0 1,1 2, 2
0
2, 2 1, 1 0,0 3, 3
1,1 2,2 3,3 0,0
P P
P P P P
P P P P P P
P
d
d
d
d
d
d
d
d
d
d
d
d
B
d
d
d
d
− − − − − − − − − − − −
=
L
L
L
M
M
M
O
M
L
0 3 0 7 0 50 1 1
0 1 4 2 2 4 1 1 0 1 ,
1 0 1 4 2 2 4 1 1 0
4 1 0 1 4 2 2 0 1 4 4 1
2 4 1 0 1 4 2 1 0 1 4 4
2 2 4 1 0 1 4 ,
4 1 0 1 4
4 2 2 4 1 0 1 4 4 1 0 1
1 4 2 2 4 1 0
1 4 4 1 0
ISSN: 1992-8645 www.jatit.org E-ISSN: 1817-3195
(8)
where
m
P is aP
×
1
matrix contains the elements{0,1, 2,
K
,
P
−
1}
in arbitrary order. Thesize of matrix A is
P
2×
(
P
+
1 )
and itselements
A
i, jwhere ,i
=
0 ,1, 2 , ...,
P
2−
1
and
j
=
0 , 1, 2 , . . . ,
P
.The above four steps can be summarized in Eq. (9). This equation is valid for any prime number P > 2 to generate a code with a unity cross correlation in the form of a matrix.
(9)
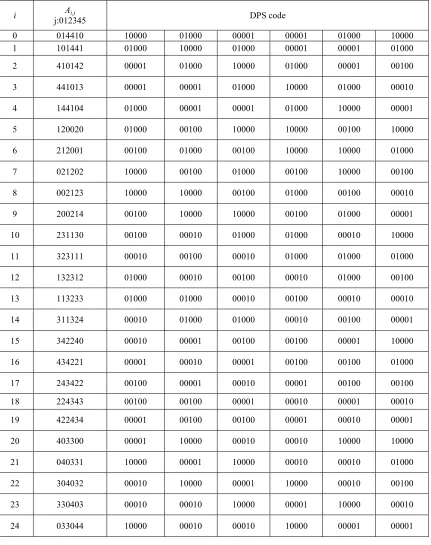
2.3 Code examples
The DPS code patterns for P =5 where
0 , 1, 2 , . . . , 2 4
i
=
andj
=
0 ,1, 2, ..., 5
using Eq. (9) is shown in Table 2.
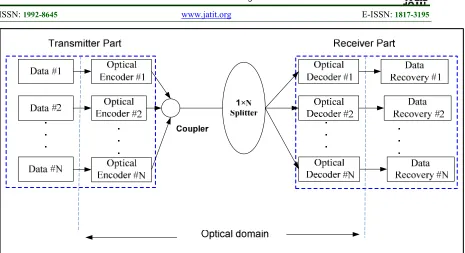
3. DPS OCDMA NETWORK STRUCTURE
Figure. 1 illustrates the basic architecture of N transmitter/receiver pairs of SAC-OCDMA system using the DPS code sequences. In the transmitter section the data of each user are modulated into the optical domain by the DPS encoder using an optical source (LED or Laser) then pass to the coupler. The coupler sums all the optical signals and broadcast to all receivers. At the receiver section, the DPS decoder decodes the intended data by performing filtering process to differentiate between desired signals (auto-correlation function) and undesired signals (cross correlation function) since the
auto-correlation and cross-auto-correlation produce high level and low level outputs respectively.
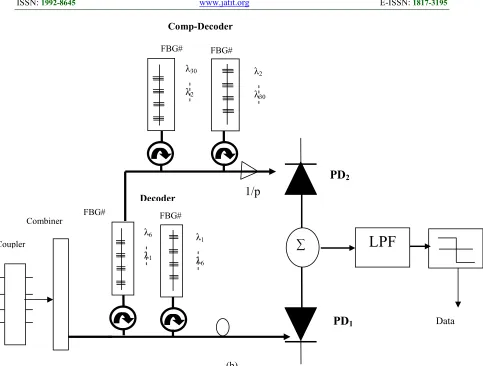
Figure. 2 shows the transmitter/receiver structure based on the DPS code sequence for P=5. In Figure.2 (a), the ON-OFF shift keying modulation is used to modulate the information of user#1, 100000100000001000010100010000 as shown in Table 2. The incoming signal is then reflected to an FBG group; each chip of the desired user is associated with a specific wavelength (λ1 λ7 λ15 λ20 λ22 λ26). The center wavelengths of the FBGs depend on the positions of the mark chips in the code sequences. In Figure. 2 (b) the incoming signal is decoded by the decoder which has a matched spectral response to the intended encoder for the data to be recovered (Decoder). The detected output (the intended signal spectrum and overlapping spectra from other interferers) from the decoder is P+1 power units for the desired user accompanied by λ power units for interferers.
The complementary decoder (Comp-Decoder) branch detects the complementary spectrum of the intended user (from Table 2, λ2 λ3 λ4 λ5 λ6λ8 λ9 λ10 λ11 λ12 λ13 λ14 λ16 λ17 λ18 λ19 λ21 λ23 λ24λ25 λ27 λ28 λ29 λ30 ); where the received signal is passed through FBGs groups and the result passed to a balanced photo-detectors. From the FBGs, different center wavelengths are placed along a piece of fiber and the wavelength elements of spectral codes are spread out in time. So, second fibers with FBGs in reverse positions are needed in each encoder and decoder in order to compensate the time spreading. In order to distinguish between the desired and undesired signals, a subtractor is used to subtract the unwanted signals from the wanted signal to reconstruct the desired signal. The logical representation of MAI cancellation for DPS code is presented in Table 3 based on Table 2. Finally, after photo detections, low pass filter (LPF) and thresholding processes, the original data is reconstructed.
4. SYSTEM PERFORMANCE
The code properties of DPS based on the encoder-decoder structure as shown in Figure. 2 can be written as:
1
1, ( , )
1,
P f g
PD f g
f g + = = ≠ (10)
[ ]
[ ]
[ ]
0 1 1,
P P P P P P PB
m
B
m
A
B
−m
=
M
M
(
)
1,
.
mod
mod ,
mod ,
mod ,
lim
P P P
i j w P P
P P
P
P w
k j
i i
j j
A
S
j i
i
P
P
P
i
i
P
j
j
P
k
k
k
P
S
ISSN: 1992-8645 www.jatit.org E-ISSN: 1817-3195
Table 1: DPS code sequences for P=5
i Ai,j
j:012345 DPS code
0 014410 10000 01000 00001 00001 01000 10000
1 101441 01000 10000 01000 00001 00001 01000
2 410142 00001 01000 10000 01000 00001 00100
3 441013 00001 00001 01000 10000 01000 00010
4 144104 01000 00001 00001 01000 10000 00001
5 120020 01000 00100 10000 10000 00100 10000
6 212001 00100 01000 00100 10000 10000 01000
7 021202 10000 00100 01000 00100 10000 00100
8 002123 10000 10000 00100 01000 00100 00010
9 200214 00100 10000 10000 00100 01000 00001
10 231130 00100 00010 01000 01000 00010 10000
11 323111 00010 00100 00010 01000 01000 01000
12 132312 01000 00010 00100 00010 01000 00100
13 113233 01000 01000 00010 00100 00010 00010
14 311324 00010 01000 01000 00010 00100 00001
15 342240 00010 00001 00100 00100 00001 10000
16 434221 00001 00010 00001 00100 00100 01000
17 243422 00100 00001 00010 00001 00100 00100
18 224343 00100 00100 00001 00010 00001 00010
19 422434 00001 00100 00100 00001 00010 00001
20 403300 00001 10000 00010 00010 10000 10000
21 040331 10000 00001 10000 00010 00010 01000
22 304032 00010 10000 00001 10000 00010 00100
23 330403 00010 00010 10000 00001 10000 00010
ISSN: 1992-8645 www.jatit.org E-ISSN: 1817-3195 2 0, ( , ) , f g PD f g
P f g
=
= ≠
(11)
The removal of MAI can be made as the cross correlation of Eq. (11) can be subtracted from Eq. (10) when f ≠ g. Thus, the decoder that calculates Eq. (12) refuses the MAI coming from interfering users and gets the original information bits.
2 1
1, ,
(f, g ) (f, g )
0 , .
P f g
PD PD
P
o th erw is e
+ =
− =
(12)
Using the method described in [5-6, 11], the signal to noise ratio (SNR) for the DPS is computed and is given in Eq. (13).
[
]
2 2 2 2
2
2 2 4
2 2
( 1)
(2 1
(13)
P Psr L
P e Bsr P B Nsr K T Bb n
L V L RL
N P NP N P P
SNR
ℜ ℜ ℜ ∆ − + + + − + + =
wherePsr is the effective power of a broad-band source at the receiver; ℜ is the responsivity of the photodiode; e is the electron charge; B is the electrical equivalent noise bandwidth of the receiver; KB is Boltzmann’s constant; Tn the absolute receiver noise temperature; RL is the
receiver load resistor; ΔV is the optical source bandwidth.
The Gaussian approximation is used to calculate the bit error rate (BER) based on SNR as in Eq. (14) [5-6, 11].
5. FINDINGS AND DISCUSSION
A sufficient amount of SNR is important in any communication system because it reflects the reliability of the system in general. The SNR is the average of dividing the signal power by the total noise power. BER and SNR are interconnected; a better BER comes from a better SNR. In the following paragraphs we will explain and elaborate the numerical and simulation results obtained by Eq. (13) and Eq. (14). Table 2 lists the parameters used in our analysis.
Table 2: System parameters
5.1 Theoretical result
In Figure. 3 the SNR is plotted against the number of active users for the DPS (P = 5), DCS (W=7) and RD (W= 7) codes. The effects of intensity noise, shot noise and thermal noise have been considered when the effective power from each user is -10dBm. It is reported that higher SNR can be achieved by the DPS code for P =5 than that of W=7. Higher SNR can be obtained with the big values of W thus accommodated high number of active users.
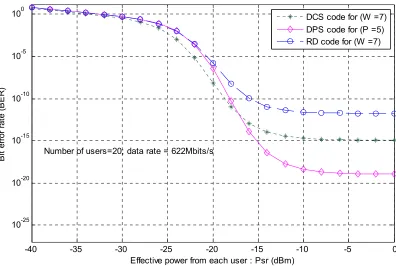
Figure. 4 shows the effective power Psr plotted vs. the BER taking into account the effects of the intensity noise, thermal noise and shot noise when the number of active users is 20 at data rate of 622Mb/s for DPS (P= 5), DCS (W=7) and RD (W=7) codes. Figure.4 reveals that, the acceptable BER of the DPS code at error free transmission code is lower than that for the DCS and RD codes when the number of active users is the same. As a mean of comparison, the DPS reached a 10-18 BER at received power -10 dBm, while DCS and RD achieved 10-13 and 10-11 at the same received power. This is because the interference from other users is fixed to one for the DPS code, whereas for DCS and RD codes the interference becomes two as the number of simultaneous users increases,
Symbol Parameter Value
η
PD quantum efficiency 0.6Vc Line-width of the thermal source
3.75THz
λ0 Operation wavelength 1550 nm
B Noise-equivalent electrical bandwidth
311 MHz
Rb Data bit rate 622
Mb/s Tn Absolute receiver noise
temperature
300 K
ISSN: 1992-8645 www.jatit.org E-ISSN: 1817-3195
Figure 1: Block diagram of DPS code network.
(a) Mach-Sender Modulator
Data bit
Light
Source
Encoder
FBG#1 FBG#2
λ1
λ6
λ6
ISSN: 1992-8645 www.jatit.org E-ISSN: 1817-3195
[image:7.612.74.557.79.445.2](b)
Figure 2: Implementation Of The Complementary Detection Technique Using DPS Code, (A) Transmitter (B) Receiver. PD1 And PD2: Photodiodes. LPF: Low Pass Filter.
5.2 Simulation Result
A block diagram for two users is demonstrates in Figure. 5. Virtual Photonic Instrument (VPITM) version 7.1 simulation software is used to carry out the tests. The spectral width of each chip is 0.8 nm (100GHz). The tests were conducted for various distances with the ITU-T G.652 Non Dispersion Shifted Fiber (NDSF) single mode fiber (SMF) standard. At 1550 nm wavelength, the attenuation coefficient was 0.25 dB/km, and the chromatic dispersion coefficient was 18ps/nm-km and the polarization mode dispersion (PMD) coefficient was 5 ps/km. According to the typical industry values, the effects of four-wave mixing (FWM), the self phase modulation (SPM), and the group delay were activated to simulate the real environment as close as possible. At the transmitter side, a pseudo random bit sequence (PRBS) generator was used as
the input data of each user followed by a coder jitter to generate an NRZ sample finished with a rise time to adjust the rise time of the pulse. To modulate the laser output, a Mach-Zehnder modulator was used. From this Figureure after the transmission, fiber Bragg gating (FBG) groups were used to decode the coded sequence words. A clock recovery ideal was used to synchronize the incoming optical signal with the original transmitted signal. An extra clock recovery was used before the photo detectors to synchronize incoming optical signal from desired user and its complementary. A photo detector (PD) is used to decode the coded signal followed by 0.7 GHz low pass filter (LPF) and error detection respectively. The transmitted power out of the broadband source is set to -10 dBm. At the receiver side, the incoming signal was divided into two parts; one to the decoder that matches the structure of the encoder filter, and the other to the decoder that has the complementary filter structure [3].
1/p
Decoder
λ1
λ6
FBG#
λ6
λ1
FBG#
Coupler
Combiner
Comp-Decoder
FBG# FBG#
λ30
λ2
λ2
λ30
PD
1PD
2∑
LPF
ISSN: 1992-8645 www.jatit.org E-ISSN: 1817-3195
0 20 40 60 80 100 120
101 102 103 104 105
Number of Simultaneous User
S
ig
n
a
l
to
N
o
is
e
R
a
ti
o
(
S
N
R
)
[image:8.612.93.489.69.349.2]DPS code ( P=5) DCS code ( W=7) RD code (W=7)
Figure 3: SNR Versus Number Of Active Users When Psr = -10dbm At 622Mb/S
-40 -35 -30 -25 -20 -15 -10 -5 0
10-25 10-20 10-15 10-10 10-5 100
Effective power from each user : Psr (dBm)
B
it
e
rr
o
r
ra
te
(
B
E
R
)
DCS code for (W =7) DPS code for (P =5) RD code for (W =7)
Number of users=20; data rate = 622Mbits/s
[image:8.612.119.515.400.666.2]ISSN: 1992-8645 www.jatit.org E-ISSN: 1817-3195
Figure.5: Simulation Setup For The OCDMA System With Complementary Technique [9].
1 2 3 4 5 6 7 8 9 10
10-15 10-10 10-5 100
Data rate (Gbit/s)
B
it
e
rr
o
r
ra
te
(
B
E
R
)
Numrical calculations
Simulation calculations (Fiber Length= 30km) Simulation calculations (Fiber Length= 50km) Simulation calculations (Fiber Length= 40km)
DPS code (p= 3)
[image:9.612.116.496.405.670.2]ISSN: 1992-8645 www.jatit.org E-ISSN: 1817-3195
Figure 6 demonstrates the BER plotted against the data rate for various distances. In terms of BER the bit rate impairs the system performance as shown in Figure. 6. From the Figureure, the probability of error rate increases exponentially as the bit rate increases. This is because by increasing the bit rate the pulse width will decrease consequently making the bits more susceptible to dispersion effect. In particular, the Figureure clearly proves that the probability of error increases exponentially with the transmission distance. A long fiber causes a larger dispersion and attenuation, eventually increasing the probability of error. The Figureure also reveals that, the calculated result was better compared to simulation results of the magnitude almost three times due to in the calculation, the effects of attenuation, fiber non-linearity, and insertion loss are not considered. The calculation is only based on the Equations (13) and (14).
6. CONCLUSION
In this paper, we introduced a construction approach for a new code family with a fixed cross correlation value of one for the SAC-OCDMA system. The code construction and code properties of this code family have been elaborated. Based on the proposed system, the structures of the transmitter and receiver sides have been developed using FBG groups. The DPS code family has good property in cross-correlation control, short code length, and easy to design using fiber Bragg gratings (FBGs) set. The results of system performance are compared with reported codes. To backup our result, optical simulation software is carried out and the result is compared with calculated results. It concludes that, the bit rate and transmission distance have negative impacts on system performance in terms of BER due to dispersion effect. It has shown that the new code family can suppress intensity noise productively and improve the system performance noticeably.
7. ACKNOWLEDGEMENT
This project was supported by the Deanship of Scientific Research at Prince Sattam bin Abdulaziz University under the research project # 2014/1/877.
REFERENCES
[1] J. A Salehi, “Code division multiple access techniques in optical fiber network—Par I: Fundamental principles”, IEEE Trans. Commun, Vol. 37, 1989, 824–833.
[2] A Stok, E. H Sargent, “Lighting the local network: Optical code division multiple access and quality of service provisioning” , IEEE Network. Vol. 14, 2000, 42–46.
[3] M Kavehrad, D Zaccarh, “Optical Code-Division-Multiplexed Systems Based on Spectral Encoding of Noncoherent Sources”, Journal of Lightwave Technology, Vol 13, 1995, 534-545.
[4] Smith, E. D. J.; Blaikie R. J.; D. P. Taylor, “Performance enhancement of spectral amplitude-coding optical CDMA using pulse-position modulation”, IEEE Trans. Commun, 46, 1998, 1176–1185.
[5] Z. Wei, H. M. H. Shalaby, H. Ghafouri-Shiraz, H, “Modified Quadratic Congruence codes for Fiber Bragg-Grating-Based SAC-OCDMA”, Journal of Lightwave Technology, Vol. 19, 2002, 1209-1212.
[6] Wei, Z.; H. Ghafouri-Shiraz, “Code for spectral amplitude-coding optical CDMA systems”, J. Lightwave Technol, Vol. 20, 2002, 1284-1291.
[7] A. F Hilal, S.A. Aljunid, R.B. Ahmad, “Performance of random diagonal code for OCDMA systems using new spectral direct detection technique”, Optical Fiber Technology, Vol. 15, 2009, 283-289.
[8] T. H. Abd, S. A. Aljunid, H. A. Fadhil, , R. B. Ahmad, Junita M. N, “Enhancement of performance of a hybrid SAC-OCDMA system using dynamic cyclic shift code”, Ukr. J. Phys. Opt. Vol. 13, 2012, 12-27.
[9] T. H. Abd, S. A. Aljunid, H. A. Fadhil, R. B. Ahmad, N. M. Saad, “Development of a new code family based on SAC-OCDMA system with large cardinality for OCDMA network”, Optical Fiber Technology, Vol. 17, 2011, 273-280.
[10]Shin-Pin. Tseng and Jingshown We, “A new code family suitable for high-rate SAC OCDMA PONs applications”, IEEE Journal on Selected Areas in Communications, Vol. 28, 2010, 827-837.
![Figure.5: Simulation Setup For The OCDMA System With Complementary Technique [9].](https://thumb-us.123doks.com/thumbv2/123dok_us/8907853.957697/9.612.116.496.405.670/figure-simulation-setup-ocdma-complementary-technique.webp)
