Validating Measurement Model for Total Quality
Management Constructs on Optimization of
Service Organizations using Confirmatory
Factor Analysis
Esam M. A. Mustafa
Faculty of Technology Management and Business Universiti Ton Hussien Onn Malaysia
86400 Parit Raja, Johor, Malaysia [email protected]
Abdul Talib Bon
Faculty of Technology Management and Business Universiti Ton Hussien Onn Malaysia
86400 Parit Raja, Johor, Malaysia [email protected]
Abstract— Purpose of this paper is to detail a validation of
measurement model for Total Quality Management (TQM)
practices proposed to optimize services organizations
performance outcomes, using Confirmatory Factor Analysis (CFA) method. The measurement model involved data collected from 209 services organizations in Malaysia. Data screening and reliability test were applied and reported. Confirmatory Factor Analysis was applied through two stages, first run and second run, using AMOS ver.20 software. Results of constructs reliability test showed acceptable Cronbach’s Alphas (more than
0.7). Run-respecify-run CFA procedure confirmed the
measurement model for further use.
Keywords— TQM practices; CFA; measurement model; Service organizations optimization
I. INTRODUCTION
Implementing Total Quality Management (TQM) optimizes overall services organizations outcomes through increasing their competitive advantage [1, 2]. However, the optimistic results of the increase in competitive advantage depends on how TQM has been implemented [3]. An argument claims that the ideal method of implementing TQM system is integrating them into everyday business practices within the firm [4]. In detail, some elements of the management system of the firm such as top management knowledge of TQM that supports its implementation and practices human resource involvement in business processes, customer satisfaction, can play crucial role in successful implementation of TQM in optimization of services organizations results [4].
This argument is supported by Abdullah, Uli, & Tari [5]. Abdullah et al., (2009) added soft TQM practices and formulate a framework combines from four business excellence models and awards criteria (namely Malcolm Baldrige National Quality Award (MBNQA); European Foundation for Quality Management (EFQM; and Deming Award). Their framework includes: organization’s leadership practices, organizational learning practices, teamwork
practices, process management practices, training and communication practices.
During the last two decades, high market competition and the significant increase of services organizations’ contribution in local and global economics have increased the need for TQM in services industries [6-8]. Implementing TQM system in services organizations differs from implementing them in manufacturing organizations [6, 9, 10]. Manufacturing organizations emphasize on the production process management and quality, while service organizations focus more on human resource and customer satisfaction [11].
II. LITERATURE REVIEW
TQM Practices
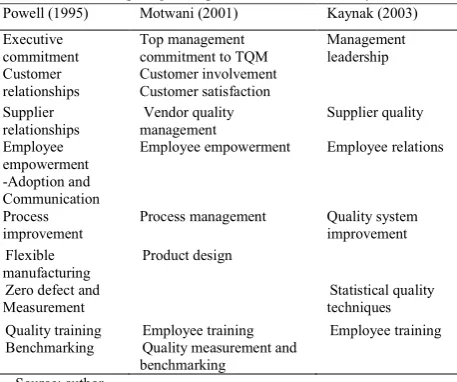
TQM Practices refer to a group of activities and actions that manifests and embodies TQM principals [12]. TQM practices are excerpted from Quality Management (QM) practices which formulated and developed by quality management gurus, like Deming (1986) and Juran (1988), and late TQM pioneer studies lik; Kaynak (2003); Motwani (2001) and Powell (1995) who developed frameworks that have became basis of TQM practices literature, table 1 compares those three examples of those developed frameworks.
Table 1. Comparing TQM practices between three key studies Powell (1995) Motwani (2001) Kaynak (2003)
Executive commitment
Top management commitment to TQM
Management leadership Customer
relationships
Customer involvement Customer satisfaction Supplier
relationships
Vendor quality management
Supplier quality
Employee empowerment
Employee empowerment Employee relations
-Adoption and Communication Process improvement
Process management Quality system improvement Flexible
manufacturing
Product design
Zero defect and Measurement
Statistical quality techniques Quality training Employee training Employee training Benchmarking Quality measurement and
benchmarking Source: author
TQM practices in service organizations optimization
It is proved that implementing TQM optimizes the performance of service organizations and increases their competitive advantage [1, 2]. The optimistic outcomes of TQM on the performance depends on the way of employing TQM [3]. The optimistic implementation of TQM system is integrating them into everyday business process. In addition, some elements of the firm’s management system (such as top
management knowledge of TQM, human resource
involvement, and customer satisfaction) play crucial role in the implementation of TQM to optimize the performance of services organizations [4].
Earlier evolution of TQM focused on manufacturing and production industries rather than service industries. The high competition in the market and the increase in service sector share in local and global economics increased the need for TQM in services industries [6-8]. Implementation approach of TQM in services organizations differs from its approach in manufacturing organizations [6, 9, 10]. Manufacturing organizations emphasize on the product process management and quality, while service organizations focus more on customer satisfaction [11]. Characteristics of service like intangibility and heterogeneous make it difficult to measure the quality of a service compared to material products and goods [10, 14]. Intangibility refers to the qualitative measurement that can not be presented in numbers [15, 16] which cause a measurement problem.
[image:2.595.309.559.68.202.2]Service organizations use less hard practices of TQM practices, such as statistical process control SPC. They rely more on customers’ judgment about services quality. In manufacturing organizations employees and workers trained on advanced statistical methods while in services organizations training focus on communication and interpersonal skills [17] , see table 2 for the comparison.
Table 2. Comparing TQM practices between service and manufacturing organizations
TQM Practices in Service Organizations
TQM Practices in Manufacturing organizations focus on Human resources focus on technology and production
Management commitment and leadership is important
Management commitment and leadership is important. Continuous improvement Continuous improvement
Training emphasizes on interpersonal relationship and communication skills
Training emphasizes on technical skills
Checking customer feedback is important
Elimination of product defects is important
Quality measurement through customer satisfaction
Quality measurement by statistical techniques
Source: Lenka et al., (2010)
Brah, Wong, & Rao [18] found that top management commitment, customer focus, employee empowerment, and employee involvement as the most critical TQM implementation constructs in service organization. Those constructs fit with the intangibility of service [18]. Samat, Ramayah, & Saad [19] added, in term of practices, to the previous constructs other three constructs: training and education, continuous improvement, and Information and communication. Comparing to the other discussed studies, TQM constructs used and examined in the study of Samat et al., (2006) are more comprehensive. Besides, Samat et al’ study was conducted in Malaysia where the current study takes place.
The same TQM constructs included in the framework of total service quality (TQS) developed by Gupta, McDaniel, & Herath [20]. Their framework combined three constructs: leadership, organizational culture and employee commitment. Bon, Mustafa, & Rakiman [21] proposed three construct as the most dominant TQM constructs in service organizations: management leadership and commitment, customer focus, and human resource management.
Based on those discussed frameworks, the framework of this study includes six constructs: Management leadership commitment, customer focus, employee empowerment, employee involvement, training, and information analysis. These six constructs will be validated in order to be used for further studies involving TQM.
III. METHODOLOGY
According to Malaysian Standard Industrial Classification (MSIC) 2008 Ver. 1.0 which followed the latest standards of International Standard Industrial Classification of All Economic Activities (ISIC) [22], service sector in Malaysia comprises of 12 subsectors which are: Distributive trade, Food and beverage, Transport and storage, Health and social work, Information and Communication, Accommodation, Business service, Financial service, Construction, Architectural, and related services, Education and training, Arts, entertainment and recreation, and Other services. Therefore, stratified random sampling technique was followed to select the sample [23, 24].
Each stratum presented one subsector. A number of 680 questionnaires were distributed through both internet and self delivered survey methods. A total of 209 valid returned questionnaires were used in this study.
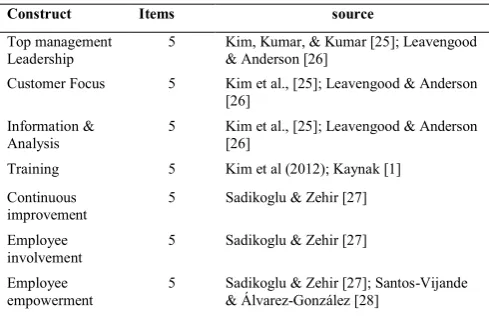
[image:3.595.57.302.356.514.2]Based on the number of employees, the majority (91%) of the responded organizations was from small and medium sized enterprises (SMEs) and most of them implemented TQM systems for more than 10 years. Measurement items of the questionnaire were adapted from previous studies have the same purpose like this study, see table 3. All items were scaled 5-points likert scale, 1 presents strongly disagree, 2 presents Disagree, 3 presents inferential/normal, 4 presents Agree, and 5 presents Strongly agree. Slight changes and rewording were done based on experts’ opinions.
Table 3. TQM adapted measurements and studies adapted from
Construct Items source
Top management Leadership
5 Kim, Kumar, & Kumar [25]; Leavengood & Anderson [26]
Customer Focus 5 Kim et al., [25]; Leavengood & Anderson [26]
Information & Analysis
5 Kim et al., [25]; Leavengood & Anderson [26]
Training 5 Kim et al (2012); Kaynak [1]
Continuous improvement
5 Sadikoglu & Zehir [27]
Employee involvement
5 Sadikoglu & Zehir [27]
Employee empowerment
5 Sadikoglu & Zehir [27]; Santos-Vijande & Álvarez-González [28]
Answers of all valid questionnaires (209 copies) were assigned to numbers and entered into Statistical Package for the Social Sciences (SPSS ver. 19) software as first step of data screening [23, 24]. Then data screening was implemented in order to deal with outliers and missing values. Then each construct was modeled graphically using Analysis of Moment Structures (AMOS ver. 20) software in order to be validated using Confirmatory Factor Analysis (CFA).
IV. CONFIRMATORY FACTOR ANALYSIS
CFA was considered to be proper testing and validation method in this study because TQM constructs were already been empirically tested and existed in theoretical models of previous studies [29-31]. To validate a construct using CFA, the construct must meet the good-of-fit (GOF) indices acceptable values. Assessing the fitness of the construct indicates whether the construct fits the data or not [32, 33]. In applying CFA under structural equation modeling (SEM) approach , most of indices are categorized under two categories: absolute GOF indices and incremental GOF indices [32].
There are many indices show the GOF like Goodness-of-Fit Index (GFI), Normed Fit Index (NFI), Comparative Fit Index (CFI), nonormed fit index (NNFI), also named Tuker-Lewis Index (TLI), [32-34]. Marsh, Hau, & Grayson, [30] indicated that the most of GOF indices used are Chi-square statistic (x²), CFI, Root Mean Square Error of Approximation (RMSEA), GFI, TLI and NFI. Accordingly, this study will use those indices. x² should be higher than 0.05. The acceptable values of GFI, TLI, and CFI is above .9 while the acceptable value of RMSEA is below 0.1 [31].
In addition to GOF, measurement model is also validated through factor loading (or regression weight in AMOS text output) and communality (or squared multiple correlation) values. In order to be considered for further analysis, item should have factor loading value above 0.7 and communality above 0.4 [35].
First run of the measurement model
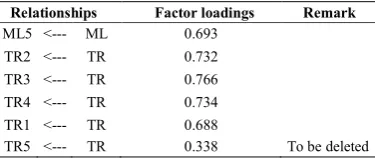
Fig. 1 shows the first run of graphic measurement model of TQM constructs which are: Management leadership commitment (ML), customer focuses (CF), Employee empowerment (EE), Employee involvement (EI), training (TR), and information analysis (IA). Excluding GFI, all GOF indices in fig. 1 show acceptable and good values (CHI-Square is significant 556.981, NC = 1.53, NFI = 0.92, TLI = 0.97, CFI = 0.97, RMSEA = 0.05) [31, 35]. Factor loadings given by AMOS text outputs are listed in table 4 showing the item TR5 with poor loading (0.338) and low communality value (0.114). Therefore, the measurement model needs respecification regarding the item TR5 [31, 35].
Fig. 1: Measurement model (first run)
Table 4. factor loadings of the measurement model in the first run
Relationships Factor loadings Remark CF2 <--- CF 0.987
CF3 <--- CF 0.988
CF4 <--- CF 0.974 CF5 <--- CF 0.959 CF1 <--- CF 0.897 EI4 <--- EI 0.995 EI3 <--- EI 0.992
EI5 <--- EI -0.948 To be deleted EI2 <--- EI 0.947
EI1 <--- EI 0.856 EE3 <--- EE 0.992 EE1 <--- EE 0.900 EE5 <--- EE 0.876 EE2 <--- EE 0.846
[image:4.595.88.272.382.676.2]EE4 <--- EE 0.810 IA3 <--- IA 0.904 IA2 <--- IA 0.863 IA5 <--- IA 0.852 IA4 <--- IA 0.859 IA1 <--- IA 0.785 ML2 <--- ML 0.903 ML4 <--- ML 0.761 ML1 <--- ML 0.744 ML3 <--- ML 0.714
Table 4. factor loadings of the measurement model in the first run
Relationships Factor loadings Remark ML5 <--- ML 0.693
TR2 <--- TR 0.732 TR3 <--- TR 0.766 TR4 <--- TR 0.734 TR1 <--- TR 0.688
TR5 <--- TR 0.338 To be deleted
Also shows in table 4, the item EI5 has negative loading (-0.95). Based on these poor factor loadings, and communality values and also based on the slight outlier covariances values, model respecification procedures need to be applied [31].
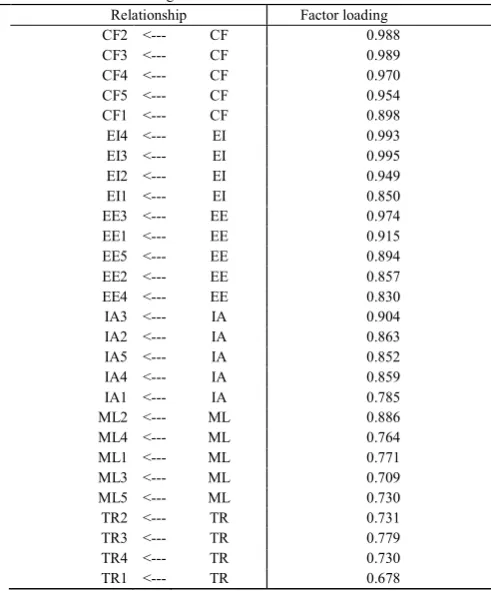
Second run of the measurement model
Fig. 2 shows the second run of TQM measurement model after deleting TR5 and EI5. Now all GOF indices were enhanced to good. CHI-Square is still significant 447.54, NC decreased to 1.36, GFI increased to .88 NFI increased to 0.93, TLI increased to 0.98, CFI increased to 0.98, RMSEA decreased to 0.04 [31]
Factor loadings given by AMOS text output are listed in table 5 are good. Based on these GOF, factor loadings, and communalities value, the model considered to be valid and no more respecification needed [31, 35].
Table 5. Factor loadings of the measurement model in the second run Relationship Factor loading
CF2 <--- CF 0.988
CF3 <--- CF 0.989
CF4 <--- CF 0.970
CF5 <--- CF 0.954
CF1 <--- CF 0.898
EI4 <--- EI 0.993
EI3 <--- EI 0.995
EI2 <--- EI 0.949
EI1 <--- EI 0.850
EE3 <--- EE 0.974
EE1 <--- EE 0.915
EE5 <--- EE 0.894
EE2 <--- EE 0.857
EE4 <--- EE 0.830
IA3 <--- IA 0.904
IA2 <--- IA 0.863
IA5 <--- IA 0.852
IA4 <--- IA 0.859
IA1 <--- IA 0.785
ML2 <--- ML 0.886
ML4 <--- ML 0.764
ML1 <--- ML 0.771
ML3 <--- ML 0.709
ML5 <--- ML 0.730
TR2 <--- TR 0.731
TR3 <--- TR 0.779
TR4 <--- TR 0.730
TR1 <--- TR 0.678
Assessing construct reliability and validity
Construct reliability is the internal consistency which measured by squaring the total sum of the factors loadings, while Construct validity is “the extent to which a set of
measured variables actually represent the theoretical latent that they design to measure”. [31]. Construct validity is mostly
assessed through assessing the convergent validity and face (or content) validity [23, 31, 33].
Assessing face validity
Face validity is “the agreement that a question, scale, or
measure appears logically to reflect accurately what it was intended to measure” [23]. Face validity in this study was
achieved through adapting all measures from previous studies, conducted for the similar purposes, and then verified by experts.
Assessing convergent validity
Convergent validity is referring to the degree of shared variance between measures of a construct [31, 32]. This validity is assessed though assessing construct items loadings, Average Variance Extracted (AVE) and reliability of the construct (CR). To achieve the convergent validity, AVE values should be higher than .5 and CR should be higher than .7, AVE less than .5 indicates error remains and it may be higher than the variance appears [31].
AVE is calculated by of sum of items squared factor loadings divided to the number of measures. The Formula for calculating AVE is:
VE =
Where as:
i presents number of items
λ presents the standardized factor loadings n presents number of items of the construct
Construct reliability is calculated through the formula
[image:5.595.335.530.306.600.2]All constructs included in the measurement model have achieved AVE above .5 and achieved good reliabilities (all above .8) as showed in table 6. Thus constructs convergent validity assumed to be achieved [31].
Table 6. Constructs AVE and CR
CF EI EE IA ML TR Item
Reliability Delta
CF2 0.99 0.98 0.02
CF3 0.99 0.98 0.02
CF4 0.97 0.94 0.06
CF5 0.95 0.90 0.10
CF1 0.90 0.81 0.19
EI4 0.99 0.98 0.02
EI3 0.99 0.98 0.02
EI2 0.95 0.90 0.10
EI1 0.85 0.72 0.28
EE3 0.97 0.94 0.06
EE1 0.92 0.85 0.15
EE5 0.89 0.79 0.21
EE2 0.86 0.74 0.26
EE4 0.83 0.69 0.31
IA3 0.90 0.81 0.19
IA2 0.86 0.74 0.26
IA5 0.85 0.72 0.28
IA4 0.86 0.74 0.26
IA1 0.79 0.62 0.38
ML2 0.87 0.76 0.24
ML4 0.76 0.58 0.42
ML1 0.77 0.59 0.41
ML3 0.71 0.50 0.50
ML5 0.73 0.53 0.47
TR2 0.73 0.53 0.47
TR3 0.78 0.61 0.39
TR4 0.73 0.53 0.47
TR1 0.68 0.46 0.54
AVE 0.92 0.90 0.80 0.73 0.60 0.53 CR 0.98 0.97 0.95 0.93 0.88 0.82
V. CONCLUSION
The purpose of this paper was to validate a measurement model for TQM constructs in service organizations using CFA method. The data were collected from 209 0rganizations from 12 services subsector namely (Distributive trade, Food and beverage, Transport and storage, Health and social work,
∑
ni=1
λ i 2
+
∑
n
i=1
δ
)
(
i i=1∑
n λ2
)
(
iCR =
i=1
∑
n λInformation and Communication, Accommodation, Business service, Financial service, Construction, Architectural, and related services, Education and training, Arts, entertainment and recreation, and Other services). CFA applied using AMOS ver.20. Assessment of the measurement model performed based on three justifiers: GOF indices, items loadings (factor loadings) values, and applying modification index. Based on CFA two-run stages, the measurement model was developed and considered valid for further use.
ACKNOWLEDGMENT
The Authors appreciation and thank Universiti Tun Hussein Onn Malaysia (UTHM) represented in: Office for Research, Innovation, Commercialization and Consultancy (ORICC) for funding and supporting this study and Center of Graduate Studies (CGS) for financing this paper. Appreciations and gratitude are also revealed to all friends who have played significant role in data collection.
REFERENCE
[1] Kaynak, H., The relationship between total quality management
practices and their effects on firm performance. Journal of
Operations Management, 2003. 21(4): p. 405-435.
[2] Flynn, B.B., R.G. Schroeder, and S. Sakakibara, The Impact of
Quality Management Practices on Performance and Competitive Advantage. Decision Sciences, 1995. 26(5): p. 659-691.
[3] Soltani, E., et al., A review of the theory and practice of managing
TQM: An integrative framework. Total Quality Management &
Business Excellence, 2008. 19(5): p. 461-479.
[4] Lewis, W.G., K.F. Pun, and T.R.M. Lalla, Exploring soft versus
hard factors for TQM implementation in small and medium-sized enterprises. International Journal of Productivity and Performance
Management, 2006. 55(7): p. 539 - 554.
[5] Abdullah, M., J. Uli, and J. Tari, The relationship of performance
with soft factors and quality improvement. Total Quality
Management, 2009. 20: p. 735-748.
[6] 6. Juneja, D., S. Ahmad, and S. Kumar, Adaptability of
Total Quality Management to Service Sector. International Journal
of Computer Science & Management Studies, 2011. 11(2): p. 93-98.
[7] Alejandro, L., et al., An Overview and Examination of the
Malaysian Service Sector, O.O.I. U.S. INTERNATIONAL
TRADE COMMISSION, Editor. 2010: WASHINGTON. [8] OECD, R&D and innovation in services. 2008, Directorate for
Science Technology and Industry, Organization for Economic Co-operation and Development OECD.
[9] Bon, A.T. and E.M.A. Mustafa, Impact of Total Quality
Management on Innovation in Service Organizations: Literature Review and New Conceptual Framework. Procedia Engineering,
2013. 53(0): p. 516-529.
[10] Lenka, U. and D. Suar, A holistic model of total quality
management in services. The Icfaian Journal of Management
Research, 2008. 7(3): p. 57-72.
[11] Mustafa, E.M.A. and A.T. Bon. Impact of Customer orientation on
Innovation: Literature Review. in
National Graduate Conference 2012 (NatGrad2012). 2012.
Putrajaya Universiti Tenaga Nasional.
[12] Rönnbäck, Å. and L. Witell, A review of empirical investigations
comparing quality initiatives in manufacturing and service organizations. Managing Service Quality, 2008. 18(6): p. 577 –
593.
[13] Ueno, A., What are the fundamental features supporting service
quality. Journal of Services Marketing, 2010. 24(1): p. 74 - 86.
[14] Talib, F., Z. Rahman, and M.N. Qureshi, Total Quality
Management in Service Sector: A literature Review. International
Journal of Business Innovation and Research, 2012. 6(3): p. 259-301.
[15] Zeithaml, V.A., M.J. Bitner, and D.D. Gremler, Services
marketing: integrating customer focus across the firm. 4 ed. 2006,
Singapore: Mc-Graw hill.
[16] Parasuraman, A., V.A. Zeithaml, and B. L., Servqual: A
multiple-item scale for measuring consumer perceptions of service quality.
Journal of Retailing, 1988. 64(1): p. 12 - 40.
[17] Lenka, U., D. Suar, and P.K.J. Mohapatra, Soft and Hard Aspects
of Quality Management Practices Influencing Service Quality and Customer Satisfaction in Manufacturing-oriented Services. Global
Business Review, 2010. 11(1): p. 79-101.
[18] Brah, S.A., J.L. Wong, and B.M. Rao, TQM and business
performance in the service sector: a Singapore study. Intenational
Journal of Operations and Production Management, 2000. 20(11): p. 1293-1312.
[19] Samat, N., T. Ramayah, and N.M. Saad, TQM practices, Service
Quality, and Market Orientation: Some empirical Evidence from a Developing Country. Management Research News, 2006. 29(11):
p. 713 – 728.
[20] Gupta, A., J.C. McDaniel, and S.K. Herath, Quality management
in service firms: sustaining structures of total quality service.
Managing Service Quality, 2005. 15(4): p. 389 - 402.
[21] Bon, A.T., E.M.A. Mustafa, and U.S. Rakiman. TOTAL QUALITY
MANAGEMENT PRACTICES IN SERVICE ORGANIZATIONS IN MALAYSIA: A REVIEW. in International Conference of Technology Management, Business and Entrepreneurship 2012 (ICTMBE2012). 2012. Malacca: Universiti Tun Hussein Onn
Malaysia
[22] UN, U.N., nternational Standard Industrial Classification of All
Economic Activities. 2008, United Nations publication: New York.
[23] Saunders, M., P. Lewis, and A. Thornhill, Research Methods for
Business Students. 5 ed. 2009, Harlow: Prentic Hall.
[24] Zikmund, W.G., Business Research Method. 8 ed. 2003, Cincinnati: Thomson South-Western
[25] Kim, D.-Y., V. Kumar, and U. Kumar, Relationship between
quality management practices and innovation. Journal of
Operations Management, 2012. 30(4): p. 295-315. [26] Leavengood, S. and T.R. Anderson. Best practices in quality
management for innovation performance. in Technology Management in the Energy Smart World (PICMET), 2011 Proceedings of PICMET '11:. 2011.
[27] Sadikoglu, E. and C. Zehir, Investigating the effects of innovation
and employee performance on the relationship between total quality management practices and firm performance: An empirical study of Turkish firms. International Journal of Production
Economics, 2010. 127(1): p. 13-26.
[28] Santos-Vijande, M.L. and L.I. Álvarez-González, Innovativeness
and organizational innovation in total quality oriented firms: The moderating role of market turbulence. Technovation, 2007. 27(9):
p. 514-532.
[29] Hair, J.F., et al., Multivariate Data Analysis with Readings. 4 ed. 1995, Englewood Cliffs, NJ: Prentice Hall.
[30] Marsh, H.W., K.T. Hau, and D. Grayson, Goodness of fit in
structural equation models, in Contemporary psychometrics, A.
Maydeu-Olivares and J.J. McArdle, Editors. 2005, Lawrence Erlbaum.: Mahwah, NJ. p. 275-340.
[31] Hair, J.F., et al., Multivariate Data Analysis: A Global Perspective. 7 ed. 2010, New Jersey: Pearson Education Inc.
[32] Byrne, B.M., Structural Equation Modeling with AMOS: Basic
Concepts, Applications, and Programming. 2 ed. 2010, New York:
Routledge.
[33] Kline, R.B., Principles and Practice of Structural Equation
Modelling. 2 ed. 2005, New York: The Guilford Press.
[34] Anderson, J.C. and D.W. Gerbing, Structural equation modeling in
practice: A review and recommended two-step approach.
Psychological Bulletin, 1988. 103(3): p. 411-423.
[35] 35. Awang, Z., Structural equation modeling using amos