Processing of Mixed Vegetable Juice from Tomato,
Cucumber and Pumpkin
Md. Rowshon Habib, Abdullah Iqbal
*Department of Food Technology & Rural Industries, Bangladesh Agricultural University, Mymensingh-2202, Bangladesh *Corresponding Author: [email protected]
Copyright © 2014 Horizon Research Publishing All rights reserved.
Abstract
The study was carried out for the preparation of good quality mixed vegetable juice from tomato, cucumber and pumpkin. Three formulations of different percentages of juices of each vegetable were used for the preparation of mixed juice. The products were then analyzed for their chemical analysis, statistical analysis, sensory evaluation, microbiological study and storage studies during 60 days storage period. Negligible change in chemical constituents except vitamin C was observed in the prepared mixed juice throughout the 60 days storage period. The major loss was found in case of vitamin C only. Gradual fading of color and off-flavor were observed during the storage time both at room and refrigeration temperature. The juice was spoiled after 30 days as it produced off-flavor and the color became fade in room temperature. Spoilage of juice was delayed at refrigeration temperature. The microbiological analysis during storage period showed that the total viable count (Bacteria) was less in sample 3 (containing 7% tomato pulp, 5% cucumber pulp, 9% pumpkin pulp and 13% sugar) in comparison to Samples 1 (containing 5% tomato pulp, 9% cucumber pulp, 7% pumpkin pulp and 11% sugar) and Sample 2 (containing 9% tomato pulp, 7% cucumber pulp, 5% pumpkin pulp and 12% sugar) both at room and refrigeration temperature. The prepared mixed juices were evaluated by a taste testing panel and it was found that no significant difference exists among the juice samples in respect of color and overall acceptability. However, considering flavor and texture, there were significant difference among the samples and sample 3 secured the highest score and was the most acceptable in flavor and texture in comparison to other samples and ranked as "like moderately".
Keywords
Vegetable Juice, Tomato, Cucumber, Pumpkin1. Introduction
Consuming fruits and vegetables promotes health, energy and quality of life. Fruit and vegetable juices have become
important in recent years due to overall increase in natural juice consumption as an alternative to the traditional caffeine containing beverages such as coffee, tea, or carbonated soft drinks. Juices are obtained from a single fruit or from different kinds of fruits and vegetables [1]. Fruit and vegetable juices improve significantly blood lipid profile in people affected by hyper-cholesterolemia as well as promote detoxification of human body [2]. Juices prepared from vegetable and fruits without added fats or sugars are relatively high in dietary fiber and low in calories, and reduce risk of many chronic diseases, including cardiovascular disease, certain types of cancer and type 2 diabetes etc [3,4] and common cancers [5,6]. Regular consumption of lycopene has been linked to decrease incidence of prostate cancer, lung cancer, digestive tract cancer and cardiovascular disease [7]
Tomato (Lycopersicon esculentum) is one of the most popular and demanding vegetables grown in Bangladesh. Ripe red tomatoes are rich in beta carotene and the anti-oxidant lycopene. Many studies have shown tomatoes inhibit cancer cells, and are effective against a wide range of cancers, help to blood purifying, prevent dangerous blood clots, cleans liver, and help to fight gallstones, reduce cholesterol, protect the skin from sunburn, and premature aging [8].
Cucumbers (Cucumis sativus L.) are extremely beneficial to health especially during the summers as it mostly contains water and many important nutrients that are essential for human body. In central Asia, people drink cucumber juice on warm days to help cool their body. Cucumber juice in the diet is one of the best favorable juices to improve and maintain healthy skin, nails and hair, weight loss, high blood pressure, acne, eczema, to dissolve kidney stone etc. Cucumbers are very high in water content and satisfy the appetite [9].
pressure, heart disease and lowers the cholesterol level [11]. Mixed vegetable juice is important for health to supply vitamins and minerals. Raw vegetable juice cannot be kept for long time for storage and is rotten quickly. Farmers cannot get suitable price at the time of harvest. Vegetable juice can be made attractive to people as a drink rather than only vegetable. Children love juice than raw vegetable. So, in a juice form it can be supplied to kids. The value of agricultural produce can be increased and preserved in processed form for longer period.
In Bangladesh, a huge amount of vegetables (18-34 %) are spoiled due to lack of suitable post harvest facility. If vegetables like tomato, cucumber and pumpkins may be converted into lucrative food product (e.g. juice), then they could be preserved for longer time. Also, many people and children who are not interested to eat vegetables, they may be attracted to take vegetable juice interestingly with the ultimate value addition to the agricultural products as well as the diversification of the uses of vegetables may be ensured. With the above considerations in mind, the current research has been conducted with following objectives:
To develop a formula and process for the production of mixed vegetable juice from tomato, cucumber and pumpkins;
To assess the overall acceptability of the formulated mixed juices; and
To observe the keeping quality and shelf life of the juices.
2. Materials and Methods
The research has been conducted in the laboratory of the Department of Food Technology and Rural Industries (DFTRI), Bangladesh Agricultural University (BAU), Mymensingh, Bangladesh. Fresh vegetables (tomato, cucumber and pumpkin of local varieties) and other raw
materials were collected from local market. The glass bottles and other chemicals such as citric acid, carboxy methylcellulose (CMC), potassium metabisulphite (KMS), sugar and other materials were used from the laboratory stock of the DFTRI, BAU, and/or collected from local market. The glass bottles were used in the bottling of juice.
2.1. Preparation, Formulations and Processing of Mixed Vegetable Juice
Fresh vegetables (tomato, cucumber and pumpkin) were collected and washed with potable water and cleaned properly. Then cucumber and pumpkins were peeled and seeds were removed from the pumpkin. The vegetables were then sliced/chopped (as shown in Figure 1) and blended separately in the electrical blender. The juice was then obtained after filtering. Then each three types of juice were heated separately (750C) for 2-3 minutes, and cooled down at
room temperature. The mixed vegetable juices were then prepared as per the formulation given in Table 1.
[image:2.595.110.502.507.728.2]The stated amount of sugar, citric acid, thickening agent and water (shown in Table 1) were mixed properly. The mixture was then boiled for about 3 to 5 min to prepare the syrup. The prepared syrup was filtered through cheese cloth and then cooled. The prepared juices of individual vegetables were weighed and mixed (as per Table 1) and KMS were then mixed with syrup and then homogenized the whole mixture using a pressure homogenizer (50 bar) for about 5 to 10 min to obtain the ready to serve mixed vegetable juice. The prepared juices were packed into sterilized bottles through sterilized funnels keeping head space about 2 cm. The bottles were then capped and sealed tightly and stored both at room temperature and refrigeration temperature.
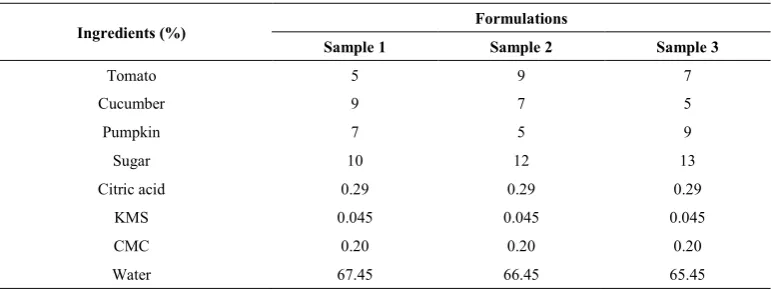
Table 1. Formulations of mixed vegetable juice for different treatments
Ingredients (%) Formulations
Sample 1 Sample 2 Sample 3
Tomato 5 9 7
Cucumber 9 7 5
Pumpkin 7 5 9
Sugar 10 12 13
Citric acid 0.29 0.29 0.29
KMS 0.045 0.045 0.045
CMC 0.20 0.20 0.20
Water 67.45 66.45 65.45
2.2. Chemical Analysis
Moisture content, ash content, titratable acidity was determined adopting standard methods [12]. Vitamin C content was determined following the method of Ranganna [13]. Total soluble solid (TSS) was determined by using Abbe Refractometer (Model no. 8987 Puji Kuki Ltd. Tokyo, Japan).
2.3 Statistical Analysis
All the above determinations were carried out in triplicate and average values as well as standard deviations were reported. Mean separations were analyzed using the ANOVA and Fisher's least significant difference (LSD) procedure at α = 0.05 using statistical software [32].
2.4. Sensory Evaluation
The consumer's acceptability of developed mixed vegetable juices was evaluated by a taste tasting panel selected randomly from teachers and students of the department. Each juice samples were served to the panelists and were asked to assign appropriate score for characteristics color, flavor, texture and overall acceptability of processed vegetable juice on a 1-9 point Hedonic scale where, 1 = dislike extremely, 2 = dislike very much, 3 = dislike moderately, 4 = dislike slightly, 5 = neither like nor dislike, 6 = like slightly, 7 = like moderately, 8 = like very much, 9 = like extremely. The results were analyzed using the software package STATISTICA 8.0 [14].
2.5. Microbiological Examination
For total viable count of microorganism present in mixed vegetable juice, standard plate count (SPC) method was conducted as per the method described by Ranganna [13].
2.6. Storage Studies
The developed mixed vegetable juices were stored at room temperature (28-30°C) and at refrigeration temperature (4°C)
for 60 days. The samples were analyzed for their chemical
composition, microbial load and sensory attributes at an interval of 15 days during the whole storage period. Off flavor, discoloration, syneresis or any spot of the sample was recorded for each treatment.
3. Results and Discussion
The experiment was conducted to determine the effective means of formulation, processing and preservation of mixed vegetable juice from tomato, cucumber and pumpkin. Vegetable juice was studied for their acceptability and shelf life at room temperature (28-30°C) and at refrigeration temperature (4°C). The acceptability and shelf life were evaluated through organoleptic taste testing procedure along with chemical and microbiological analysis.
3.1. Chemical Analysis of fresh vegetables
The fresh pumpkin (ripe) pulp contains 90.5 % moisture, 0.5 % Ash, 0.38% acidity, 4.2% TSS, and Vitamin C 9 mg/100g. The moisture and ash content obtained by Kim et al. [23] is comparable with this finding which reported in the range from 84% to 96% moisture content and 0.34% to 1.05% ash content depending on the variety of pumpkins. The difference could be due to variation in starch content of the genotype of the pumpkin fruit [24].
TSS content was obtained in this study (4.2%) was comparable with Sudhakar et al. [25] and Zinash et al [26] who showed large variation in the TSS content of pumpkin cultivar that also varied from year to year and the variation ranges from 4.1% to 10%. Alibas [27] also reported the TSS range between 7% to 10% which supports the findings of this study. Vitamin C content was found to be within the range (4.81 to 9.1 mg/g) reported by Zinash et al [26]. Sudhakar et al. [25] also indicated analogous result and concluded that vitamin C content of pumpkin vary from cultivar to cultivar as well as time at/after harvest.
The fresh cucumber contains 96.3 % moisture, 0.3 % Ash, 0.28 acidity, 2.8% TSS and Vitamin C 2.9 mg/100g which was similar to the findings reported for fresh cucumber ( 95.1% moisture, 0.42% ash, 0.20% acidity and vitamin C 10 mg/100g ) obtained by Iqbal and Islam [28]. The small variation may be due to varietal difference, stage of maturity, climatic condition and types of fertilizer used during cultivation etc.
3.2. Chemical Analysis of Mixed Juice
The prepared mixed juices were tested for chemical composition (shown in Table 2) immediate after preparation. The moisture content of all the samples of mixed juices ranges from 86.27 to 89.34%. The highest amount of moisture content was in Sample 1 other than two samples due to the use of higher amount of cucumber (9%) with higher amount of moisture and lower amount of tomato (5%) and pumpkin (7%) pulp. This result is close to carrot juice
(86.32% moisture) obtained by Jannaty [30] where 7% carrot pulp, 15% sugar and 0.25% citric acid was used. The similar result was obtained by Gabrovská et al., [29] who reported 89% to 96% moisture in mixed juices prepared from different vegetables.
In case of ash, Sample 3 contained higher amount (0.32%) ash than sample 1 and Sample 2 because of using higher amount of tomato (7%) and pumpkin (9%) pulp and less amount of cucumber (5%) pulp. As from composition of fresh tomato and pumpkin it is seen that these two vegetables contain higher amount of ash than cucumber and that is why sample 1 contained less amount of ash. This result is comparable to carrot juice (0.33% ash) obtained by Jannaty [30] using 9% carrot pulp, 13% sugar and 0.25% citric acid.
From Table 2 it is seen that the highest amount of TSS was in Sample 3 because of using higher amount of sugar (13%). Sample 1 contained lower amount of TSS using (10%) sugar. This result is close to carrot juice (11% TSS) obtained by Jannaty [30] using 7% carrot pulp, 12% sugar and 0.25% citric acid.
[image:4.595.107.505.569.684.2]In case of acidity, the highest amount of acidity (0.42%) was found in Sample 2 because of using higher amount of tomato (9%) pulp as tomato contains higher amount of acidity than pumpkin and cucumber. This result is close to carrot juice (0.36% acidity) obtained by Jannaty [30] where 7% carrot pulp, 13% sugar and 0.25% citric acid was used. It is seen that Sample 2 contained the highest amount of vitamin C (3.33mg/100g) due to the use of higher amount of tomato (9%) pulp. As tomato contains higher amount of vitamin C than pumpkin and cucumber and sample 1 contained the lowest amount of vitamin C (2.99mg/100g). This result is comparable to vitamin C of carrot juice (3.2mg/100g) obtained by Jannaty [30] using 7% carrot juice, 13% sugar and 0.25% citric acid. The result is within the range which have been obtained by Gabrovská et al., [29] who reported 0.1 to 4.4 mg/100 g of vitamin C in mixed juices prepared from different vegetables.
Table 2. Chemical composition of mixed vegetable juice
Samples
Parameters (immediate after preparation, i.e., 0th day)
Moisture (%) Ash (%) TSS (%) Acidity (%) (mg/100 g) Vitamin C
Sample 1 89.34(0.76)a* 0.26(.01)c* 10(0.5)b* 0.36(.01)c* 2.99(0.18)b*
Sample 2 87.26(0.56)b 0.29(.01)b 12(1.0)a 0.42(.01)a 3.33(0.10)a
Sample 3 86.27(1.07)b 0.32(.01)a 13(1.0)a 0.38(.01)b 3.11(0.09)ab
Where, Sample 1 =5% tomato pulp, 9% cucumber pulp, 7% pumpkin pulp & 11% sugar; Sample2=9% tomato pulp, 7% cucumber pulp, 5% pumpkin pulp & 12% sugar; Sample3=7% tomato pulp, 5% cucumber pulp, 9% pumpkin pulp & 13% sugar
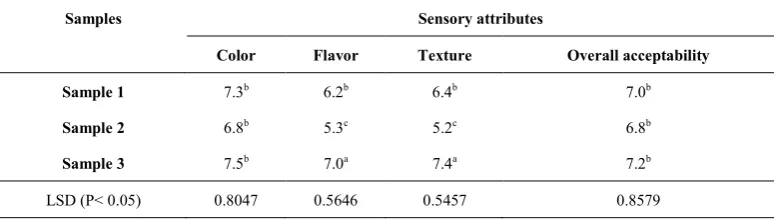
Table 3. Mean score for taste, color, flavor, texture and overall acceptability mixed vegetable juice
Samples Sensory attributes
Color Flavor Texture Overall acceptability
Sample 1 7.3b 6.2b 6.4b 7.0b
Sample 2 6.8b 5.3c 5.2c 6.8b
Sample 3 7.5b 7.0a 7.4a 7.2b
LSD (P< 0.05) 0.8047 0.5646 0.5457 0.8579
3.3. Statistical Significance Test
Statistical significant difference was observed (shown in Table 2) among three samples processed with different formulations. While considering moisture content, it is seen that there is no significant difference between Sample 2 and sample 3 because of containing 87.26% and 86.27% moisture, respectively. On the other hand, sample1 (89.34% moisture) is significantly different from other two samples. This may be due to the use of higher amount of cucumber in sample S1 and vice versa.
In the case of ash content, there is significant difference among the samples. It is observed that Sample 3 contained the highest amount of ash (0.32%) and sample 1 contained the lowest amount of ash (0.26%). This result may be due to using higher amount of pumpkin and tomato in Sample (as the pumpkin and tomato contains higher amount of ash than cucumber) and sample 1 contained less amount of pumpkin and tomato. The small variation in moisture content and ash content of different samples may be due to technical error in measuring procedure.
It is observed that there is no significant difference between Sample 2 (12% TSS) and Sample 3 (13% TSS) while considering TSS. But Sample 1 (10% TSS) differs significantly from the other two samples from view point of total soluble solids. This result may be due to using higher amount of sugar and lower amount of cucumber in sample 3 and lower amount of sugar and higher amount of cucumber in sample 1.
In the case of acidity, there is significant difference among the samples. The highest amount of acidity (0.42%) is observed in Sample 2 because of using higher amount of tomato (9%) pulp (as tomato contains high amount of acidity other than pumpkin and cucumber) and sample 1 contained lower amount of acidity (0.36%) due to using lower amount of tomato (5%) pulp.
It is seen that significant difference exists among the samples. Sample 2 contained the highest amount of vitamin C (3.33mg/100g) due to the use of higher amount of tomato (9%) pulp (as tomato contains higher amount of vitamin C than pumpkin and cucumber) and sample 1 contained the lowest amount of vitamin C (2.99mg/100g) due to the use of lower amount of tomato (5%) pulp. This difference also may be responsible for the presence of oxygen as vitamin C breaks down in the process of oxygen in an oxidation
reaction.
From the statistical analysis it may be concluded that sample 3 is better than other sample due to its formulation which has 7% tomato pulp, 5% cucumber pulp, 9% pumpkin pulp and 13% sugar. Considering all parameters (moisture, ash, TSS, acidity and vitamin C) Sample 3 is the best and that is why, sample 3 supposed to have more acceptability by the consumer than other two samples.
3.4. Sensory Evaluation
The processed vegetable juice was evaluated for its color, flavor, texture and overall acceptability through a taste testing panel consists of 10 untrained panelists. The panelists were briefed about the sample and then asked to score the sample in ascending order of 1-9 points showing their degree of preference in respect of color, flavor, texture and overall acceptability of the juice sample. The responses were tabulated in Table 3.
It is observed from Table 3 that for texture and flavor of samples there are significant differences among the samples at 5% level of significance and indicates that sample 3 is the best one and ranked as "like moderately". Although, from view point of colour and overall acceptability there is no significant differences among the samples, sample 3 secured highest score and ranked as "like moderately".
From the statistical and sensory analysis it is clear that sample 3 (havng 7% tomato pulp, 5% cucumber pulp, 9% pumpkin pulp and 13% sugar) is the best among the samples with respect to all the attributes (color, flavor, texture and overall acceptability).
3.5. Microbiological Examination
bacteria count in juices from three samples have been shown in Table 4. The result showed that among the three sample, sample 3 contained least viable bacteria (4.54 log. cfu/ml) and sample 2 contained highest viable bacteria (4.88 log. cfu/ml) after 60 days at room temperature.
From the above results, it is clear that the total viable bacteria count increased with the increase of storage period. The samples which were kept in refrigeration temperature (4°C) contained less viable bacteria than those samples
which were kept in room temperature (28-30°C).
[image:6.595.92.518.216.496.2]Acidic juices (pH 4.6 or less) may contains enteric bacterial pathogens such as E. coli, various Salmonella species, and the protozoan parasite Cryptosporidium parvum, Listeria monocytogenes etc. In low acid juices (pH greater than 4.6), which are distributed even under refrigeration condition may produce toxins by non-proteolytic and proteolytic strains of Clostridium botulinum.
Table 4. Growth of viable bacteria in mixed vegetable juice samples at room and refrigeration temperature.
Storage
condition Storage period (days) Sample No. No. of colony
No. of total viable bacteria (cfu/ml)
Total count (log. cfu/ml)
Room Temperature (4°C)
Sample-1 4 4 x 10³ 3.60
7 Sample-2 6 6 x 10³ 3.77
Sample-3 2 2 x 10³ 3.30
30
Sample-1 11 11 x 103 4.04
Sample-2 15 15 x 103 4.17
Sample-3 5 5 x 10³ 3.69
60
Sample-1 61 61 x 103 4.78
Sample-2 76 76 x 103 4.88
Sample-3 35 35 x 103 4.54
Refrigeration Temperature (28-30°C)
7
Sample-1 3 3 x 10³ 3.47
Sample-2 4 4 x 10³ 3.60
Sample-3 1 1 x 10³ 3.00
Sample-1 6 6 x 10³ 3.78
30 Sample-2 10 10 x103 4.00
Sample-3 3 3 x 10³
3.47
Sample-1 38 38 x 103 4.58
60 Sample-2 68 68 x 103 4.83
Sample-3 24 24 x 103 4.38
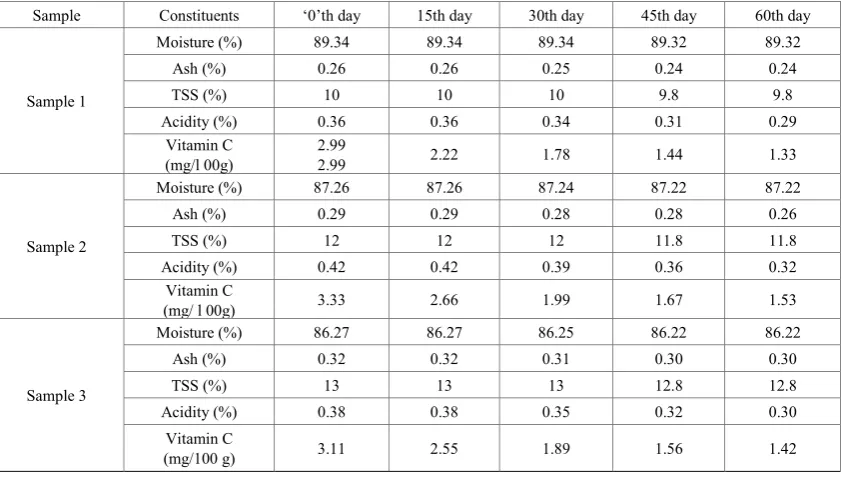
Table 5. Chemical composition of mixed vegetable juice at various storage periods
Sample Constituents ‘0’th day 15th day 30th day 45th day 60th day
Sample 1
Moisture (%) 89.34 89.34 89.34 89.32 89.32
Ash (%) 0.26 0.26 0.25 0.24 0.24
TSS (%) 10 10 10 9.8 9.8
Acidity (%) 0.36 0.36 0.34 0.31 0.29
Vitamin C
(mg/l 00g) 2.99 2.99 2.22 1.78 1.44 1.33
Sample 2
Moisture (%) 87.26 87.26 87.24 87.22 87.22
Ash (%) 0.29 0.29 0.28 0.28 0.26
TSS (%) 12 12 12 11.8 11.8
Acidity (%) 0.42 0.42 0.39 0.36 0.32
Vitamin C
(mg/ l 00g) 3.33 2.66 1.99 1.67 1.53
Sample 3
Moisture (%) 86.27 86.27 86.25 86.22 86.22
Ash (%) 0.32 0.32 0.31 0.30 0.30
TSS (%) 13 13 13 12.8 12.8
Acidity (%) 0.38 0.38 0.35 0.32 0.30
Vitamin C
[image:6.595.97.518.516.755.2]Figure 2. Vitamin C loss during storage period
3.6. Storage Studies
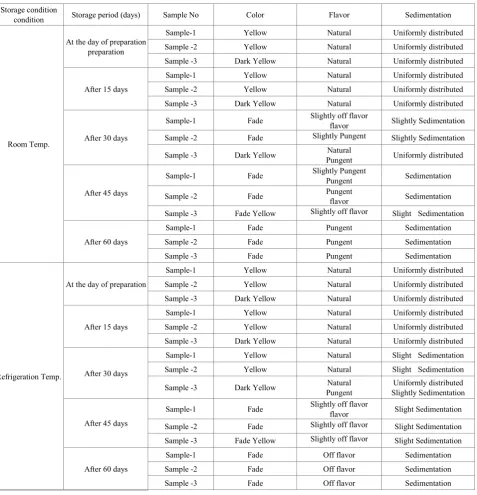
Prepared vegetable juices were packed in bottles and the bottles were stored in a shelf at room temperature and at refrigeration temperature for 2 months. The juices were analyzed for its various chemical components and organoleptic observations were judged on the basis of color, flavor, and sedimentation (Table 5 and Table 6).
From Table 5 it is seen that the moisture content is slightly reduced during storage period. For Sample 1 moisture content was 89.34 % at the day of preparation and 89.32 % at the 60th day. For Sample 2 and Sample 3 moisture content
was 87.26 % and 86.27 % at the first day and 87.22 % and 86.22 % at the last day of storage period, respectively.
In case of ash it was observed that for Sample 1, Sample 2 and Sample 3 ash contained 0.26 %, 0.29 % and 0.32 % respectively at the day of preparation. After 60 days ash content of Sample 1, sample 2 and Sample 3 were 0.24 %, 0.26 % and 0.30 %, respectively. The small variation of moisture content and ash of different sample may be due to technical error in measuring procedure.
Also it was found that Total soluble solids (TSS) slightly decreased with the increase of storage period. This result may be due to fermentation of sugar present in the juice. Acidity also decreased slightly with the increasing of storage period for vegetable juices from three samples. For Sample 1 the TSS was 10 % at the day of preparation and 9.8 % at the 60th day. For Sample 2 and Sample 3 the TSS was 12 % and 13% at the first day and 11.8% and 12.8 % respectively at the last day of storage period.
In case of acidity it was observed that for Sample 1 the acidity was 0.36% at the day of preparation and 0.29 % at the 60th day. For Sample 2 and Sample 3 the acidity was 0.42 % and 0.38 % at the first day and 0.32% and 0.30% respectively at the last day of storage period.
From Table 5 it shows that vitamin C lost reasonably during the storage period. It is observed that Sample 1
contained vitamin C (2.99 mg/100 g) on the day of preparation and 1.33 mg /100 g after 60 day. Similarly, vitamin C content of Sample 2 and Sample 3 was 3.33 mg/100g and 3.11mg/l00 g respectively on the day of preparation. After 60 days vitamin C content had reduced to 1.53 mg/100g and 1.42 mg/110g in Sample 2 and Sample 3 respectively. It was found that degradation of vitamin C was less in juice from Sample 3 than sample 1 and sample 2. The vitamin C degradation of mixed juice samples during storage period has been shown in Figure 2.
In the Figure 2, it is seen that the loss of vitamin C increased with the increase of storage period. Vitamin C is a sensitive molecule that is altered in the presence of heat. Moreover, blanching and freezing operation are also responsible for degradation of vitamin C. The concentration of vitamin C follows first order kinetics and thus storage time affects vitamin content [31]. However, Vitamin C is an organic molecule known as ascorbic acid. Ascorbic acid reacts chemically with indophenol, an indigo indicator, resulting in the bleaching of the dark color. Ascorbic acid breaks down in the presence of oxygen in an oxidation reaction and the rate of oxidation increased with the increase of storage period.
The Organoleptic observations during the storage period have been shown in Table 6 and it is seen that there is a slight variation in color among the three samples during 60 days storage period. Color was found yellow/dark yellow/reddish on the day of preparation. The color faded and flavor deteriorated gradually with the increase of storage period both at room and refrigeration temperature.
Table 6. Organoleptic observation of prepared juice from three Samples at different storage condition
.
Storage conditioncondition Storage period (days) Sample No Color Flavor Sedimentation
Room Temp.
At the day of preparation preparation
Sample-1 Yellow Natural Uniformly distributed Sample -2 Yellow Natural Uniformly distributed Sample -3 Dark Yellow Natural Uniformly distributed
After 15 days
Sample-1 Yellow Natural Uniformly distributed Sample -2 Yellow Natural Uniformly distributed Sample -3 Dark Yellow Natural Uniformly distributed
After 30 days
Sample-1 Fade Slightly off flavor flavor Slightly Sedimentation Sample -2 Fade Slightly Pungent Slightly Sedimentation Sample -3 Dark Yellow Pungent Natural Uniformly distributed
After 45 days
Sample-1 Fade Slightly Pungent Pungent Sedimentation
Sample -2 Fade Pungent flavor Sedimentation Sample -3 Fade Yellow Slightly off flavor Slight Sedimentation
After 60 days
Sample-1 Fade Pungent Sedimentation
Sample -2 Fade Pungent Sedimentation
Sample -3 Fade Pungent Sedimentation
Refrigeration Temp.
At the day of preparation
Sample-1 Yellow Natural Uniformly distributed Sample -2 Yellow Natural Uniformly distributed Sample -3 Dark Yellow Natural Uniformly distributed
After 15 days
Sample-1 Yellow Natural Uniformly distributed Sample -2 Yellow Natural Uniformly distributed Sample -3 Dark Yellow Natural Uniformly distributed
After 30 days
Sample-1 Yellow Natural Slight Sedimentation Sample -2 Yellow Natural Slight Sedimentation
Sample -3 Dark Yellow Pungent Natural Slightly Sedimentation Uniformly distributed
After 45 days
Sample-1 Fade Slightly off flavor flavor Slight Sedimentation Sample -2 Fade Slightly off flavor Slight Sedimentation Sample -3 Fade Yellow Slightly off flavor Slight Sedimentation
After 60 days
Sample-1 Fade Off flavor Sedimentation Sample -2 Fade Off flavor Sedimentation Sample -3 Fade Off flavor Sedimentation
4. Conclusions
The study was carried out to develop a suitable formula for the preparation of vegetable juice. As a large amount vegetable is spoiled during peak season due to inadequate processing and preservation facilities, it was of interest to discover the possibilities of processing of mixed vegetable juices from the mixture of tomato, cucumber, and pumpkin. This study indicates that vegetable mixed juice can be produced from the locally grown as well as surplus vegetables with the ultimate value addition to the agricultural products as well as to ensure better nutrition to the people of the country.
REFERENCES
[1] Tombak M. Start Healthy Life. 2nd ed. Healthy life press inc. Korea, 2000.
[2] M.M. Deanna, S. B. Jeffrey. Acid-alkaline Balance: Role in Chronic Disease and Detoxification. Alternative therapy, Vol. 13, No.4, 62-65, 2007.
[image:8.595.70.548.89.585.2]Nutrition Examination Survey. The American Journal of Clinical Nutrition, Vol. 78, 1120-1127, 2003.
[4] L.A. Bazzano , M.K. Serdula, S. Liu. Dietary intakes of F&V aid risk of cardiovascular disease. Curr Atheroscler Rep 5, 492-499, 2002.
[5] N.J. Temple, K.K. Gladwin. Fruit vegetables and the prevention of cancer: research challenges. Nutrition, Vol. 19, No.5, 467-70, 2003.
[6] H-C. Hung, K. J. Joshipura, R. Jiang, F. B. Hu, D. Hunter, S. A. Smith-Warner, G. A. Colditz, B. Rosner, D. Spiegelman, W. C. Willett. Fruit and Vegetable Intake and Risk of Major Chronic Disease. JNCI J Natl Cancer Inst, Vol. 96, No. 21, 1577-1584, 2004.
[7] J. O. Kuti, H. B. Konuru. Effects of genotype and cultivation environment on lycopene content in red-ripe tomatoes. J. Sci. Food. Agric. Vol. 85, 2021–2026, 2005.
[8] L. Mogren. Quercetin content in yellow onion (Allium cepa L.): Effects of cultivation methods, curing and storage, Doctoral dissertation. 2006.
[9] C. Calbom, M. Keane. Juicing for life. 4th ed. Avery Publishing Group, NY. 46-49, 1992.
[10] J.S. Weinstein, T.M. Vogt, S.A. Gerrior. Healthy eating index scores are associated with blood nutrient concentrations in the third National Health and Nutrition Examination Survey. Journal of the American Dietetic Association, Vol. 104, No. 4, 576-584, 2004.
[11] N.N. Saha. Fruit and Vegetable Juice Therapy, concentrates during storage. J. Food. Engineering, B. Jain publishers Pvt. Ltd, Vol. 74, 211-216, 2004.
[12] AOAC. Official Methods of Analysis of the Association of official Analytical Chemist. 19th Ed. Washington D.C., 2005.
[13] S. Ranganna. Handbook of Analysis of quality control for fruit and vegetable products. 2ndedition, Tata Me GrawHill
pub. Co. Ltd. New Delhi, 2004.
[14] StatSoft, Inc. Electronic Statistics Textbook. Tulsa, OK: StatSoft. Online available from http://www.statsoft.com/text book, Accessed May, 2013.
[15] B. W. Li, K. W. Andrews, P. R. Pehrsson. Individual sugars, soluble, and insoluble dietary fiber contents of 70 high consumption foods. Journal of Food Composition and Analysis, 15, 715–723, 2002.
[16] O. Moreiras, A. Carvajal, L. Cabrera, C. Cuadrado. Tablas de composicio´n de alimentos. Madrid: Pira´mide, 2005. [17] R. O. Anta, A. L. Sobaler, A. R. Marcos, P. Carvajales. La
composicio´ n de los alimentos. Madrid: Complutense, 2004. [18] M. Oke, T. Ahn, A. Schofield, G. Paliyath. Effectes of
phosphorus fertilizer supplementation on processing quality and functional food ingredients in tomato. Journal of Agricultural and Food Chemistry, Vol. 53, 1531–1538, 2005. [19] R. Ilahy, C. Hdider, M.S. Lenucci, I. Tlili, G. Dalessandro. Phytochemical composition and antioxidant activity of high-lycopene tomato (Solanum lycopersicum L.) cultivars grown in Southern Italy. Scientia Horticulturae, Vol. 127,
255-261, 2011.
[20] P. Juroszek, H.M. Lumpkin, R.Y. Yang, D.R. Ledesma, C.-H. Ma. Fruit quality and bioactive compounds with antioxidant activity of tomatoes grown on-farm: comparison of organic and conventional management systems. J. Agric. Food Chem.Vol. 57, 1188–1194, 2009.
[21] S. M. Herna´ndez, Rodrı´guez, E. R., C. Dı´az Romero, Analysis of organic acid content in cultivars of tomato harvested in Tenerife. European Food Research and Technology, 2007b. doi:10.1007/s00217-006-0553-0. [22] G.E. Anthon, M. LeStrange, D. M. Barrett. Changes in pH,
acids, sugars and other quality parameters during extended vine holding of ripe processing tomatoes. J Sci Food Agric. 2011. DOI 10.1002/jsfa.4312.
[23] M. Y. Kim, E.J. Kim, Y-N. Kim, C. Choi, B-H. Lee. Comparison of the chemical compositions and nutritive values of various Pumpkin (Cucurbitaceae) species and parts. Nutrition Research and Practice (Nutr Res Pract). Vol. 6, No.1, 21-27, 2012.
http://dx.doi.org/10.4162/nrp.2012.6.1.21).
[24] R. Hazzard. Pumpkin crop. Vegetable Notes for Vegetable Farmers in Massachusetts, Vol. 17, No.20, 20-32, 2006. [25] P.S., Sudhakar, A.K. Jagdish, D.R. Upadhyay, R. Mathura.
Ascorbate and carotenoid content in an Indian collection of pumpkin (Cucurbita moschata Duch. ex Poir). Cucurbit Genetics Cooperative Report. Indian Institute of Vegetable Research, Gandhi Nagar, Naria, India, 2003.
[26] A. Zinash, T.S. Workneh, K. Woldetsadik. Effect of accessions on the chemical quality of fresh pumpkin. African Journal of Biotechnology. Vol. 12, No.51, 7092-7098, 2013. DOI: 10.5897/AJB10.1751.
[27] I. Alibas. Microwave, air and combinedmicrowave-air-dryin g parameters of pumpkin slices. LWT, Vol. 40, No.8, 1445-1451, 2007.
[28] A. Iqbal, M.N. Islam. Dehydration kinetics of cauliflower and cucumber. Bangladesh J. of crop Sci. Vol. 16, No. 1, 113-122, 2005.
[29] D. Gabrovská, J. Ouhrabková, J. Rysová, M. Holasová, V. Fiedlerová, I. Laknerová, R. Winterová, E. Eichlerová, V. Erban, , J. Strohalm, I. Němečková, M. Houška. Mixed Vegetable Juices Acidified with Sauerkraut Juice and Preserved using High Pressure or Heat Pasteurisation Treatments – Nutritional and Sensory Evaluation. Czech J. Food Sci., Vol. 32, No. 2, 182–187 2014.
[30] R. Jannaty. Processing and Preservation of Carrot Juice, MS Thesis, Department of Food Technology and Rural Industries, Bangladesh Agricultural University, Mymensingh,Banglades h, 2010.
[31] D.R. Heldman