Steven
C.Scardaci
Michael
C.Shannon
Stephen
R.Grattan
Austine
U. Eke
Stacey R. Roberts
5 .
Goldman-Smith
James E. Hill
Water management practices in
California rice production can affect
salinity in the field. This is
particularly important because rice
is one of the most sensitive crops to
salinity. We extensively monitored
salinity patterns in dozens of rice
fields in Colusa and Glenn counties,
in order to determine how salinity
varies from basin to basin and to
compare salinity patterns under
different irrigation systems. We
found that the fields most
vulnerable to salinity damage were
those with higher soil salinity and
using irrigation water sources
initially high in salinity, particularly
nondistrict sources that are
combinations of well and drain
water. Long water holding periods,
while effective in reducing pesticide
concentrations in rice fields, can
contribute to salinity increases in
bottom basins. Salinity can increase
with either conventional or static
irrigation management systems, but
the salinity pattern in the field will
be different.
ore than 470,000 acres of rice were planted in California in 2001, with a production value of $138 million (according to the Califor- nia Agricultural Statistics Service). Rice is different from the state’s other im- portant field crops in that it is grown in basins under continuously flooded con- ditions. Rice has a unique anatomical
grown in a series of basins, with water running from upper to lower basins before draining out. The authors found that salinity stress and yield reductions tend to increase from upper basins, above, t o bottom basins, betow.
feature called aevenchyma (large internal air spaces), which provide oxygen to roots, allowing the plant to thrive un- der flooded conditions. Most weed spe- cies cannot survive in this environment. Unlike other crops, rice is seeded di- rectly into saturated fields by aircraft, providing a uniform stand. Historically, most rice has been grown using a con- ventional ”flow-through” system where irrigation water flows sequentially through a series of basins starting at the top and ending at the bottom. Weirs be- tween basins control water depth and flow, and excess water in the bottom ba- sin spills into a drainage ditch.
fornia rice production have changed substantially since the 1970s and early 1980s, when water was held in the field for short periods of several days. In the early 1970s, water quality studies in California indicated that the salinity of rice-field outflows averaged about 30% higher than inflow water in 14 fields (Henderson et al. 1974). In five fields from Colusa and Glenn counties, the salinity of outflow water averaged
Water management practices in Cali-
about 60% more than inflow water. By the early 1990s, rice growers were hold- ing water in basins for up to 30 days (May to early June) after a pesticide ap- plication (Lee et al. 1993). These hold- ing periods were the primary means of reducing pesticide residues and were required by the state Department of Pesticide Regulation to fulfill the Cen- tral Valley Regional Water Quality Control Plan. Rice growers adopted closed systems, which recirculate water within basins, or constructed static wa- ter basins, in which water flows into a single basin without an outflow. They also developed gravity systems, in which drainage water from the bottom basin bypasses the drain by redirecting it to the top basin of another series of lower-elevation basins.
During the late 1980s and early 1990s California experienced a long- term drought, resulting in further tail- water outflow restrictions and a no-spill policy, which prohibited the discharge of field water from bottom basins into waterways after June 30 or July 15 (1992 to 1994) in some rice-
growing areas. In the early 1990s some rice growers noticed problems with stand establishment in parts of their fields. They suggested that salinity problems might develop with the longer water holding periods and/or in closed irrigation systems. The late- season no-spill policy was discontinued in 1995, and other less restrictive modi- fications have been made since.
larly during the early seedling (Maas 1990) and pollination stages (Khatun and Flowers 1995). Salinity stress dur- ing these periods may reduce rice growth and/or yield. In rice, salinity during the seedling stage causes a re- duction in stand density and seedling biomass (Shannon et al. 1998). During pollination salinity may cause panicle blanking (sterile florets) or sterility, leading to a reduction in grain yield. Rice is more tolerant of salinity at other growth stages, and salinity stress dur- ing these periods has less impact on yield (see Grattan et al.,
p.
189).We initiated salinity investigations in the early 1990s to determine if salin- ity was adversely affecting rice produc- tion in California and to determine impacts on yield. Different irrigation systems that limit the discharge of field water into waterways were monitored to evaluate the distribution of salinity within particular fields.
Irrigation water salinity
nondistrict water sources in Colusa and Glenn counties were monitored for sa- linity in June, July and August from 1993 through 1995. District water comes directly from an irrigation agency such as the Glenn-Colusa Irriga- tion District, while nondistrict water provides a mix of river water, well wa- ter and/or recaptured drain water. Data indicated that most irrigation wa- ters had low mean summertime salin- ity levels. For example, the electrical conductivity of the inflow water (ECJ - which goes u p as water salinity increases - was less than 0.7 deciSiemens/meter (dS/m), but some sources had moderate levels of 0.7 to 1.47 dS/m (fig. 1). (DeciSiemens per meter is a measure of the electrical Rice is sensitive to salinity, particu-
Thirteen irrigation district and
Irrigation water sources
Fig. 1. Electrical conductivity among district (D) and nondistrict (ND) irrigation water sources in Glenn and Colusa counties. (Readers may e-mail srgrattonOucdavis.edu for identities of district and nondistrict irrigation water sources.)
conductance of the water supply, which is related to its saltiness.)
Irrigation districts that divert water from the Sacramento River had the lowest mean summertime salinity lev- els (0.13 to 0.31 dS/m). Other district and nondistrict sources had low but slightly higher mean summertime sa- linity levels (0.40 to 0.54 dS/m). Nondistrict water sources that used a mixture of drain and well water had higher mean salinity levels (0.62 to 1.47 dS/m). Drain water from nonrice field sources may have also affected water quality at some sites.
The mean summertime ECw for all irrigation water sources was highest in 1994 and lowest in 1993 and 1995. For example, the mean salinity level in the Colusa Basin Drain at the Davis Weir was 1.22 dS/m in 1994, but only 0.73 and 0.75 dS/m in 1993 and 1995, re- spectively. The higher salinity levels in 1994 (compared to 1995) can likely be attributed to higher cumulative evapo- transpiration (ET) and lower rainfall during the summer (June to August) months, in addition to stricter water conservation practices.
Field salinity monitoring
We also monitored 27 rice fields that used conventional, recirculating and gravity irrigation systems for salinity in Colusa and Glenn counties, annually from 1993 to 1995. Management of
these fields varied considerably, as has been previously described (Hill et al. 1995). Salinity of the water was moni- tored at the inlet, top and bottom ba- sins of each field in June, July and August. The June sample time was during or close to the water holding period in many of the fields studied. Soil salinity was also monitored in these fields at the same times but was not initiated until midway through the 1993 season. Some fields utilized recirculating, gravity or static systems to manage water during the water holding period while others held wa- ter for the required holding period or season-long. Yield data was collected in 1994 and 1995 from 3.3-feet-by-3.3- feet (1 square meter) plots near the sa- linity monitoring locations in each of the top and bottom basins.
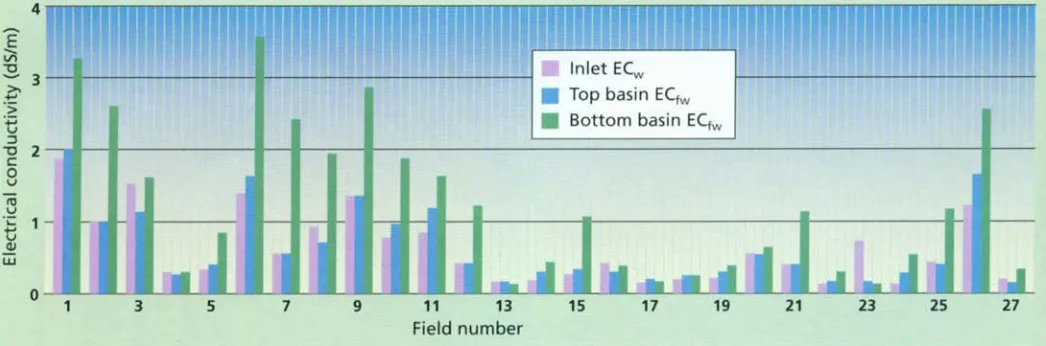
Mean bottom-basin water salinity levels were significantly higher than those in top basins, while EC of the in- let water was often the same as EC of the field water (ECJ in the top basin (fig. 2). Fields with low ECfw levels showed little difference between top and bottom basins.
the water salinity levels were higher and the differences between the top and bottom basins were greater during or after the water holding period. The salinity level and relative differences between top and bottom basins de-
Data for June is presented because
[image:2.594.223.566.42.273.2]Fig. 2. Electrical conductivity of water at field inlet (EC,) and in field water (EC,,) in top and bottom basins from 27 rice fields in Colusa and Glenn counties, June 1995.
clined later in the season after water flow and depths increased. Similar re- sults were observed with soil EC (data not shown). From 1993 through 1995, the mean EC,%, for June was 0.70 dS/m in the top basins and 1.28 dS/m in the bottom basins of all fields monitored. Similar patterns were found in 1994. In fields with higher salinity levels, rice stand establishment was affected more in bottom basins than top basins.
In 1994, during the June sample, field water and soil salinity levels corre- lated significantly in both top and bottom basins (y2 = 0.52 and
r2
= 0.70, respec- tively). The relationship between ECfW and the average root-zone salinity (ECJ varied between top and bottom basins and at different times during the season.In 1995, water salinity was moni- tored more frequently in several fields, two with high salinity and one with lower salinity. Salinity data was similar in both fields with the highest salinity, indicating that ECfw was highest during
the water holding period, particularly in bottom basins. Conversely, the low salinity field, which held water season- long, had low salinity levels all season (0.1 to 0.2 dS/m).
In one of the high-salinity fields, the EC of inlet water (ECw) was similar to that in the top basin, regardless of time after flooding (fig. 3). During the water holding period, water salinity levels in the bottom basin increased rapidly, which we attribute to a combination of no outflow, reduced inflow rates and evapoconcentration of salts. This sug- gests salinity can be a serious problem in some fields during the water holding period. However, adding fresh water (lower EC) to the bottom basin toward the end of the holding period increased the field’s water level and reduced sa- linity, indicating that monitoring and management can help moderate a salin- ity problem. In bottom basins of some fields, salinity increases made it diffi- cult for some growers to hold water
Appropriate water management in fields can help to reduce salinity damage and produce a healthier rice crop. This normal rice, above, was irrigated with water at 0.6 dS/m, well below the threshold for salinity stress.
without experiencing stand problems and yield losses.
cates a significant decrease in grain in bottom basins compared to top basins (9,700 versus 10,300 pounds/acre). Single-year analysis indicates that top and bottom basin yields were signifi- cantly different in 1994 but not in 1995 (10,960 versus 9,880 pounds/acre, re- spectively). The absence of yield de- cline in 1995 was probably due to lower EC levels in some irrigation water sources, lower cumulative ET during the season and lower salinity levels in a number of rice fields. Grattan et al. (see p. 189) subsequently conducted con- trolled studies to better understand and quantify the relationship between salin- ity, crop performance and yield.
impact of irrigation systems
In 1997, extensive sampling was con- ducted in six rice fields to compare dif- ferent irrigation systems and determine what influence they have on salinity patterns in the field. In the conven- tional system, water flows in series from basin to basin while in the static system water is independently deliv- ered to each basin from a supply/ drain ditch perpendicular to the ba- sins. Flap-gated pipes prevent water mixing between basins. Seventeen lo- cations were monitored in each of
an
upper, middle and lower basin in each field (51 samples per field). At all locations, field water salinity was mea- sured throughout the season and soil salinity was measured at harvest. At two sites, soil salinity was measured at midseason and yields at harvest.Multiyear analysis of yield data indi-
These studies confirmed that water
[image:3.594.36.559.33.206.2]salinity increases in bottom or lower basins to some degree in most fields during the water holding period (data not shown). They also showed that dif- ferent irrigation systems influence field water salinity patterns (fig. 4A-B). In conventional systems salinity levels in- creased from top to lower basins. In static systems each basin was irrigated independently, and salinity levels among basins varied somewhat but were not significantly different. How- ever, in both systems salinity increased with distance from the water inlet. The soil salinity and water flow patterns may contribute to spatial variation between and among basins in the static irrigation systems. After the water holding period, differences among and within basins declined sharply. EC, levels increased during the water holding period, but decreased later when irrigation water was again added to the field.
In the static system, the measured peak EC,,,, occurred at the middle of the water holding period -water was added just prior to the late sample time, most likely lowering the EC level. Al- though not illustrated in figure 4, data from earlier studies showed increases in late-season
ECfM
levels in static and other closed-basin systems. The mean ECc(51
samples) for all basins was 3.1 dS/m in the conventional and 1.7 dS/ m in the static system.was inconsistent. EC,,& at one location, which ranged from less than 1 dS/m to greater than 4.0 dS/m at the end of the water holding period, was nega- tively correlated with reduced stand
(Y = -0.38, mean water holding period EC,,, versus stand density), but not to
Yield data from the 1997 field study
yield ( Y = 0.29). At this site, poor weed control in the top basin had likely af- fected yield more than salinity in the bottom basin, thereby reducing the salinity-yield correlation. At a second location with lower salinity levels but a similar salinity range, stands ( Y = -0.22) and yields ( u = -0.30) were negatively correlated with ECfM during the water holding period.
Coping with salinity
strides in reducing pesticide loads into rivers by holding water on fields longer and using various alternative irrigation systems. At the same time, increased soil and water salinity levels, particu- larly in bottom basins, have been asso- ciated with reduced rice stands and yield. Higher salinity in bottom basins
Rice growers have made great
Fig. 4. Field water electrical conductivity patterns in rice fields with (A) conventional and
(B) static irrigation systems, at three monitoring times after planting.
[image:4.594.224.562.366.704.2]Above, Rice g r o w n in water a t 6.8 dS/m, t w o t o three times the threshold for salinity damage, shows severe leaf necrosis. In
basins where salinity i s a problem, growers can adopt mitigations such as adding fresh water or recirculating water among basins.
apparently is not a new phenomenon: in the early 1970s, when water holding was only required for several days, sa- linity in outflow water was also higher than in inflow water. However, the cur- rent longer holding times appear to in- crease the problem in salinity-prone areas. Salinity problems appear to be ex- acerbated in areas irrigated with non- district water from drain or well water sources with higher salinity levels.
When our studies were conducted, most district irrigation water on the west side of the Sacramento Valley was low in salinity (< 0.70 dS/m), while some nondistrict water had salinity lev- els between 0.70 and 1.5 dS/m. The mean summertime salinity level in the Colusa Basin Drain at the Davis Weir was high- est in 1994 (1.2 dS/m) when tail-water outflow restrictioqs were in effect in portions of the Cohsa Basin. They were also high during the 1976-1977
drought, when water availability was limited (GCID 1997). These findings in- dicate that the quality of nondistrict water sources may be adversely af- fected under conditions of low water availability or restricted flow.
Salinity levels increased in bottom basins particularly during the early sea- son when water holding periods of more than 30 days were in effect. In some fields where salinity was exces- sive, grain yield was significantly re- duced. In contrast, water can be held for the same period in fields low in sa- linity without affecting yields.
The type of irrigation system and pattern of water flow greatly influ- enced salinity patterns in fields. In con- ventional and static systems, salinity levels increased as the distance from the water inlet increased. Salinity was highest in these areas during the early- season water holding period. Water depths in rice fields are typically raised to about 8 inches at 60 to 70 days after planting to protect the developing pollen from cold nighttime tempera- tures. Raising water at this time dilutes salts in the field water, countering the increased salinity resulting from evapoconcentration. This is important as it helps to moderate and control early-season salinity problems and minimize late-season problems dur- ing pollination.
dicated that rice yields are not ad- versely affected until ECe (root-zone salinity) exceeds 3.0 dS/m or when EC_ (inlet water salinity) exceeds 2.0 dS/m (Ayers and Westcot 1985). However, an independent field study (see p. 189) in- dicates that rice growth and/or grain yield are reduced when the mean sea- sonal EC,_ (field water salinity) exceeds 1.9 dS/m. Since EC,,,, increases from top to bottom basins in conventional sys- tems and within basins in static sys- tems, ECw should be substantially lower than this threshold to maintain a mean seasonal ECfw below 1.9 dS/m.
periodically in fields and basins where salinity may be problematic. When sa- linity is a problem, modifications may be needed, such as adding fresh water to salt-affected basins or perhaps recir- culating water among basins to reduce the salinity in the lower basin. UC Co- operative Extension can offer valuable assistance to growers in diagnosing sa- linity problems and better managing rice farms.
Previous salt-tolerance guidelines in-
Rice growers should monitor salinity
S.C. Scardaci is former Farm Advisor, UC
Cooperative Extension, Coliisa County, UC
Davis; M.C. Shannon
is Research Geneti-
cist, USDA-ARS George E. Brown,
Jr.
Sa-
linity Laboratory, Riverside; S.R. Graftan
is
Plant-water Relations Specialist, Depart-
ment of Land, Air and Water Resources,
UC Davis; and A.U. Eke and S.R. Roberts
are former Stafi Research Associates, S .
Goldman-Smith is former Post Graduate
Researcher, and J.E. Hill is Agronomist,
Department
of Agronomy and Range Sci-
ence, UC Davis. W e would like to acknozul-
edge the late Max Spyres, former Colusa
County rice grower,
for
his pioneering
work
in identihiiig salinity as a problem in
local vice fields and for his preliminary
studies
011the problem. Max's encourage-
ment was instvuniental in conducting this
wovk. W e
also thank the numeroi~s
rice
growers whose cooperation made this wovk
possible. This project
was
partially funded
through the U S D A Presidential Water
Quality Initiative: The Sacramento River
Rice Water Quality Denionstration Project,
number 94-E WQD-9520.
References
Ayers RS, Westcot DW. 1985. Water qual- ity for agriculture. FA0 Irrigation and Drain- age paper No 20 (rev. 1). FA0 United Na- tions, Rome, Italy. 174 p.
Water Measurement Report. Willows, CA.
al. 1974. Water Quality in Rice Fields. Water Science and Engineering Papers 4008, Dept. of Water Science and Engineering (now Land, Air and Water Resources), UC Davis.
Hill JE, Scardaci SC, Roberts SR, et al. 1995. Rice irrigation systems for tailwater manage- ment. UC DANR Pub 21490 (revised). 14 p.
salinity on seed set in rice. Plant Cell Environ 18:61-7.
Lee MJ, Ross LJ, Wang RG. 1993. Integrat- ing environmental toxicology and monitor- ing in the development and maintenance of a water quality program: California's rice herbicide scenario (Ch. 18). In: Jolley FL, Wang RGM (eds.). Effective a n d Safe Waste Management: Interfacing Sciences a n d Engi- neering with Monitoring a n d Risk Analysis. Ann Arbor, MI: Lewis.
Maas EV. 1990. Crop salt tolerance. In: Tanji KK (ed.). Agricultural Salinity Assess- ment a n d Management Manual. ASCE Manuals & Reports on Engineering Practices No 71. New York. p 262-304.
Shannon MC, Rhoades JD, Draper JH, et al. 1998. Assessment of salt tolerance in rice cultivars in response t o salinity problems in California. Crop Sci 38:394-8.
[GCID] Glenn-Colusa Irrigation District. 1997.
Henderson DW, Tanji KK, Biggar JW, et
Khatun S, Flowers TJ. 1995. Effects of