Optimal Location of SVC for Voltage Stability
Enhancement under Contingency Condition through
PSO Algorithm
S.Sakthivel
V.R.S.College of Engg andTech,Villupuram, Tamil Nadu, India.
Dr.D.Mary
Govt. College of Engg,Bargur,Tamil Nadu, India.
R.Vetrivel and
V.Senthamarai Kannan
V.R.S. College of Engg andTech,Villupuram, Tamil Nadu, India.
ABSTRACT
A power system, under heavily loaded conditions, is at high risks of probable line outage and consequent voltage instability problem. Real power loss and voltage deviation minimization are reliable indicators of voltage security of power networks. This paper proposes a Particle Swarm Optimization (PSO) based optimal location and sizing of Static Var Compensator (SVC) to improve voltage stability under the most critical line outage contingency in a power system network. Line outages are ranked based on increased reactive power generation and line losses. Particle swarm optimization technique optimizes the location and size of the SVC.The effectiveness of the proposed work is tested in IEEE-30 Bus test system. It has also been observed that the proposed algorithm can be applied to larger systems and do not suffer with computational difficulties.
General Terms
Voltage Stability Enhancement, Line Outage Contingency, Particle Swarm Optimization .
Keywords
FACTS devices, SVC, Contingency Condition, Particle Swarm Optimization Algorithm, Voltage Stability Improvement.
1.
INTRODUCTION
The modern power system networks are forced to be operated much closer to stability limits due to ever increasing load demand, the environmental constraints in expansion of transmission networks and transmission open access in a restructured power market. In such a stressed condition, the system may enter into voltage instability problem and it has been found responsible for several block outs across the world [1]-[2]. A power system needs to be with sufficient reactive power capability to remain voltage secured even under highly stressed conditions.
In a deregulated environment, the optimum bidders are chosen only based on real power cost characteristics and this results in reactive power shortage and ultimately the probable voltage instability. Transmission lines, in a deregulated
environment, are operated under heavily loaded conditions and it results in increased voltage drop and is in high risks of outages. To ensure uninterrupted and quality power supply to the consumers the power system should be stable under contingency conditions.
The introduction of Flexible AC Transmission System (FACTS) controllers [3] are increasingly used to provide voltage and power flow controls. Insertion of FACTS devices is found to be highly effective in preventing voltage instability [4].However, the benefits and performance of FACTS controllers are determined by their location and size [5].Owing to high cost, the number of FACTS devices to be used should be minimized and their benefits may be maximized through efficient optimization methods [6].Static VAR Compensator is a shunt connected controller capable of all possible benefits of FACTS devices [7]-[10]. It is also easy to incorporate in load flow solution and highly suitable for VAR support.
In most of the previous works on voltage stability improvement, only normal operating condition is considered [11]-[12]. Critical contingency is considered and conventional methods are used to install FACTS devices for enhance voltage stability in some recent works [13]-[15]. In those works, the contingency severity is done based on the level of loading. But these methods do not deal with the likelihood of the occurrence of contingency. In this work, the severity of a line outage is measured by considering the amount of increased reactive power generation, as stressed condition implies increased reactive power demand.
The simple and easy to implement swarm intelligent algorithm of Particle Swarm Optimization technique is used to determine the optimal location and sizing of SVC.The objective of this work is improve the voltage stability and reduce the line losses by providing reactive power support with SVC under single line outage contingency condition.
2.
PROBLEM FORMULATION
The heading of a section should be in Times New Roman 12-point bold in all-capitals flush left with an additional 6-12-points of white space above the section head. Sections and subsequent sub- sections should be numbered and flush left. For a section head and a subsection head together (such as Section 3 and subsection 3.1), use no additional space above the subsection head.
2.1
Model of SVC
The SVC is modeled as a variable reactive power connected to a bus in a system. The effect of SVC is incorporated in power flow problem as reactive power generation/absorption. The range of reactive power generation is limited between maximum and minimum values of -50 MVAR to +50 MVAR to keep the size minimum for reducing the cost of SVC
The reactive power generated by SVC is given by
Min Max
SVC SVC SVC
Q
Q
Q
1
2.2
Objective Function
The goal of voltage stability improvement under contingency condition is to minimize the active power losses and voltage deviation by optimal positioning of SVC and its corresponding parameter. Hence, the objective function can be expressed as:
min
f
P
LossVD
2
Where,
2 2
1
(
2
cos
)
3
L
N
Loss ij i j i j ij
j
P
G V
V
VV
1
4
PQ
N
i ref j
VD
V
V
λ=Penalty co-efficient to give equal weightage for losses and voltage deviation
Subject to:
Equality constraints
1
cos
0
5
B
N
Gi Di i j ij ij j i j
P
P
VV Y X
1
sin
0
6
B
N
Gi Di i j ij ij j i j
Q
Q
VV Y X
Inequality constraints
min max
7
sh sh sh
Q
Q
Q
min max
1
8
i j
V
V
V
2.3
Implementation of PSO Algorithm
PSO is an evolutionary computation technique developed by Eberhart and Kennedy in 1995, and was inspired by the social behavior of bird flocking and fish schooling [16]. PSO has its roots in artificial life and social psychology as well as in engineering and computer science. It utilizes a population of individuals, called particles, which fly through the problem hyperspace with some given initial velocities. In each iteration, the velocities of the particles are stochastically adjusted considering the historical best position of the particles and their neighborhood best position; where these positions are determined according to some predefined fitness function. Then, the movement of each particle naturally evolves to an optimal or near-optimal solution. The heading of subsections should be in Times New Roman 12-point bold with only the initial letters capitalized. (Note: For subsections and subsubsections, a word like the or a is not capitalized unless it is the first word of the header.)Each particle keeps track of its coordinates in the problem space which are associated with the best solution (fitness) it has achieved so far. The fitness value is also stored. This value is called Pbest. When a particle takes all the population as its
topological neighbors, the best value is a global best and is called Gbest.After finding the two best values, the particle
updates its velocity and positions with following equation (9) and (10).
k 1 k k
Vi W * Vi C * rand * P1 1 best i Si
k
C * rand * G2 2 best Si
9
k 1 k k 1
Si Si Vi
10
Vik= Velocity of agent i at kth iteration
Vik+1= Velocity of agent i at (k +1)th iteration
W = The inertia weight
C1 = C2 = individual and social acceleration constants (0 to 3)
rand1=rand2=random numbers (0 to1)
Si k
= Current position of agent i at kth iteration Si k+1= Current position of agent i at (k+1)th iteration
itermax = Maximum iteration number
iter = Current iteration number
Pbest i = Particle best of agent i
2.3.1
Particle Definition
Each particle is defined as a vector containing the SVC Bus location number and its size.
Particle: [@ , Φ] Where
@ is the SVC bus location number. Φ is the SVC size.
2.3.2
PSO Parameters
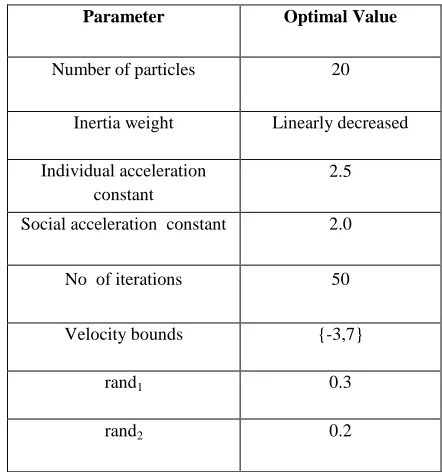
The performance of the PSO is greatly affected by its parameter values. Therefore, a way to find a suitable set of parameters has to be chosen. In this case, the selection of the PSO parameters follows the strategy of considering different values for each particular parameter and evaluating its effect on the PSO performance. The optimal values for the PSO parameters are shown in Table 1.
2.3.3
Number of particles
There is a trade-off between the number of particles and the number of iterations of the swarm and each particle fitness value has to be evaluated using a power flow solution at each iteration, thus the number of particles should not be large because computational effort could increase dramatically. Swarms of 5 and 25 particles are chosen as an appropriate population sizes.
2.3.4
Inertia weight
The inertia weight is linearly decreased. The purpose is to improve the speed of convergence of the results by reducing the inertia weight from an initial value of 0.9 to 0.1 in even steps over the maximum number of iterations as shown in (13).
i
iter 1
W
0.9 0.8
11
max iter 1
Where ,
Wi = The inertia weight at iteration i.
iter= the iteration number.
maxiter= The maximum number of iterations
2.3.5
Acceleration constants
A set of three values for the individual acceleration constants are evaluated to study the effect of giving more importance to the individual‟s best or the swarm‟s best: c1 = {1.5, 2, and 2.5}. The value for the social acceleration constant is defined as: c2 = 4 – c1.
2.3.6
Number of Iterations
Different numbers of iterations {10, 25, and 50} are considered in order to evaluate the effect of this parameter on the PSO performance.
2.3.7
Values for maximum velocity
In this case, for each particle component, values for the maximum velocity have to be selected. Based on previous results, a value of 7 is considered as the maximum velocity for the location line number.
2.3.8
Feasible region Definition
There are several constraints in this problem regarding the characteristics of the power system and the desired voltage profile. Each of these constraints represents a limit in the search
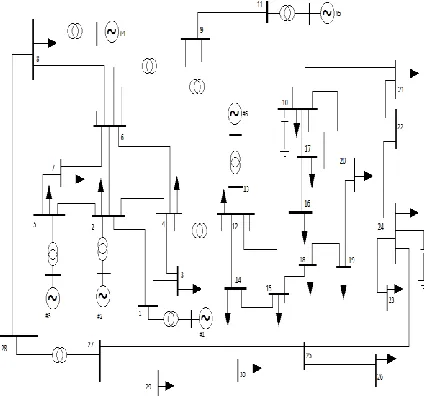
space.Therefore the PSO algorithm has to be programmed so that the particles can only move over the feasible region. For instance, the network in Fig. 2 has 6 generator buses. These buses are not considered for locating SVC, leaving 24 other possible locations (load buses) for the SVC. In terms of the algorithm, each time that a particle‟s new position includes a generator bus the position is changed to the geographically closest load bus. Finally, in order to limit the size of the SVC unit, the restrictions of level of compensation is applied to the particles.
[image:3.612.343.564.251.487.2]2.3.9
Optimal Parameter Values
Table 1. Optimal values of PSO parameters
2.3.10
Integer PSO
For this particular application, the position of the particle is determined by an integer number (Bus number). Therefore the particles‟ movement given by (2) is approximated to the nearest integer numbers. Additionally, the location number must not be a generator bus. If the location is a generator bus, then the particle component regarding position is changed to the geographically closest load bus.
Parameter Optimal Value
Number of particles 20
Inertia weight Linearly decreased
Individual acceleration constant
2.5
Social acceleration constant 2.0
No of iterations 50
Velocity bounds {-3,7}
rand1 0.3
Fig 1. Flow chart for the PSO
3.
NUMERICAL RESULTS AND
DISCUSSIONS
The optimal location and sizing of SVC is formulated with the primary objective of minimization of real power losses and secondary objective of minimization of voltage deviation subject to voltage limit and reactive power limit constraints. The effectiveness of the proposed approach has been illustrated using the IEEE 30 bus test system [17].
The system (Fig.2) has 6 generator buses 24 load buses and 41 branches. SVC device is installed on different load buses one by one based on the proposed algorithm. The objective function (2), active power losses and deviations of load bus voltages is solved by the proposed algorithm to locate SVC in the most suitable load bus. All the 41 line outages are considered one at a time and total reactive power generation and line losses are calculated. The outage of line number 5 leaves the system with the highest value of reactive power generation and line losses. This means that this is the highly stressed contingency or most critical contingency of the system and therefore outage of line 5 is taken as suitable contingency for this study.
Fig 2. One line diagram of IEEE 30 bus test system
The optimal location, which is the location at which value of objective function is minimum, can be found as load bus number 21. That means locating an SVC at that bus gives best optimum value for the objective function. The value of objective function is affected by the level of compensation, and for some values of level of compensation, power flow solution diverges giving worst solutions. Hence the level of compensation plays an important role in the process of optimization due to its complex non linearity.
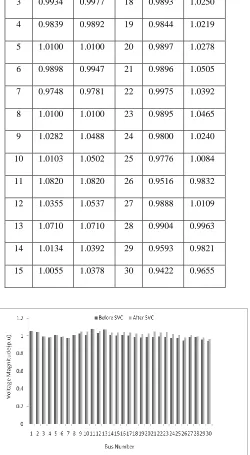
The proposed algorithm is run with line 5 outage contingency and global best position and size are determined for voltage stability improvement by real power loss minimization. The global best position for this study is bus number 21 and the corresponding size of SVC is 40.8316 MVAR.Locating an SVC at the global best position reduces both real power loss and voltage deviation and hence improves the voltage stability. Bus voltage magnitudes are tabulated in Table 2 and voltage profile improvement is depicted in Fig 3.
Table 2. Bus voltage magnitudes before and after SVC installation
Bus
No
Bus voltage
Magnitude Bus
No
Bus voltage Magnitude
Before SVC
After SVC
Before SVC
After SVC
1 1.0600 1.0600 16 1.0141 1.0417
2 1.0430 1.0430 17 1.0037 1.0400 Start
Initialize each particle’s position and velocity
Is iter<maxiter?
Is last particle?
Determine Gbest among Pbest ‘s
Relocate the particle in the space
Relocate the particle in the space Update position and velocity
Is the position feasibile?
End
Run NR load flow, Calculate fitness and Determine Pbest
Yes
No
No No
Yes
3 0.9934 0.9977 18 0.9893 1.0250
4 0.9839 0.9892 19 0.9844 1.0219
5 1.0100 1.0100 20 0.9897 1.0278
6 0.9898 0.9947 21 0.9896 1.0505
7 0.9748 0.9781 22 0.9975 1.0392
8 1.0100 1.0100 23 0.9895 1.0465
9 1.0282 1.0488 24 0.9800 1.0240
10 1.0103 1.0502 25 0.9776 1.0084
11 1.0820 1.0820 26 0.9516 0.9832
12 1.0355 1.0537 27 0.9888 1.0109
13 1.0710 1.0710 28 0.9904 0.9963
14 1.0134 1.0392 29 0.9593 0.9821
15 1.0055 1.0378 30 0.9422 0.9655
Figure 3. Bus voltage profile improvement
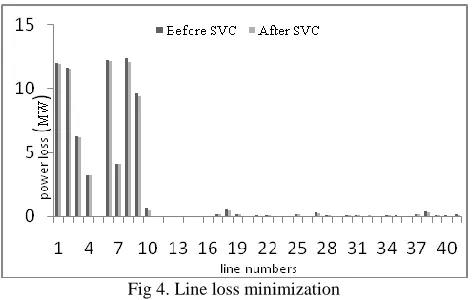
[image:5.612.56.306.76.531.2]It is clear from Table 3 that line losses in almost all the lines are minimized after the installation of SVC at bus number 21.Line 5 is outaged and it is not included in the table. The reduction in line losses is illustrated in Fig 4.The line flows and losses in lines 1-9 are much higher than that in lines 10-41 and therefore they are highly visible.
Table 3.Line losses before and after installation of SVC
Line
No
Line Loss
Line
No
Line Loss
Before SVC
After SVC
Before SVC
After SVC
1 12.0220 11.9370 22 0.1120 0.0940
2 11.6210 11.5660 23 0.0190 0.0160
3 6.2420 6.1700 24 0.0270 0.0300
4 3.2490 3. 2340 25 0.1380 0.1450
6 12.2670 12.2000 26 0.0190 0.0410
7 4.1300 4.1240 27 0.2940 0.2420
8 12.3970 12.1140 28 0.0640 0.0560
9 9.5960 9.4300 29 0.0000 0.0330
10 0.6420 0.4830 30 0.0890 0.1250
11 0.0000 0.0000 31 0.1010 0.0890
12 0.0000 0.0000 32 0.0200 0.0740
13 0.0000 0.0000 33 0.0040 0.0440
14 0.0000 0.0000 34 0.0970 0.0900
15 0.0000 0.0000 35 0.0440 0.031
16 0.0000 0.0000 36 0.0000 0.0000
17 0.1720 0.1370 37 0.1870 0.1780
18 0.5410 0.4470 38 0.3520 0.3350
19 0.1700 0.1360 39 0.0730 0.0700
20 0.0190 0.0170 40 0.0640 0.0330
Fig 4. Line loss minimization
The global best position for installation of SVC for voltage stability improvement under outage of line number 5 is Shown in Table 4.It can also be seen that size of SVC is small and cost this small SVC is economical. The total system losses are reduced from 74.948 MW to 73.888 MW and the reactive power generation is also reduced. This is an indication that the system is relieved much from the highly stressed condition caused by line outage.
Table 4.Global best position and size
SVC
location
SVC
Size
MVAR
Total Ploss
MW
Total Qgen
MVAR
Before
SVC
After
SVC
Before
SVC
After
SVC
21 40.8316 74.948 73.888 330.629 325.114
4.
CONCLUSIONS AND FUTURE WORK
This work shows the step by step application of the Particle Swarm Optimization algorithm to solve the problem of optimal placement and sizing of SVC in a medium size power network during single line contingency. The algorithm is easy to implement and is able to find the optimal solution with regard to global best position and size of SVC. The settings of the PSO parameters are shown to be optimal for this type of application and the algorithm is able to find the optimal solutions with a relatively small number of iterations and particles, therefore with a reasonable computational effort.
The simulation results show that an SVC can be used for improving voltage security margin by minimizing the amount of total real power losses in the system. The results are promising for the medium size power network used as an example. For large power systems, the PSO algorithm could have a significant advantage compared to exhaustive search and other methods by giving better solutions with less computational effort. Future work can be done by testing the algorithm on larger power systems and including other types of FACTS devices.
5.
REFERENCES
[1] IEEE publication 90 TH 0358-2 PWR,”Voltage stability analysis of power systems :Concepts,analytical tools,and industryexperience,”Report prepared by IEEE working Group on Voltage Stability,1990.
[2] CIGRE Task Force 38-0210,”Modelling of voltage collapse including dynamic phenomena,”CIGRE Brochure,No 75,1993.
[3] N G. Hingorani, L. Gyugyi, Understanding FACTS: Concepts and Technology of Flexible AC Transmission Systems, IEEE Press, New- York, 2000.
[4] N Yorino,E.E. El-Araby,H.sasaki,and Sh Harada,” A new formulation for FACTS allocation for security against voltage collapse,”IEEE Trans. Power Systems, Vol. 18,No.1,pp3-10,February 2003.
[5] M.H. Haque,”Optimal Location Shunt FACTS Devices in Long Transmission Lines,”IEEE Proceedings
Generation,Transmisson and
Distribution,Vol.147,No.4,July-2000,pp 218 -222.
[6] L. J. Cai, I. Erlich, G. Stamtsis, “Optimal choice and allocation of FACTS devices in deregulated electricity market using genetic algorithms,” 2004 IEEE/PES Power Systems Conference and Exposition, vol. 1, Oct. 2004, pp. 201 - 207.
[7] Y. Mansour, W. Xu, F. Alvarado, and C. Rinzin, “SVC placement using critical modes of voltage instability,” IEEE Trans. on PowerSystems, vol. 9, no. 2, May 1994, pp. 757–763.
[8] M. K. Verma, S. C. Srivastava, “Optimal placement of SVC for static and dynamic voltage security enhancement,” International Journal of Emerging Electric Power Systems, vol. 2, no. 2, 2005, Article 1050.
[9] C. S. Chang, J. S. Huang, “Optimal SVC placement for voltage stability reinforcement,” Electric Power Systems Research, vol. 42, no. 3, Sep.1997, pp. 165-172.
[10]C. S. Chang and J. S. Huang, “Optimal multiobjective SVC planning for voltage stability enhancement,” IEE Proceedings- Generation,Transmission and Distribution, vol. 145, no. 2, Mar. 1998, pp. 203 – 209.
[11]E. E. El-Araby, N. Yorino, H. Sasaki, “A comprehensive approach for FACTS devices optimal allocation to mitigate voltage collapse,” Proc.of IEEE/PES Transmission and Distribution Conference, vol. 1, Oct. 2002, pp. 62 – 67. [12]T. J. Overbye and C. L. DeMarco, "Voltage security
enhancement using energy based sensitivity analysis," IEEE Trans. on Power System, vol. 6, no. 3, pp. 1196-1202, Aug. 1999.
[13]MaysamJafari,Saeed Afsharnia,”Voltage Stability Enhancement in Contingency Conditions using Shunt FACTS Devices,”EUROCON The international conference on “computer as a tool”Warsaw,Sep 9-12,IEEE,2007.
point method,” XXXII national systems conference,NSC 2008,December17-19,2008.
[15]P.S.Venkataramu,and T.Ananthapadmanabha,”Installation of unified power flow controller for voltage stability margin enhancement under line outage contingencies,” Iranian Journal of Electrical and Computer Engineering, Vol. 5, No. 2, summer-fall 2006
[16]J. Kennedy, R. Eberhart, "Particle swarm optimization in,” Proceedings of the IEEE International Conference on Neural Networks, pp. 1942- 1948 1995.
[17]Power Systems Test Case, The University of Washington Archive,
http://www.ee.washington.edu/research/pstca/, 2000.
AUTHOR BIOGRAPHIES
S.Sakthivel
received the Degree in Electrical and Electronics Engineering and Masters Degree in Power Systems Engineering in 1999 and 2002, respectively. He is doing the Ph.D., Degree in Electrical Engineering faculty from Anna University ofTechnology, Coimbatore, India. He is working as an assistant professor of Electrical and Electronics Engineering at V.R.S.College of Engineering and Technology, Villupuram, Tamil Nadu, India. His research areas of interests are Power System control, Optimization techniques, FACTS and voltage stability improvement.