Problems Discovery of Final Graduation Projects
during the Software Development Processes
Mohammed Abdullah Hassan Al-Hagery
Qassim University, Kingdom of Saudi Arabia, Faculty of Computer, Department of Computer Science.ABSTRACT
The traditional techniques and methods used by students during systems development at the College of Computer, Qassim University is leading to this study. It leads to identify problems that hinder the construction and development of information systems, and identify their causes. The most important stages of systems development are analysis and design, which represent a solid foundation to build strong systems that are free from errors. The motivation of this research is the existence of many problems that impede getting exact output after the development of systems by the university graduates within departments of computer. The research concentrates on discovering the problems during the development tasks. The required data were collected using a questionnaire method, which formulated and judged and distributed to the target population. The research results were analyzed by three statistic methods.
Keywords
Software development, object oriented approach, Traditional approach, Development challenges, Software graduation projects.
1.
INTRODUCTION
With the entry of the twentieth century and the atheist, the world has witnessed tremendous growth on a wide range of computer information systems, in different areas of life, where an increasing number of computers at a great rate everywhere. The information systems have become an essential component of work in most organizations and companies, which include a huge number of applications, technical computing, and communication tools used in all areas of life, such as management, education, industry, media, culture, arts, and home life. The spread of information technology and its application to the growing attention to the development of Information Systems with high quality, these systems meet the requirements of users and customers efficiently and cost effectively [1].
All this has contributed to developing the science of systems analysis and design quickly over a short period of time, although recent emergence of this science, has recently appeared since four decades only [2], [3], and still currently witnessing the emergence of many methodologies and techniques and various tools as discussed in [4].
In spite of the diversity of information systems, the development of tools, methods, and techniques necessary to develop this type of system. The core of this process is concentrated on the study, analysis of the problems in depth, and finds appropriate solutions according to the surrounding environment, and available resources [5].
Really, there are two approaches of system development; Traditional Approach and Object-Oriented development Approach. The Traditional Approach of systems development has a lot of models that deal with different types of projects such as spiral, waterfall, iterative and v-shaped, but all these models and other lack flexibility to deal with other types of software like Object-Oriented [4].
On the other hand, Nabill & Govardhan knit a good comparison between both the Traditional Approach of systems development and Object-Oriented development Approach [4]. Object oriented system development is widely recognized as improving productivity and reducing system maintenance costs. However existing approaches have not sufficiently addressed the following three questions which are equally important to users and undergraduate students or researchers. Firstly, what are the benefits of object oriented system development compared to traditional approaches? Secondly, what are the essential feathers of an object oriented life cycle model to fulfill the benefits of object oriented development? And thirdly what the pitfalls are of object oriented development and how to cope with them? All these questions answered in [6].
Object-oriented development methods model system components as objects. These objects allow the designer to separate the interface from the implementation. The popular thought is that this allows a developer to ignore many aspects of the system while focusing on those at hand. Another conjecture is that this object model is more natural in terms of how systems modeled. The popular trend seems to be a shift from typical procedural development methods to object oriented methods. Unfortunately, software engineering is a field that even in the research is traditionally poor with respect to experimental verification [7].
with high quality, for this reason, in [11] it found that, the researchers presented 8 problems facing the students during the development of graduation projects. These problems were concluded based on the nature of the work environment and the projects type. In addition, Johns-Boast and Flint [12], introduced a study for preparing suitable environment for all project players that will improve students outcomes based on some actual problems at the academic organization. They reported that "we have improved the outcomes for all stakeholders: students, clients and academics, and we have reduced significantly the work load of the academics involved, while gaining an improved ability to differentiate between students' contribution".
On the other hand, Dorothy and Miky, in their research [11] examined the issue in the context of the Information Science and Technology (IST) department of a technological college preparing students for careers in organizational training. The graduates are expected to be able to analyze, design, develop, implement, evaluate, and manage instructional systems and other learning environments. Their work focused on the contribution of the curriculum structure and final projects to graduates' employability. Two research questions have been discussed firstly, to what extent do the final projects present authentic organizational training environments? Secondly, to what extent are the final projects products of integrated curriculum knowledge and skills?
Our research is focusing on discovering the problems facing graduates student at a specific environment. This environment includes the departments of computer at Qassim University, KSA. The person who we mean as a system analyst in this research is a university student of the final level. Problems of systems analysis mainly hinder student's graduation projects in the last year for completing a bachelor's degree in Information Technology or in Computer Science. Graduation projects are a real test of the problems facing the students during their studies at the university, so the first step of the solution is to discover the problems. Then it will be easy to solve and to give good results for learning.
2.
RESEARCH PROBLEM
The research problem is concentrated on a number of challenges including, lack of knowledge and the ability to identify problems. Those problems have a significant role in the process of failure of information systems development, in the colleges of computer within the Qassim University, for students of the final level. These problems appear in the stage of preliminary study (feasibility study and gathering system requirements), the data collection stage, and design phase. As well as the stage of documentation, in addition to problems related to analyst himself that represent an important and vital role in this process, beside that, the organization's problems, such as the work environment surrounding the developers, which affecting negatively and positively in the stages of development [13].
3.
RESEARCH OBJECTIVES
The objective of this research is to discover the actual problems that arise during the projects development life cycle. The developers represented by a set of undergraduate students at Qassim University, College of Computer including both boys and girls.
4.
HYPOTHESES
There are two types of assumptions, and are imposed; firstly, hypothesis of zero, which means there is no statistically significant differences between the views of the sample,
different variables. Second, the imposition of non-zero means the existence of statistically significant differences between the views of the sample and different variables.
The objective of testing hypothesis is to know to what extent the sample represents the research community, and are there statistically significant differences between the views of the sample according to variables such as sex, academic qualifications, employment sector, etc. As will as to obtain the level of statistical significance of the difference between the views of the sample denoted by the symbol (α), and its value often does not exceed (0.05). This means that the researcher is confirming the confidence of research by 95%.
The results reached are representing the research community; there are no differences in the view of the sample according to the research variable, there is still a probability less than or equal to 0.05 for the existence of differences between the views of the sample. To measure these differences, the T-test , and the test analysis of variance (ANOVA) are used. When the level of function α is less than (0.05) it can not generalize the result on the sample and the research community, and when the level of function α is greater than (0.05) ،in this case it cannot generalize the results on the research community [14].
Therefore, many of assumptions developed as follows: No statistically significant differences at the level of (0.05), between the perceptions of university students to the problems of projects analysis and design with the following variables: (a) The variable associated with sex.
(b) The variable of academic qualifications (Bachelor degree). (c) The variable that represents the type of analysis.
(d) The variable that represents the projects type.
5.
RESEARCH COMMUNITY
It includes a big sample of Computer Science and Information Technology students. Those students are final year of Bachelor degree. The data collected during two semesters from the Departments of Computer at Qassim University, KSA.
5.1 Selection of Research Community
The research community has been chosen for the following reasons:1. Problems of this research are focusing primarily on the students of Computer Science and Information Technology.
2. Definition of the problems that we want to measure the degree of presence in these departments, and in part of the Kingdom of Saudi Arabia
3. Research sample included sexes, male, and female who are in more than one place, and this will provide an opportunity to learn about different views on different aspects of the questionnaire.
5.2 Research Sample
A random sample selected from the research community, according to the scientific methods used in the selection process, then about (87) questionnaire were distributed, and the number of retrieved questionnaire was about (72) sheet.
5.3 Sample Description
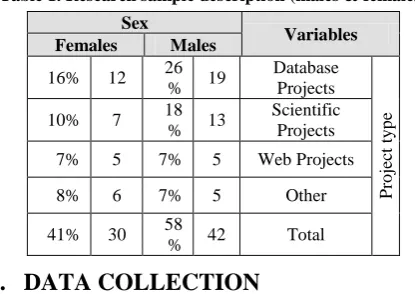
both males and females in Information Technology department according to specific variables. The total number of males was 42 and females were 30 students, so the sample size was 72 student. The final projects classified into four classes; Database Projects, Scientific Projects, Web Projects, and other types, as shown in Table 1.
Table 1. Research sample description (males & females)
Variables Sex
Males Females
P
ro
jec
t
ty
p
e
Database Projects 19
26 % 12 16%
Scientific Projects 13
18 % 7 10%
Web Projects 5
7% 5 7%
Other 5
7% 6 8%
Total 42
58 % 30 41%
6.
DATA COLLECTION
For identifying the problems of projects analysis and design, the questioner selected for data collection as a tool because the data size is relatively large, therefore, the formulation of this tool performed by the following steps:
6.1 Identify Questionnaire Domains
The theoretical part related to the research subject used to identify key areas of the questionnaire, as follows:
i. The traditional method (structured method) includes; preliminary study (feasibility study), data collection, data analysis, design phase, in addition to some general problems.
ii. The use of UML includes; identify and describe the requirements, analysis, design phase, and general problems [15]. The content of the questioner presented to two specialists for the purpose of review and arbitration over the validity and importance.
6.2 Questionnaire Preparation
It was started by determine the main areas,design questionnaire contents, and relying on the following two sources:
[image:3.595.60.268.148.295.2]a) Basics for the analysis and design of software projects. b) Consulting a number of analysts and projects designers. The total number of items of questioner is (117 paragraph), as shown in table 2.
Table 2. Distribution of questionnaire paragraphs
Type of development Domain name
No of statements
S
tru
ctu
re
d
m
eth
o
d
Initial study 9
Data collection 13
Data Analysis 10
Design 15
General problems 7
OO
Ap
p
ro
ac
h
(UML
)
Requirements Gathering 20
Requirements Analysis 21
Design 15
General problems 7
Total 117
6.3 Testing of the Questionnaire Credibility
To confirm the sincerity of the research tool, it was presented to a set of specialists in Computer Science and Information technology domain as arbitrators. Those specialists approved the validity of the paragraphs. They were modified by deletion or addition to become suitable to measure the research areas.After retrieval of the questionnaire sheets from the arbitrators, the observations and amendments were examined. Each paragraph gets less than 70% of the agreement of the arbitrators have been deleted or modified, and because of this step, some of the paragraphs has been updated, but did not delete any paragraph, after that the questionnaire became in its final form and ready for application.
6.4 Method Stability
To calculate the stability rate of questionnaire, it was distributed to a sample equal to five members, selected randomly from the research community, and a week later they were redistributed again to the same members, and the stability rate of the questionnaire was calculated by applying Cooper Equation (1).
Cooper pointed out that if the value of agreement exceeded 85%, which indicates the stability coefficient is high. After applying the equation of Cooper, the percentage of agreement of the questionnaire is 85.7%, indicating a high stability coefficient for the research tool, and based on that, the results can be generalized.
6.5 Final Application of the Method
Research tool applied by the following steps: - The questionnaire distributed during two days.- The questionnaire distributed to students in two departments of the computer college.
- The questionnaire received three days after distribution
7.
STATISTICAL PROCESSING
There are two types of statistical methods used; a descriptive statistical techniques and of relational statistical methods.
7.1 Descriptive Statistical Methods
They describe the state in general without detailed study of the state and their effect on other phenomena. The most important descriptive statistical methods are repetition measures of central tendency, and measures of dispersion [14].
(A) Measures of central tendency:
The methods include average, median and mode. The average is more commonly used measures of central tendency, and is distinct from other measures that include all values in calculations without ignore any value. One of the main disadvantages of this measure, it is influenced by extreme values (high or low) and this will not represent the average of the reality of the data [14]. The equation of the medium is presented in formula (2).
=
Average of agreement
Number of paragraphs in the agreement
Questionnaire items number ×100 (1)
Average =
∑values
Number of values
(B) Measures of dispersion:
It uses to measure the degree of values dispersion or to find out how a set of values distributes around its mean. It gives the values that indicate the degree of convergence or divergence of set of values with the mean of these values. The most important measures of dispersion are the range, variance, and standard deviation [14]. The standard deviation is the most important of these measures as in equation (3).
7.2 Relational Statistical Techniques
It aims to study a specific phenomenon in depth, then creation of hypotheses and examine these hypotheses from the statistical side, by using the association measures, some of these measures are very important such as Pearson coefficient, Spearman Coefficient, T-Test, and test of variance analysis (ANOVA), each one of these measure has its own uses [14].
(A) T-Test:
T-Test is used to determine significant differences between the views of a sample for a variable includes two-dimensional, such as sex (male, female) as in Equation (4)
Degree of Freedom = (size of first sample + size of the second sample – 2) (5)
And the value of α is calculated in terms of degree of freedom and dividing at
(B) Variance analysis test (ANOVA):
Used to determine significant differences between the views of the sample for a variable contains more than two dimensions, such as age (13-18), (19-35), (over 35), as shown in equation (6)
Where: the degree of freedom between groups = size of groups -1
In addition, the value of α is calculated in terms of degree of freedom at the level of (0.05) [14]. In order to answer the research questions, we used an appropriate statistics to describe the analysis results of the study by using the SPSS program.
The following weights were given to the existence degree of the problem as follows, (5) means that the alternative exists clearly, (4) alternative exists, (3) alternative exists to some extent, (2) the alternative does not exist, and (1) the alternative does not exist at all, Then use the following statistics:
1. Measure of central tendency (average): to measure student's opinions about the degree of a problem.
2. Measure of dispersion (standard deviation): To find out the degree of deviation of perception towards the degree of problem existence.
3. T-Test: To see significant differences between the opinions of a sample to a variable contains two dimensions such as sex (male, female).
4. ANOVA Test: To find out the significant differences between the opinions of a sample to a variable contains more than two dimensions as type of projects.
[image:4.595.70.267.688.772.2]After statistical processing of the questionnaire, the criteria of problem recognition are shown in Table 4.
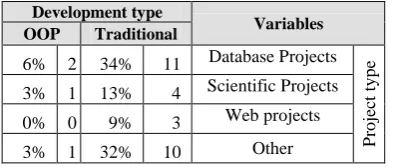
Table 3. Research sample description (Development type)
Variables Development type
Traditional OOP
P
ro
jec
t
ty
p
e
Database Projects 11
34% 2 6%
Scientific Projects 4
13% 1 3%
Web projects 3
9% 0 0%
Other 10
32% 1 3%
Total 28
88% 4 12%
On the other hand, Table 3 presents the comparisons between the traditional and the Object Oriented approach for projects development. The table shows many types of software projects.
Table 4. Verbal estimate degree for problem presence
Average limits Percentage
Problem level
Less than 1.5 Less than 30
Absolutely not found
1.5-2.5 30 - <50
Is not found
2.5-3.5 50 - <70
Is found to some extant
3.5-4.5 70 - <90
Is found
More than 4.5 90 - <100
Is found clearly
Table 5 presents the reduction of the problems through the development steps, which are the preliminary study, analysis, design, and Implementation.
Table 5. Reducing the problems during the development steps
Variables Interest in the
implementation Insufficie
nt time
De
v
elo
p
m
en
t
ste
p
Preliminary study 79%
82%
Analysis 74%
78%
Design 72%
82%
Implementation 68%
75%
F =
Mean squares within groups Meansquaresbetween groups
(6)
Degree of freedom within groups = Sum of the squares deviations of average groups Degree of freedom between groups
(7) =
T-test
Mean of first sample - Mean of second sample
Square of standard deviation for sample 2 (4) Size of second sample
+ Square of standard deviation for sample 1
Size of first sample =
8.
RESULTS ANALYSIS
Based on what explained in various stages above, we reached the following points:
1.Found that only 12% of the total students are developing projects using the Object Oriented approach using tools such as the (UML), and the rest use the traditional methods(structured methods), kindly, see Table 3. This represents real weaknesses of students' understanding, and represents a clear challenge.
2.There are some problems in various stages of project analysis and design, see table 5. It depends on the research sample, where the percentage of the emergence of these problems depends on the weights mentioned on Table 4, as follows: 79%, 74%, 72%, and 68% for stages of the preliminary study, data collection, data analysis, and project design, respectively.
3.Students' have an interest in the implementation phase, and they ignore the previous stages, where this problem is reducing when approaching to the implementation phase. As in the following results: 79%, 74%, 72%, and 68%, because the outputs can be seen only in the implementation phase clearly by the project developer, the results are illustrated above in table 5.
4.The inability to give students sufficient time to complete the various stages of project development. Where, the proportion of problem of giving short time for preliminary study step is equal to 82%, while the proportion of the emergence of problem in the analysis phase is equal to 78%. Also 82% for design, and 75% for implementation phase, respectively, these results depends on the variables shown in Table 5 above.
5.Students have a lack for attention to the practical side during their studies to analyze and design training projects. They do not have a sufficient training, only theoretical or illusory simple cases.
6.No statistically significant differences at the level of significance of (0.05) between the perceptions of projects analysts to the problems of analysis, and design of projects due to the variable of sex or qualification or type of projects. So, this will contribute to generalize the results to the research community.
7.In addition to that, we note that students and their supervisors in the university are focusing on one type of analysis (structural type), therefore, students conclude that this type is the only type, and this leads to failure of these projects in many times and this will be a reason for emergence of several problems.
9.
CONCLUSIONS
From the above results, it can be concluded that there are many challenges or problems in various development phases of final projects. In this sense, a set of important conclusions can be summarized as follows:
1. The existence of many problems is facing undergraduates in various phases of their projects development.
2. Students and supervisors are not keen to develop projects through a standard development steps. The reason is the high cost and the college or supervisor only cares about the final product and does not care about method and steps of product development.
3. The main reasons for the problems related to the analysis and design can be concluded from the following:
Students during doing their projects, they are attending many courses, sometimes exceeds of four.
The high cost of development of good projects gives attention to students to concentrate on all stages, including documentation, although, the students cannot get a financial support for their projects.
Not to give students sufficient time to apply the various stages of projects development.
Lack of awareness among students to differentiate between the good projects that require high cost and time-consuming for development, and poor projects (low-cost projects)
The students are focusing on the implementation phase only, being a significant part of the project and ignore the other steps, which constitute a significant part of project development.
Lack of student's interest to develop projects by using new analytical methods (like OO Approach) based on the usage of UML through known standard steps.
Student as a projects analyst believed that the traditional/structural method is the best method to develop any kind of projects, because their level of experience is low, and they do not have the ability to consult experts in this area, in addition to supervisors.
10.
ACKNOWLEDGMENTS
Great thanks to the Deanship of Scientific Research for supporting this research, because this work was carried out at the Department of Computer Science, College of Computer, Qassim University and supported by Scientific Research Deanship according to the agreement of project No. SRD-011-609, Qassim, KSA.
11.
REFERENCES
[1] Bansal, R. 2000. Information Systems: Analysis and Design-A Modern Approach to Systems Development. [2] Elmasri, R, and Shamkant, B. 1994. Fundamentals
Database System, 2nd edition, Addison-Wesley.
[3] Humphrey, W. S. 1989. Managing the Software Process, 3rd Edition, Pearson Edition.
[4] N. M. A. Munassar, A. Govardhan, "Comparison between Traditional Approach and Object-Oriented Approach in Software Engineering Development", International Journal of Advanced Computer Science and Applications(IJACSA), Vol. 2, No. 6, pp.70-76, 2011. [5] Jeffrey, A. H, Joey G, and Joe. V. 2011. Modern System
Analysis and Design, 6th edition, Addison-Wesley. [6] Engels, G. and Kappel, G. 1994. Object Oriented System
[7] Zelkowitz, M. and Wallace, D. 1997. Experimental validation in software engineering, Conference on Empirical Assessment in Software Engineering, Keele University, Staffordshire, UK. Available at: http://hissa.nist.gov/exper/ease.html.
[8] Folwer, M. 2003.UML Distilled: A Brief Guide to the Standard Object Modeling Language, 3rd Edition, Addison-Wesley.
[9] Booch, G. Rumbaugh, J. and Jacobson, I. 1998. The Unified Modeling Language User Guide, 1st Edition, Addison-Wesley.
[10] S. K. Kim, "Object-oriented Development of Computer Code for Inverse Heat Conduction Problem", International journal of precision engineering and manufacturing Vol. 8, no.1. Jan 2007.
[11] L. Dorothy, R. Miky, "Responding to the Employability Challenge: Final Projects for IT-based Organizational Training", Issues in Informing Science and Information Technology, Volume 8, 2011.
[12] Johns-Boast. L, Flint, S. 2009. Providing students with Real-world experience through university group projects, 20th Australasian Association for Engineering Education Conference, University of Adelaide.
[13] Sommerville, I. 2011. Software Engineering, 9th edition, Addison - Wesley.
[14] Daudhry, R. W. 2000. Scientific research: fundamentals of scientific theory & practice, Dar Al-Fikr, Damascus. [15] Kendall, E. K, and Kendall, J. E. 2010. System Analysis