An Image Sharpening Method by Suppressing the Noise
Smrity Prasad
Research Scholar, Centre for Research, Christ University, Hosur Road, Bangalore, India
N.Ganesan
Director (MCA), RICM, Padmanaba Nagar, Bangalore, India
ABSTRACT
Image Processing refers to the use of algorithm to perform processing on digital image. Microscopic images like some microorganism images contain different type of noises which reduce the quality of the images. Removing noise is a difficult task. Noise removal is an issue of image processing. Images containing noise degrade the quality of the images. Removing noise is an important processing task. After removing noise from the images, the visual effect will not be proper. Image Sharpening in an image is basically a process of extracting high frequency details from the image and then adding this information to the blurred image. This paper presents an approach to a de-noise method for noisy image and a method of sharpening of the noisy image.
Keywords
Gaussian Noise, Salt & Pepper Noise, Image Sharpening, Homomorphic Filter, PSNR, MSE, Unsharp Masking (UM), Gaussian Low Pass (GLP).
1.
INTRODUCTION
Images of microorganism are extensively used in the area of medicine and biotechnology. Microorganism image analysis is having very important role in modern diseases diagnosis. The study of microorganism needs identification of different type of microorganism. For that qualitative analysis is required. By the term qualitative analysis mean the differentiation of different type of microorganism that are present in industrial sludge. In microscopic image capturing, due to environmental conditions, system noise, and motion of the object and so on, there will be difference between the original image and the resulting image. Noise must be removed for its improvement so that real information about image will be obtained for special purpose. There are number of algorithms for noise removal [1]-[5].
Image de-noising methods include spatial domain method and frequency domain methods.
This paper will suggest to denoising an image
Q
P
I
(1)Where P is original image and Q is noise with unknown variance or density.
The objective of the sharpening is to process an image so that the result is more suitable than the original image for a specific application. [2]-[8] Image enhancement is used to improve the interpretability or perception of information in images for human viewers or to provide better input for a specific application. The enhancement of the noisy image is difficult because the sharpening operation increase the noise. [7]
In this paper, a simple method of sharpening of noisy image is presented. The proposed method includes two steps: suppressing the noise step and sharpening step. Here optical microscope (400X) image of Cyanobacteria with a size of 583 X 345 has been taken for analysis
The rest of the paper is organized as follows:-
In the second section the type of noise and Noise Suppressing method in spatial domain and frequency domain is described. In the third section the sharpening methods is described. In the fourth section assessment parameter is discussed .Experimental result and discussion is presented in section 5.
2.
IMAGE NOISE AND NOISE
SUPPRESSING METHODS
2.1
Image Noise
Image noise is generally regarded as unwanted product of image capture. Image noise can be divided differently according to different criterion. The criterion includes the cause of image noise generation, the shape of the noise amplitude distribution over time, noise spectrum and the relationship between noise and signal and so on. The types of noise can be Gaussian Noise, Impulse Noise, Speckle Noise, and additive Noise. Gaussian noise is the type of noise in which, at each pixel position (i,j),the random noise value ,that effects the true pixel value is drawn from a Gaussian probability density function with mean µ(i,j) and standard deviation σ(i,j) [4]. The probability Density Function of a Gaussian random variable, z, is given by
2 2 2 / ) (
)
2
/
1
(
)
(
z
e
z P
(2) Where z represents gray level.
Impulse noise alters at random the value of some pixels. In Binary image some whitepixel become blackand some black pixel become white [4]. Inbinary imagethis means that some black pixels become white and white pixels become black. This is also called salt and pepper noise. The PDF of Salt and pepper noise is given by
otherwise
b
z
p
a
z
p
z
p
b a0
)
(
(3) If b > a gray level b will appear as a light dot in the image. Conversely, level a will appear like a dark dot [4].noise with different noise density and Gaussian noise with mean 0 and different variance respectively.
2.2
Noise Suppressing Methods
Different methods of denoising based on noise characteristics can be selected. Noise can be suppressed in both space domain and frequency domain.
Gaussian filter is a linear filter and in two dimension is given by
)
2
/
)
,
(
exp(
)
,
(
u
v
D
2u
v
2H
(4) Where D (u, v) is the distance from any point to the origin of Fourier transform. σ is the measure of the spread of the Gaussian curve. Median Filter as a non linear operation is a spatial method of reducing salt and pepper noise in an image. Median filter replaces the value of a pixel by the median of the intensity level in the neighborhood of that pixel. [4] Such noise reduction is preprocessing step to improve the result of later processing. The main idea of the median filter is to run through the signal entry by entry, replacing each entry with the median of the neighborhood. [6]
Figure 4 shows the result of filtering the noise image shown in figure 2 with a median filter of size 3X3 and Figure 5 show the result of filtering the noise image shown in Figure 3 with a Gaussian filter of sigma 0.62.
3.
IMAGE SHARPENING
Sharpening is the process of manipulating an image so that image is more suitable than the original image [6]. In general if single image enhancement method will be implemented, actual requirements will be obtained. To get better visual effect for images, researcher perform filtering of image first and then sharpen the image
.
Image enhancement can be divided in to two.3.1
Spatial Domain Image Sharpening
Spatial domain image enhancement includes: gray level transformation, Histogram, processing, basic spatial filters and unsharp masking. The process of unsharp masking includes1) Blur the original image.
2) Subtract the blurred image from the original. 3) Add the difference to the original image.
Here linear unsharp filter is used to enhance the noisy image. With this visual effect will increase.
3.2
Image sharpening in frequency domain
There are number of methods for image enhancement in frequency domain i.e. sharpening frequency domain filters, smoothing frequency domain filter and Homomorphic filtering.In this section researcher is using Homomorphic fitter. A
The image is slightly blurry and many of its low intensity features are obscured.
4.
ASSESSMENT PARAMETER USED
FOR ANALYZING THE OUTPUT OF
THE ALGORITHM
There are number of parameters such as Noise Standard Deviation (NSD), Mean Square Error (MSE), Equivalent Numbers of Looks (ENL), and Peak Signal to Noise Ratio (PSNR) .Here PSNR and MSE are used to assess the algorithm
.[24]
4.1
Mean Square Error (MSE)
The Mean Square Error is used to find the total amount of difference between two images. It indicates average difference average difference of the pixels of throughout the image where K is the de noised image and I is the original image with noise. A lower MSE indicates that there is small difference between the original image with noise and de noised image. The formula is
21 0 1 0
)
,
(
)
,
(
/
1
m i n jj
i
K
j
i
I
mn
MSE
(5)
4.2
Peak Signal To Noise Ratio (PSNR)
To assess the performance of the noise removal method, PSNR is used. The formula is
MSE
PSNR
10
log
10255
2/
(6)5.
DISCUSSIONS AND CONCLUSION
Here the Image sharpening method is proposed. The microscopic image of Cyanobacteria with a size of 583 X 345 has been corrupted by two different type of noise at different variance and density, including Gaussian noise and salt pepper noise. In this section result are presented to illustrate the performance of algorithm. An original noise free image shown in figure 1 is given as reference. A quantitative comparison is performed between different techniques in terms of PSNR and MSE. Figure 2 and 3 shows the result of Cyanobacteria corrupted by noise at different density and variance.
The de-noising method is a median filter in spatial domain and Figure 4 show the noise free images. The de-noising method is Low pass filter in frequency domain and Figure 5 show the noise free image. The de-nosing effect of median filter on salt and pepper noise is much better than low pass filter on Gaussian noise.
It can be seen that visual effect of enhanced image of denoised image is better than enhanced image of noisy image Second, noisy image is sharpened using Homomorphic filter in the frequency domain and the result is shown in the figure 10,11,12,13. Figure 10 is enhanced image of Cyanobacteria which is corrupted by salt and pepper noise of different density and figure 11 is enhanced image of Cyanobacteria from which noise density is removed. Figure 12 is the enhanced image of Cyanobacteria corrupted by Gaussian noise with different variance and figure 13 is enhanced image of Cyanobacteria from which noise density is removed. Table 1A and 1B shows the comparison table of PSNR of different techniques. Table 2A and 2B shows the comparison table of MSE of different techniques Figure 12 show the comparison graph of PSNR and MSE of different techniques for Cyanobacteria.
The experimental result shows that de-nosing effect of median filter on salt and pepper noise is much better than low pass filter on Gaussian noise and if noise is salt and pepper then de-noising with sharpening in spatial domain is much better than in frequency domain for this type of images, microorganisms. Here analysis is done by putting different type of artificial noise on microorganism but the special attention is to classify the noise type in microorganism and select the appropriate de-noising and enhancement method according to different purpose. With this we will get better visual effect of noisy image.The method can help us to find special characteristics of microorganism.
It shows that the method proposed in the paper is effective for microbiologist in digital image processing . With this it will have high visual effect under signal enhancement approaches such as sharpening, histogram.
Table 1A. Comparison of PSNR of Different Techniques for Cyanobacteria
Table 1B. Comparison of PSNR of Different Techniques for Cyanobacteria Noise
Density
Median Filter without any sharpenening
Median Filter with UM
Median Filter with Homomorphic
Homomorphic Unsharp
Masking
10 33.4019 35.6980 22.2886 21.6443 16.2408
20 28.8281 29.5962 21.1609 19.9884 14.0375
30 24.0519 27.9781 20.3285 18.2484 12.3421
40 19.5160 22.8732 20.0348 16.9440 11.5085
50 15.6808 18.7064 19.8350 15.7440 10.5326
60 12.8002 16.4250 19.2911 15.2985 9.7804
70 10.4048 15.0521 17.6506 14.4442 9.1129
Noise with variance
GLP without Sharpening
GLP with Unsharp Masking
GLP with Homomorphic
Homomorphic Unsharp
Masking
0.01 20.0964 26.5355 11.1658 20.8558 17.9928
0.02 17.5340 24.5806 10.7645 20.7936 15.6781
0.03 15.9469 23.2628 10.3484 20.2712 14.5614
0.04 14.8717 22.3426 10.0490 19.9630 14.1444
0.05 14.0970 21.5192 9.7420 19.8866 13.3005
0.06 13.4392 21.0046 9.5617 18.6630 12.8971
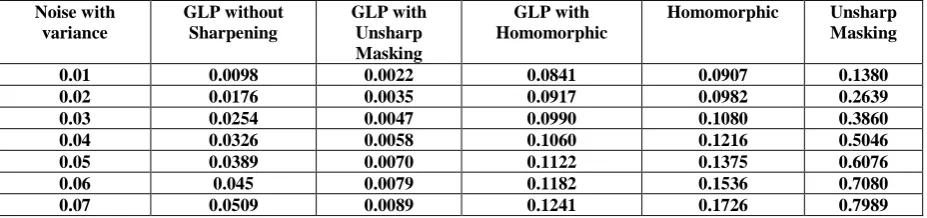
Table 2A. Comparison of MSE of Different Techniques for Cyanobacteria
Table 2B. Comparison of MSE of Different Techniques for Cyanobacteria
Noise Density
Median Filter without any sharpenening
Median Filter
with Unsharp Masking
Median Filter with Homomorphic
Homomorphic Unsharp
Masking
10 4.5688e-004 0.0088 0.1185 0.1640 0.3452
20 0.0013 0.0177 0.1533 0.2743 0.6765
30 0.0039 0.0573 0.1864 0.4350 1.0050
40 0.0112 0.1524 0.2411 0.6511 1.3268
50 0.0270 0.3289 0.3333 0.9784 1.6610
60 0.0525 0.5612 0.4947 1.3798 1.9752
70 0.0911 0.8859 0.8033 1.9395 2.3033
Noise with variance
GLP without Sharpening
GLP with Unsharp Masking
GLP with Homomorphic
Homomorphic Unsharp
Masking
0.01 0.0098 0.0022 0.0841 0.0907 0.1380
0.02 0.0176 0.0035 0.0917 0.0982 0.2639
0.03 0.0254 0.0047 0.0990 0.1080 0.3860
0.04 0.0326 0.0058 0.1060 0.1216 0.5046
0.05 0.0389 0.0070 0.1122 0.1375 0.6076
0.06 0.045 0.0079 0.1182 0.1536 0.7080
[image:4.595.67.531.526.635.2][image:5.595.237.298.74.217.2]
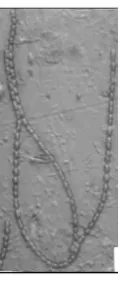
Figure 1 Original microscopic image of Cyanobacteria.
[image:5.595.85.484.277.422.2]
(a) (b) (c) (d)
Figure 2 Image Cyanobacteria corrupted by salt & pepper noise. (a) Noise Density 20% (b) Noise Density 30% (c) Noise Density 40% (d) Noise Density 50%
(a) (b) (c) (d)
Figure 3 Image Cyanobacteria corrupted by Gaussian noise. (a) Noise with variance 0.02 (b) Noise with variance 0.03 (c) Noise with variance 0.04 (d) Noise with variance 0.05
[image:5.595.92.482.494.662.2](a) (b) (c) (d)
Figure 4 De-noising by Median filter (a) De-noising image of figure 2(a) ,(b) De-noising image of figure 2(b) ,(c) De-noising image of figure 2(c) , (d) De-noising image of figure 2(d)
(a)
[image:6.595.71.500.340.514.2](b) (c) (d)
Figure 5 De-noising by Gaussian Low Pass filter (a) De-noising image of figure 3(a) ,(b) De-noising image of figure 3(b) ,(c) De-noising image of figure 3(c) , (d) De-noising image of figure 3(d)
[image:6.595.74.532.565.729.2](a) (b) (c) (d)
[image:7.595.66.491.74.240.2]
Figure 7 Enhanced image using unsharp masking filter on Gaussian denoised (a) Sharpen image of 5(a),(b) Sharpen image of 5(b),(c) Sharpen image of 5(c), (d) Sharpen image of 5(d)
(a) (b) (c) (d)
[image:7.595.61.504.308.474.2]
Figure 8 Enhanced image using Homomorphic filter (a) Sharpen image of 4(a),(b) Sharpen image of 4(b),(c) Sharpen image of 4(c), (d) Sharpen image of 4(d)
(a) (b) (c) (d)
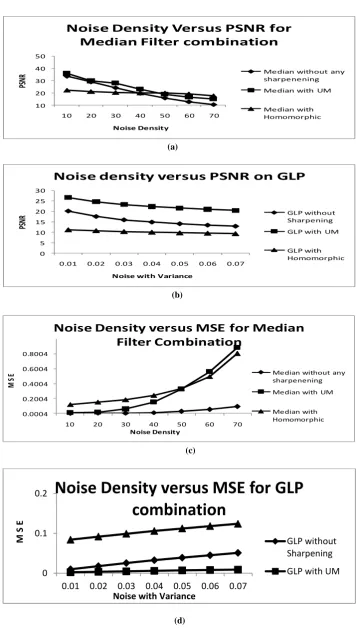
[image:7.595.59.492.537.695.2]10 20 30 40 50
10 20 30 40 50 60 70
PS
NR
Noise Density
Noise Density Versus PSNR for
Median Filter combination
Median without any sharpenening Median with UM Median with Homomorphic
(a)
0 5 10 15 20 25 30
0.01 0.02 0.03 0.04 0.05 0.06 0.07
PS
NR
Noise with Variance
Noise density versus PSNR on GLP
GLP without Sharpening GLP with UM GLP with Homomorphic
(b)
0.0004 0.2004 0.4004 0.6004 0.8004
10 20 30 40 50 60 70
M
S
E
Noise Density
Noise Density versus MSE for Median
Filter Combination
Median without any sharpenening Median with UM Median with Homomorphic
(c)
(d) 0
0.1 0.2
0.01 0.02 0.03 0.04 0.05 0.06 0.07
M
S E
Noise with Variance
Noise Density versus MSE for GLP
combination
GLP without Sharpening
[image:8.595.118.479.80.712.2]REFERENCES
[1] Russo.“An image enhancement technique combining sharpening and noise reduction,” Instrumentation and Measurement, IEEE Transaction on, 51(4), PP: 824 - 828, Aug.2002.
[2] G. Ramponi, N. Strobel, S. K. Mitra, and T. Yu,”Non linear unsharp masking methods for image contrast enhancement,” IEEE Transaction Electron Image, vol. 5, pp.353-366, July.1996.
[3] S.k.Mitra, T.H.Yu, and R. Ali,”Efficient detail-preserving method of impulse noise removal from highly corrupted images,” Proc.1994 IS&TISPIE Symp.Elec.Imaging: Science & Technology, San Jose, CA, February 1994-to be published.
[4] Rafael, C. Gonzalez., Richard E. Woods, Digital image processing, Third Edition, Publishing as Prentice Hall, 2011.
[5] Maria Petrou, Costas Petrau, Image processing The Fundamentals, Second Edition, Publishing John Willey & Sons Ltd, 2010.
[6] V. R.VijayKumar, S.Manikandan, D.Ebenezer, P.T.Vanathi and P.K.Kanagasabapathy. ”High Density Impulse noise Removal in Color Images Using Median Controlled Adaptive Recursive Weighted Median Filter,” IAENG International Journal of Computer Science, 34:1, IJCS_34_1_2
[7] Toshio FUKUDA, Osamu HASEGAWA,”Expert system driven image processing for recognition and identification of microorganisms,” International Workshop on Industrial Applications of Machine Intelligence and Vision (MIV-89), Tokyo, April 10-12, 1989.
[8] Nuhman Ul Haq, Khizar Hayat, Neelum Noreen, William Puech. “Image Sharpening by DWT-Based Hysteresis,” Advance Concepts for Intelligent Vision Systems, Volume: 6915, Publisher: www.springerlink.com, Pages: 429-436, 2011.
[9] G. Ramponi, "A Cubic Unsharp Masking Technique For Contrast Enhancement," Signal Process., Vol. 67, pp. 211-222, June 1998.
[10] Y. H. Lee and S. Y. Park, "A Study of ConvexlConcave Edges and Edge Enhancing Operators Based on the Laplacian," IEEE Trans. on Circuits Syst., Vol. 37, pp. 940-946, July 1990.
[11]N. Alajlan, M. Kamel, E. Jernigan, "Detail preserving impulsive noise removal ", Signal Process. Image Communication, Vol. 19, pp. 993-1003, 2004.
[12]Shujun Fua, Qiuqi Ruan, Wenqia Wang, Fuzheng Gao, Heng-Da Cheng,"A Feature-dependent Fuzzy
Bidirectional Flow for Adaptive Image Sharpening," Elsevier, Neuro Computing, Vol. 70, pp. 883-895,
October 2006. [13]T. L Economopoulos, P. A. Asvestas, G. K.
Matsopoulos. "Contrast enhancement of images using Partitioned Iterated Function Systems. " Image and Vision Computing, Vol. 28, pp. 45-54, 2010.3740
[14]Thomas Luft, Carsten Colditz, Oliver Deussen, "Image Enhancement by Unsharp Masking the Depth Buffer," IEEE Trans Image Processing,Vol. 15, pp. 3294 - 3301, November 2006.
[15]SHI Mei-Hong, ZHANG Ying. A new algorithm for image contrast enhancement [J]. Application Research of Computers, 2005, (1): 235-238.
[16]GAI Qiang. Research and application on the theory of local wave time frequency analysis method [D]. Dalian: Dalian University of Technology, 2001.
[17]U.Ranjith, P.Caroline, H.Martial. Toward Objective Evaluation of Image Segmentation Algorithms. IEEE Trans P.A.M.I., vol.29, no.6, pp.929~944, 2007. [18]A. Mike Burton, Rob Jenkins, Robust representations for
face recognition: The power of averages, Cognitive Psychology, vol.51, no.3, pp. 256~284, 2005.
[19]Jorge A. Silva Centeno, An Adaptive Image Enhancement Algorithm, Pattern Recognition, vol.30, no.7, pp.1183~1189,1997.
[20]S.S.Agaian, B.Silver, K.A.Panetta, Transform Coefficient Histogram-Based Image Enhancement Algorithms Using Contrast Entropy, IEEE Trans. Image Processing, vol.16 ,no.3, pp. 741~758, 2007.
[21] Lu Yuan, Jian Sun, Long Quan, and Heung-Yeung Shum, “Image deblurring with blurred/noisy image pairs,” ACM Trans.on Graphics, vol. 26, no. 3, 2007. [22]Marius Tico, Sakari Alenius, and Markku
Vehvil¨ainen,“Method of motion estimation for image stabilization,” in ICASSP, 2006, vol. 2, pp. 277–280 [23]Jean-Luc Starck, Emmanuel J. Candes, and David L.
Donoho,“The Curvelet Transform for Image Denoising,” IEEE Trans.on Image Processing, vol. 11, no. 6, pp. 670– 684, 2002.