2626
FUSING DATA RETRIEVED FROM HETEROGENEOUS
SOURCES TO PREDICT USER’S HEALTH
1G.RAMESH CHANDRA, 2A.KATYAYANI, 3N.SANDHYA
1
Professor, Department of CSE, VNRVJIET, India
2
M.Tech(SE) Student, Department of CSE, VNRVJIET, India
3
Professor, Department of CSE, VNRVJIET, India
E-mail: [email protected], [email protected], [email protected]
ABSTRACT
The information gathered from various sources is integrated to identify the risks associated with the user’s health. The main objective of employing fusion is to produce a fused result that provides the most reliable information about the health condition of the user. The proposed research aims to assess the health status of the user based on the frequency of usage of computers and mobile. It also investigates the association between the extent of computer and mobile usage and the related health disorders like strained vision, headache and backache. The findings confirmed that the health disorders occur simultaneously among prolonged computer users and mobile users.
Keywords: Data Fusion, Heterogeneous Data Sources, Health Disorders, Frequency Based Conditions
1. INTRODUCTION
The technology transition in mobile and computers makes human life comfortable and busier in addition to informative. Nowaday’s scenario is people cannot lead their life without internet, mobile phone, computer and various other electronic gadgets. The people having access to these devices have a lot to do, such as using mobile/computer for chatting, video/phone calling, gaming, shopping, browsing etc. There are a lot of adverse effects on human health due to excessive usage of mobiles/computers which makes an individual’s life miserable [2].
The use of computer has grown tremendously to the extent that today millions of people around the world are using it. With time, PC computing power increased, varieties of software become available at very nominal costs. Consequently, numerous studies have been conducted worldwide in an attempt to determine the nature and extent to which health hazards may occur due to the prolonged exposure to computer which covers a wide variety of health problems caused by or contributed by computer usage which are all unavoidable .
The most common reported medical
problems are eye strain, carpal tunnel syndrome, neck and back strain, conjunctivitis (itchy,
bloodshot eyes) dermatitis, etc., Staring at the monitor for extended periods can cause eyestrain. It leads to problems like headaches, fatigue, and blurring of vision, dizziness, tingling, burning, watering, double vision and other sensations are
eye problems associated with computer
managements. Major factors causing eyestrains when using computers are luminance, contrast, distance between eye and screen, and readability of the screen.
Based on the sitting posture, the user may suffer with the related health disorder like backache.A well-designed chair may favorably affect the posture, circulation and the extent of strain on the spine. The chair should be such that it must allow the feet firmly on the floor or a footrest should be used to support the feet. Most chairs used by computer users in properly designed computer facilities have adjustments to make them comfortable to sit on and therefore preventing back pains [11].
Journal of Theoretical and Applied Information Technology 30th June 2017. Vol.95. No 12
© 2005 – ongoing JATIT & LLS
ISSN: 1992-8645 www.jatit.org E-ISSN: 1817-3195
2627 public health problem as there have been reports of plenty of health hazards, both mentally aswell as physically. Inspite of some knowledge on unfavorable health effects, the usage of cell phones has increased dramatically as they have become more affordable and available all over the world.
Constant usage and sort of addiction to cell phones has affected the people physically and psychologically by making them have aches and pains and in some a disability too; It was observed that continuous usage, staring at the screen causes the eye strain. Eye strain is obvious due to focusing on the screen or due to continuous texting and playing games[12].
Most of the humans are interested in understanding these effects on self to maximize their own satisfaction. This requires having a better model of the individual life. Even the thick and thin would like to know how a user is addicted to these devices, so that they can notify him about his health condition. There were two issues related to the sociological and medical knowledge. They are the lack of objective data for individuals and the inability to utilize this data for building reliable models. Thus the major concern is related to privacy, the ability to measure data, store and analyze data.
Technology development had resulted in some major shifts in this area. People can also have an idea about their day to day regular activities by making use of sensors located in their devices. By analyzing the data retrieved from these sensors, we are able to identify the involvement of a user in a certain activity at a particular time. We can also understand a person’s reactions to a particular activity with the help of the sensors. The measurements taken from wearable sensors, GPS, social media, and other relevant sources are used to detect the actions performed in day-to-day life. Thus, we can effectively obtain a complete record of the person’s daily activities [1].
Data fusion is the process of combining multiple records representing the same real-world object into a single, consistent and reliable representation [3]. Data collected from mobile apps and computer applications is really influential. All data from mobile phones, computer usage and social networks are extracted and are unified from such heterogeneous streams to provide actionable insights [10].
In this paper we observe and analyze all data sources to get the individual’s health information through the help of Internet which made it possible and useful to access many different information systems to obtain information.
2. RELATED WORK
The proposed work aims to perform data fusion on the data gathered from multiple sources. The sources include computer logs, mobile logs and social media streaming data.The data which is been sourced is combined to a unified framework such that the user’s health condition can be predicted.
The main objective of this research is to:
• Identify the computer usage patterns
• Identify the mobile usage patterns
• Identify the social media streaming data
• To perform data fusion on all the
information retrieved from these sources.
2.1 Identifying Computer Usage Patterns
The computer usage history like browsing web, interacting with a document, watching videos, gaming etc., is been tracked and stored as Computer Logs. The user’s health status can be analyzed based on the actions performed by him on the computer [1]. A built in application is installed into the system such that it tracks the entire usage history of that system and provides that details in the form of logs. The usage data is been collected for a period of one month i.e., from July 4, 2016 to August 4, 2016. From this one-month data, we retrieved the activity logs from the user.
2.2 Identifying Mobile Usage Patterns
To collect data from user’s mobile devices,a mobile app needs to be installed to track the
complete mobile usage history like
Journal of Theoretical and Applied Information Technology 30th June 2017. Vol.95. No 12
© 2005 – ongoing JATIT & LLS
ISSN: 1992-8645 www.jatit.org E-ISSN: 1817-3195
[image:4.612.346.533.110.734.2]2629 assessing the risk to the user’s health can be estimated as low, medium or high.
Table 1: Frequencies of Computer Logs
Category Low Medium High
Education <2 hrs 2-5hrs >5 hrs
Browsing <1 hr 1-2 hrs >2 hrs
Entertainment <1 hr 1-2 hrs >2 hrs
Tools <2 hrs 2-5 hrs >5 hrs
3.3 Frequencies of Mobile logs
[image:4.612.89.304.125.219.2]The actions performed by the user on his mobile device are been recorded in the form of logs and are still distributed into various categories. Based on these categories, the frequency and the type of risk occurrence to the user’s health can be assessed.
Table 2: Frequencies Of Mobile Logs
Category Low Medium High
Call Duration 5-10 mins
11-30 mins >30 mins
Messaging (No.of SMS’s)
1-5 6-10 >10
Gaming 1-10
mins
11-30 mins >30 mins
Entertainment <30 mins 30-60 mins >1 hr
Browsing <30 mins 30-60 mins >1 hr
Tools <1 hr 1-2 hrs >2 hrs
4. EXPERIMENTAL RESULTS
4.1 Integrated Mobile And Computer Logs
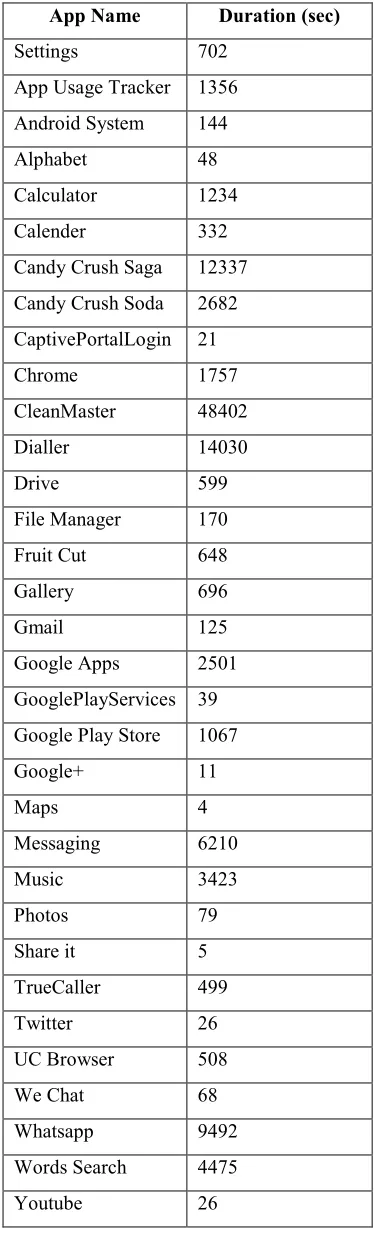
Once both the mobile logs and computer logs have been retrieved from the respective devices, the data is fused. The fused mobile and computer usage data along with their usage duration are integrated to one dataset which is represented in a tabular form in Table 3 and it is been plotted in a graphical form represented in Figure 3 below
Table 3: AppName vs Duration
App Name Duration (sec)
Settings 702
App Usage Tracker 1356
Android System 144
Alphabet 48
Calculator 1234
Calender 332
Candy Crush Saga 12337
Candy Crush Soda 2682
CaptivePortalLogin 21
Chrome 1757
CleanMaster 48402
Dialler 14030
Drive 599
File Manager 170
Fruit Cut 648
Gallery 696
Gmail 125
Google Apps 2501
GooglePlayServices 39
Google Play Store 1067
Google+ 11
Maps 4
Messaging 6210
Music 3423
Photos 79
Share it 5
TrueCaller 499
Twitter 26
UC Browser 508
We Chat 68
Whatsapp 9492
Words Search 4475
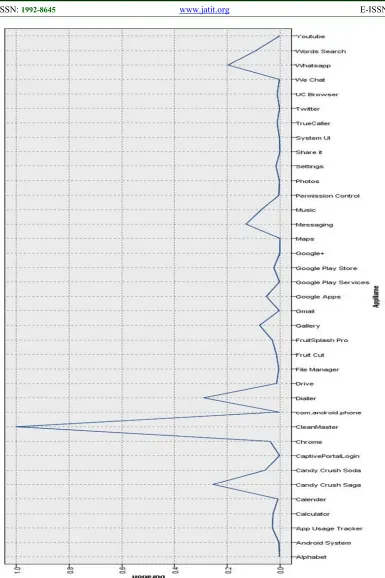
[image:4.612.91.304.335.476.2]2630
Figure 3: Plot of AppName Vs Duration
4.2 Data Fusion process
Based on the frequencies of computer logs and mobile logs the health risks have been
Journal of Theoretical and Applied Information Technology 30th June 2017. Vol.95. No 12
© 2005 – ongoing JATIT & LLS
ISSN: 1992-8645 www.jatit.org E-ISSN: 1817-3195
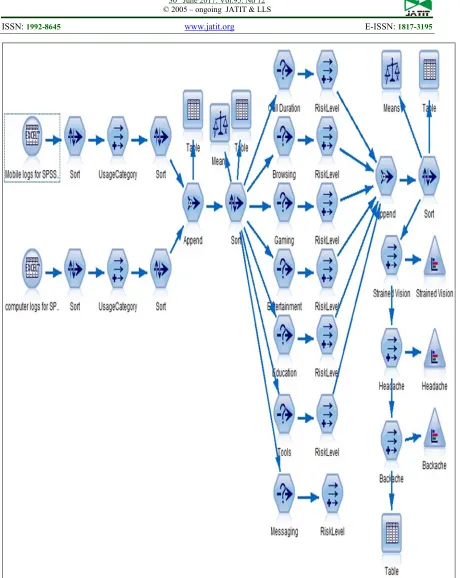
[image:6.612.89.549.52.630.2]2631
Figure 4: Deriving Risk Level From The Integrated Dataset
Once the data is been retrieved in the form of computer logs and mobile logs, they are been arranged in a sorted order and then the activities performed by the user are distributed into a set of categories and based on those categories, they are again sorted and then
integrated into a single dataset which is represented as shown in Figure.4
2632 After assessing the risk frequencies for each and every category, then the data is again integrated into a single dataset and is arranged into a sorted order. In this study, we assumed three types of risks like Strained Vision, Headache and Backache. Finally from the
integrated dataset, we assess the frequency of risk and the type of risk to be occurred on the health of a user by defining certain conditions.
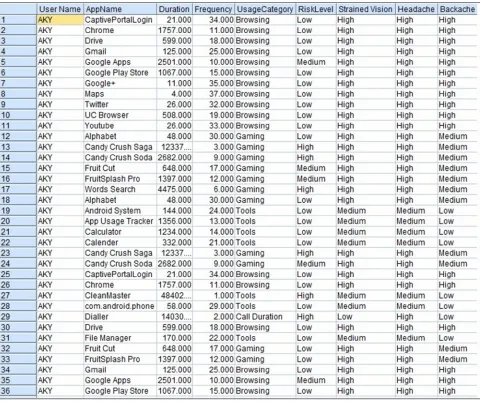
4.3 Prediction of user’s health:
[image:7.612.95.575.240.642.2]Depending on the device usage and the categories of usage, of health risks are been estimated which is represented in the Table 4 below.
Table 4: Estimated Type Of Risk And Level Of Risk For The User’s Health.
4.4 Frequency of occurring strained vision for the user
Due to the prolonged use of computer, the user may suffer with the computer usage related health disorder like strained vision and the frequency of this risk is been estimated as low,
Journal of Theoretical and Applied Information Technology 30th June 2017. Vol.95. No 12
© 2005 – ongoing JATIT & LLS
ISSN: 1992-8645 www.jatit.org E-ISSN: 1817-3195
[image:8.612.90.296.69.225.2]2633 Figure 5: Risk Frequency Of Occurring Strained
Vision For The User
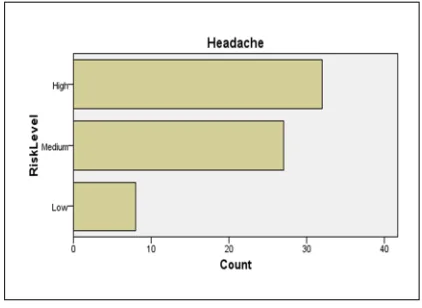
4.5 Frequency of occurring Headache for the user:
Due to the overuse of mobile, the user may suffer with the related health disorder like headache and the frequency of this risk is been estimated as low, medium and high based on the amount of time the user had spent on performing various activities like making/receiving calls, sending/receiving messages, interacting with different apps like gaming, browsing, watching videos, playing music etc., on the device per day. The resultant graph showing the level of risk based on the duration is as follows.
Figure 6: Risk Frequency Of Occurring Headache For The User
4.6 Frequency of occurring Backache for the user
Depending on the computer usage and the duration the user had spent on it and also based on the sitting posture, the user may suffer with the related health disorder like backache and the frequency of this risk is been estimated as low, medium and high based on the amount of time the user had spent on working with the
[image:8.612.323.529.136.265.2]computer per day. The resultant graph showing the level of risk based on the duration is as follows.
Figure 7: Risk Frequency Of Occurring Backache For The User.
5. CONCLUSION
Both high and medium computer use was a risk factor for backache and Strained vision. High frequency of mobile phone use was a risk factor among the young adults which leads to headache. Thus, this research concludes with the frequencies and type of risks associated with excessive usage of computer and mobile through which the user’s health condition is been predicted.
The limitation of this research is, integration of data is performed only on computer and mobile logs but not on social media data through which only a single user’s health status can be identified but not the public health.
The future work to be carried out is to integrate the Social media data also with the mobile and computer logs such that we can predict the public health.
REFERENCES
[1]. Ramesh Jain and Laleh Jalali, “Objective Self”, IEEE MultiMedia, Volume.21,Issue.4, Oct.-Dec. 2014.
[image:8.612.89.300.426.580.2]2634 [4].Aaron Beach, Mike Gartrell, Xinyu Xing,
Richard Han, Qin Lv Shivakant Mishra, Karim Seada, “Fusing Mobile, Sensor, and Social Data To Fully Enable Context-Aware Computing”, Proceedings of the Eleventh Workshop on Mobile
Computing Systems & Applications Pages 60-65. [5]Adam Sadilek, Henry Kautz, Vincent Silenzio,
“Predicting Disease Transmission from Geo-Tagged Micro-Blog Data”, Proceedings of the Twenty-Sixth AAAI Conference on Artificial Intelligence.
[6].Abhishanga Upadhyay, Luis Mao, Malavika Goda Krishna. Mining Data from Twitter.
[7]Thomée S1, Härenstam A, Hagberg
M.“Computer use and stress sleep
disturbances, and symptoms of depression among young adults--a prospective cohort
study”, BMC Psychiatry2012,12:176
http://www.biomedcentral.com/1471-244X/12/176.
[8]Sara Thomée, Annika Härenstam, and Mats Hagberg. Mobile phone use and stress sleep disturbances, and symptoms of depression among young adults - a prospective cohort study”, BMC Public Health 201111:66DOI: 10.1186/1471-2458-11-66.
[9]Federico Castanedo. “A Review of Data Fusion Techniques”, The Scientific World Journal Volume 2013 (2013), Article ID
704504, 19 pages.
http://dx.doi.org/10.1155/2013/704504 [10]Surender Reddy Yerva, Hoyoung Jeung, Karl
Aberer. Cloud based Social and Sensor Data Fusion”, Information Fusion, 2012 15th International Conference on Information Fusion.
[11] V. P. Mvungi, J. Mcharo, M. E. Mmbuji, L. E. Mgonja, and A. Y. Kitua.“Health Hazards Related to Computer use: Experience of the National Institute for Medical Research in Tanzania”.