Munich Personal RePEc Archive
Does motor voter work? Evidence from
state-level data
Knack, Stephen
World Bank
July 1993
DOES "MOTOR VOTER" WORK? Evidence from State-Level Data
(revised version published in Journal of Politics, Vol. 57, no. 3, pp. 796-811)
Abstract
Using time-series cross-section data on state-level registration and turnout, "motor voter"
registration programs mandated by the National Voter Registration Act are found to be effective in enhancing voter participation in the states that have already adopted them. A "duration"
specification for motor voter is introduced as an alternative to a simple dummy variable specification, as the typical length of states' driver' s license renewal cycles implies that not all drivers have had an opportunity to register via motor voter until several elections after
implementation of the program. Registration effects are estimated to reach about 13 percentage points, with a turnout impact of roughly half of that level. As very few states to date have "mature" programs in effect, most of this potential impact of motor voter has yet to be realized. Little evidence is found that mail-in or agency registration, also mandated by the NVRA, affect participation rates.
Stephen Knack* School of Public Affairs The American University
July 1993
I. Introduction
Despite the abolition of poll taxes and literacy requirements in the mid-1960s, the drastic reduction of residency requirements in the early 1970s, and relaxation of other registration requirements, voter turnout in recent U.S. presidential elections has been substantially lower than in the 1950s and 60s. This decline in presidential-year voting turnout -- partially reversed in the 1992 election -- led to increased support among lawmakers for further registration reforms designed to stimulate greater participation. These efforts culminated in passage of the National Voter Registration Act (NVRA), signed into law by President Clinton on May 20, 1993.1
The NVRA mandates, for all states without election-day voter registration, the establishment of mail-in and agency-based registration programs, and eliminates the purging of registrants solely for nonvoting. A last-minute provision inserted by congressional Republicans requires armed forces recruitment offices to offer voter registration. The key feature of the NVRA, however, is the "motor voter" provision for registering drivers' license applicants, which is widely expected to have the greatest potential for adding new names to the voter rolls. The NVRA requires that "each State shall include a voter registration application form for elections for Federal office as part of an application for a State motor vehicle driver' s license." A single combined form may be used; where two forms are used, the voter application form must be automatically supplied with the driver' s license application, and may require only a minimal amount of information from the applicant.
This paper analyzes state-level registration and turnout over the 1976-1992 period, finding strong evidence that the motor voter programs currently in effect in many states have succeeded in raising registration and turnout levels. The NVRA mandates "active" motor voter programs, in which all driver' s license applicants are offered an opportunity -- either orally by office personnel or by a question on the drivers license application or renewal form -- to register to vote. These
programs are found to be particularly effective in registering voters, in contrast to "passive" motor voter programs prevailing in some states, by which voter registration forms are merely available on countertops or upon specific request by a driver' s license applicant.
Most states require renewal of a driver' s license only every 3 to 5 years, or even longer for some states. Because of this lengthy driver' s license cycle, motor voter programs are distinguished by their age in this study. Evidence is found that the maximum impact of motor voter on registration rates is not felt until at least several elections subsequent to its implementation.
Mail-in registration shows few signs of working, confirming the findings of others (e.g., Teixeira, 1992). No evidence is found for the proposition that agency-based registration systems have increased registration or turnout in the states in which they have been in effect. The absence of provisions for purging registrants solely for nonvoting is associated with higher registration rates under some model specifications, but no turnout effects are found, suggesting that purged names represent primarily "deadwood" registrants who are deceased or no longer residing in the jurisdiction.
II. Data and Methodology
A previous analysis of motor voter and mail-in programs over the 1972-88 period by Crocker (1990) found mixed results: motor voter states had somewhat higher registration and turnout than non-motor voter states, but presidential-year turnout continued to decline in a majority of motor voter states following implementation of the programs. Mail-in provisions were found to be associated with reduced registration and turnout, in either a with/without comparison of states or a before-and-after analysis of states adopting mail-in registration.
participation rates.2
For example, states of the Old Confederacy have long had substantially below-average voting rates. Because North Carolina was the only southern state with motor voter during the period covered by Crocker' s analysis3
, a simple comparison across groups of states with and without motor voter may greatly exaggerate its apparent impact. As Crocker (1990, p. 8) cautions: "Such a comparison makes the assumption that the only differences among the states, relevant to registration and turnout rates, are the voter registration systems."
A simple before-and-after comparison of participation rates in states adopting new programs contains similar flaws to the simple comparisons across groups of states. As Crocker (1990, p. 7) notes, his before-and-after analysis showing a turnout decline in states adopting motor voter "assumes that no other major changes, which can affect registration and turnout, are taking place at the same time." Perhaps the adoption of motor voter in certain states prevented their turnout rates from falling even further than they actually did.
The present study adopts Crocker' s basic approach of estimating the future impact of the NVRA on voter participation, making use of the fact that most of the key provisions required by the NVRA have already been widely -- but not universally -- implemented by state law. Thus, participation rates in state-year observations with a particular provision in place can be compared to those in the "without" state-year observations. This study, not being constrained methodologically -- as was Crocker' s -- by the requirement of being comprehensible to our elected officials, employs standard regression techniques by which regional and state-specific effects can be controlled for.
State-level data on registration and turnout rates for the period 1976-1992, collected by Elections Data Services, are used to test the effects on participation rates of liberalized registration
2Crocker's study was intended for a lay readership of congresspersons and their staffs.
3North Carolina adopted and implemented motor voter prior to the 1984 election, but thereafter the program was
procedures contained in the NVRA. With nine national elections held over this period, there are nine observations on each state for both registration and turnout.4
Pooled time-series cross-section models are employed, with state and year dummy variables. These procedures combine the advantages of before-and-after comparisons with those of with-and-without analysis, and eliminate the major disadvantages of each: differences across states, and within each state over time, can be controlled for. For each election years between 1976 and 1992, each state is coded for whether or not motor voter, mail-in registration, etc. were in effect at the time.5
Numerous factors in addition to registration laws that may influence electoral participation rates are controlled for. Dummy variables for the presence of Senate and gubernatorial races on the ballot are included, as is the proportion of the state' s seats in the House of Representatives that are contested by both major parties. The competitiveness of the presidential election is represented in turnout equations by the state' s vote margin separating the two major party candidates.6
Economic conditions may affect voter participation through various channels (e.g., see Rosenstone, 1982). Per capita income and unemployment are thus included in the registration and turnout models.
Demographic variables such as residential mobility, percent homeowners, percent college or high school graduates, and median age of a state cannot be included here because of limited data
4The District of Columbia is included as a state. Elections Data Services does not provide registration data for
North Dakota and Wisconsin, as the former and some rural counties in the latter do not require registration. These states are omitted in analyses of registration, yielding an N of 441 (51*9 - 9*2). North Dakota is also omitted from turnout analyses, as several key independent variables -- mail-in, motor voter, etc. -- are not meaningful for a state without registration. Louisiana had no general elections in 1978 or 1982, yielding an N of 198 (51*4 - 4 - 2) for midterm turnout, and 250 (51*5 - 5) for presidential turnout analyses.
5The appendix lists the programs in effect in each state as of the 1992 election.
6Cox (1988) explains why this measure is preferable to the percentage vote margin. Results are not
availability, as the Census Bureau collects these state-level data only every ten years. However, to the extent that the relative values of these demographic variables change only slowly over time across states, their effects on voter participation will be largely captured by state dummy variables.7
To the extent there are nationwide trends--for example, in average education--they will be largely captured by the year dummies.
Most previous regression analyses of turnout and registration employ a single cross-section of data. This study uses a "least-squares dummy variables" or "fixed-effects" approach, in which state dummy variables are included to net out state-specific constant-over-time influences that, in tests of a single cross-section of data, may bias the estimated effects of registration laws by influencing turnout levels and the passage of relaxed registration requirements.
Even in analyses of survey data, unmeasured state effects may lead to biased coefficient estimates in a single cross-section, as acknowledged by Teixeira (1992, pp. 122, 124). For example, when the state-level turnout rate is coded into survey data, this variable remains a powerful predictor of individual-level turnout despite inclusion of a wide variety of state-level electoral provisions and individual-level demographic and attitudinal measures in the model. 8
Registration closing date is illustrative of the endogeneity problems in cross-sectional turnout studies. Registration and turnout are almost invariably shown in cross-sectional analyses to be strongly and inversely correlated with the number of days before election day that the registration rolls are closed: the sooner in October (or November) the deadline for registering is, the fewer
7
Certain registration provisions such as evening and Saturday registration, regular registration office hours, and allowing deputy registrars are not included in the model due to some indications the available data are not sufficiently reliable over the full period considered here. These provisions appear to have changed relatively little since 1976, so that fixed state effects will capture most of their impacts (which appear to be minor in cross-sectional studies; e.g., see Teixeira, 1992, pp. 122-3). Residency requirements were drastically reduced in the early ' 70s, have changed very little since 1976, and apparently have little remaining impact on participation following their reduction (Conway, 1981).
registrants there are.9
Crocker (1989, p. 12) notes that turnout in states permitting registration on election day (i.e., a closing date of zero) exceeded that in states without election-day registration by 12 to 14 percentage points in each of the 4 presidential elections between 1976 and 1988. However, as Crocker points out, "the particular states with election day voter registration systems have always been higher turnout states" and turnout in fact declined in these states as a group following the adoption of election-day registration. State-level turnout and the adoption of liberal registration practices could conceivably both be related to some underlying cause which studies have not been able to quantify, such as a relatively strong "participatory culture."10
If so, the apparent effects of closing date on registration and turnout will be exaggerated in simple cross-sectional analyses, by capturing part of the impact of the unmeasured underlying variable. To the extent that any such unmeasured underlying factors are roughly constant over the period studied, a pooled time-series cross-section design with state dummy variables will net out these state effects that otherwise bias the coefficient of closing date.
Other sources of endogeneity may conceivably bias the coefficients of certain variables in the opposite direction. For instance, using 1990 NES data one finds participation rates are lower in states that declare election day a state holiday.11
While participation could be reduced by people taking advantage of the holiday to leave town,12
it is at least as likely that many states that have made
9E.g., see Wolfinger and Rosenstone (1980), Boyd (1986), and Teixeira (1992), all of which employ survey data
on turnout; Kelley, Ayres and Bowen (1967) obtain a similar finding for closing date with city-level registration data.
10States closing voter registration books earlier tend to have lower mail-in response rates for the 1990 U.S.
Census, while states with motor voter programs tend to have higher census response rates (along with higher per capita incomes). There is of course no direct causal relation between census response (or other forms of non-electoral citizen participation) and electoral laws, but the fact they are correlated indicates some unmeasured variable may account for both.
11Results available on request from the author.
election day a holiday have done so partly out of concern over poor turnout rates.
This analysis follows Crocker' s in differentiating "active" motor voter programs from "passive" programs, and extends this distinction to mail-in programs. Previous studies treating mail-in as an either/or proposition (e.g., Wolfinger and Rosenstone, 1980; Mitchell and Wlezian, 1989; Crocker, 1990) overlook potentially important differences in the administration of mail-in registration systems across states. For example, the forms are available at post offices, libraries and elsewhere in certain states, but not in others, and the programs are more heavily publicized in certain states than in others. Many states require mail-in forms to be notarized and/or witnessed. "Active" mail-in programs are here defined as those requiring neither the witnessing nor the notarization of mailed registration forms, while "passive" programs require either or both. The choice of this characteristic to differentiate active from passive programs is dictated in part by data availability: there is much less information available on how widely the various states distribute mail-in forms than there is regarding witnessing and notarization requirements by states. The distinction can also be defended on grounds of policy relevance, however, as NVRA backers believed anything more than self-attestation would substantially weaken the effectiveness of mail-in. They succeeded in including a stipulation that mail-in forms "may not include any requirement for notarization or other formal authentication," such as witnessing (Public Law 103-31, 103d Congress), despite strong objections among opponents in Congress concerning the added potential for fraud. If such requirements are burdensome, then the states with "active" mail-in should show higher registration and turnout, other things equal, than "passive" mail-in states, which in turn are hypothesized to show higher participation rates than states with no mail-in programs at all.
"Active" motor voter states are defined as those in which applicants for driver' s licenses are asked either by employees, or via an item on the application form, if they wish to register to vote. This definition is consistent with the version of motor voter required by the NVRA.
available on tables or countertops or upon specific request by patrons. These programs are coded for the states over the 1976-92 period using information provided by the 100% VOTE project of Human Serve (an organization advocating and assisting states with registration reform), Congressional hearings reports, and state election administrators.13
As with mail-in programs, the expectation is that registration in states with active programs, controlling for other influences, exceeds that in passive states, which should in turn show higher rates than states with no motor voter programs at all.
In addition to adopting the active-passive distinction employed by Crocker (1990), this study introduces a "duration" rather than a dummy specification of motor voter programs. In contrast to other registration provisions, not everyone in a state is immediately influenced by motor voter. Driver' s license renewal cycles last up to 6 years or more in some states. Thus, the impact on registration and turnout should increase with time, at least for the first few elections following the implementation of the program. "Motor duration" is defined as the number of consecutive elections, presidential and midterm, including the "current" election, for which an active motor voter program has been in effect. For example, Michigan implemented motor voter in 1975 and is coded 1 for 1976, 2 for 1978, etc. Beyond some point, say, 6 or 8 years, all but new driver' s license applicants will have been exposed to motor voter, and its impact will stabilize. The square of "motor duration" is included in regressions to capture this expected levelling-off pattern.14
Agency-based registration programs can in principal be categorized as "active" or "passive" just as with motor voter. However, there were no agency-based programs in which all patrons were asked by employees or on application forms if they wished to register until Minnesota adopted such
13Codings differ in some instances from Crocker's (1990), as 100% VOTE documented several errors in his
classifications.
14The log of "motor duration" might appear a preferable specification, as the squared term allows the impact to
a program prior to the 1988 election, and there were still very few as of the 1992 election. Because of this lack of variation in the data, separate variable for active and passive agency-based programs cannot be reliably tested, and a single variable will thus be included to represent all agency-based programs.
III. Effects of NVRA Variables on Participation Rates
The effects of NVRA provisions on both registration and turnout rates are examined in this analysis. Registration laws influence turnout only indirectly through their impact on the decision to register. From a statistical point of view, registration is thus the preferred dependent variable. As turnout is one step removed from the registration decision, there is more potential for noise to be introduced in analyzing the effects of registration laws if turnout is instead used as the dependent variable.15
Turnout may nevertheless be a useful check on results obtained from looking at registration rates, because of the possibility that state dummy variables and purge laws fail to fully capture differences in the proportion of "deadwood" on the registration rolls in state-level data. Deadwood registrants -- those who are deceased or who have moved and may be registered elsewhere, whose names nevertheless remain on the books -- comprise on average 10 to 15 percent of the names on the official state registration rolls, with this percentage believed to vary widely across the states (Piven and Cloward, 1989, p. 582). Estimating effects on turnout directly as well as on registration is also advisable because it is not clear that finding sizeable effects on registration rates would imply anything about turnout effects: people registering via motor voter who would otherwise not register won' t necessarily show up at the polls on election day. Effects on turnout cannot be estimated simply through multiplying the registration increase by the percentage of registrants who currently vote, as marginal registrants may vote at rates substantially below those of
the average registrant (for evidence from California, see Cain and McCue, 1985). The District of Columbia found that nearly 60% of registrants who had registered by traditional means voted in the 1990 elections compared to only 30% turnout among those who had registered via motor voter.
Advocates of the NVRA have predicted that registration rates would exceed 90% or even 95% with motor voter, mail-in, and agency registration fully implemented. These forecasts assume that virtually everyone reached by these programs will choose to register; empirical analyses such as this one would thus only need to examine turnout effects, as the only interesting question would then be how many of the new registrants actually show up at the polls. Anecdotal and statistical evidence indicates, however, that many Americans fail to register not merely because of the inconvenience, but also out of fear that their registration information will be used for juror selection and other non-electoral purposes (Knack, 1992, 1993). For citizens intent on avoiding jury duty, making it easier to register via motor voter or other programs will obviously be ineffectual until the use of registration lists for juror selection purposes is abandoned. Near-universal registration following passage of the NVRA cannot be assumed, therefore, as long as many state and federal courts choose jurors primarily from voter registration rolls.
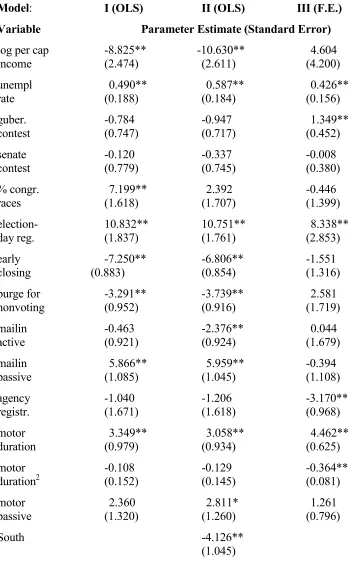
Table 1 presents results for state-level registration rates covering the 9 elections occurring over the 1976-92 period. The dependent variable is registrants as a percentage of a state' s voting age population (VAP).16
Models I and II in Table 1 are pooled time-series cross-sections with year dummies; the fixed effects regression in Model III adds state dummy variables (the coefficients for the state and year dummies are not shown in tables for reasons of space). These state dummies are intended to capture the effects of unquantifiable (or, at least, unquantified) state-specific
16Results using the logistic transformation of registration (and turnout), which confines predicted rates to the
0%-100% interval, are nearly identical in terms of both statistical significance and quantitative importance. Untransformed participation rates are analyzed here so that estimated coefficients can be directly interpreted as percentage impacts.
time-invariant influences such as differences in "participatory culture" across states.
Model II adds two variables in an attempt to measure some of these "cultural" differences: other things equal, registration in southern states17
is about 4.1 percentage points below the levels of other states, and each one point increase in state-level mail-in response rates to the 1990 U.S. Census is associated with a nearly one-third of a point rise in the registration rate. With a Census response range from 49.6% for Alaska to 76.5% for Wisconsin, state differences in "civic duty" -- or whatever else Census response may be capturing -- can account for turnout differences of 8 or more percentage points across the states.18
Controlling for "South" and census response in Model II adds only modestly, however, to the explanatory power of Model I: 51 percent of the interstate variation in registration rates is accounted for by the variables in the model, rather than 46 percent. Adding state dummy variables, in Model III, dramatically improves the R2
to .90.19
Model III is arguably the preferred specification,
17Defined as the former members of the Confederacy; results are nearly identical using the more expansive
Census definition.
18Census response figures are as of April 27, 1990, just prior to the beginning of field enumeration efforts. The
national response rate was 63%. The zero-order correlations between 1990 state-level census response and turnout for 1992, 1988, and 1984 respectively are .40, .56, and .49 (all significant at .01). Correlations with midterm turnout for 1990 and 1986 with Census response are positive but not significant. "South" and census response each retain strong significance in voter participation equations, despite the fact that Virginia is the only former Confederate state with an above-average census mail-in rate (68.4%). The South averaged more than 4 points lower than the non-South (significant at .01).
19The fixed effects model estimates the impact on registration of changes over time in the values of the
therefore, for purposes of analyzing the effects of electoral provisions--at least, for those exhibiting substantial change over the sample period.
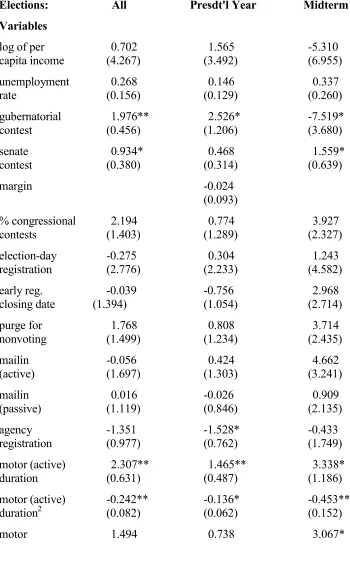
Table 2 presents turnout results for fixed effects models for the 9 elections combined, the 5 presidential elections, and the 4 midterm elections.20
The model differs from the registration fixed-effects specification only in including a "closeness" variable, the state' s vote margin between the two major party presidential candidates, for the presidential elections equation.
A. Motor Voter
Controlling for South and census response somewhat diminishes the "motor duration" coefficient in the registration equation, as anticipated (compare Models I and II in Table 1). Part of the higher registration rates associated with motor voter turns out to be an artifact of motor voter states being almost exclusively non-Southern states. Controlling for state effects (Model III), the "motor duration" coefficient increases while the squared term attains statistical significance.21
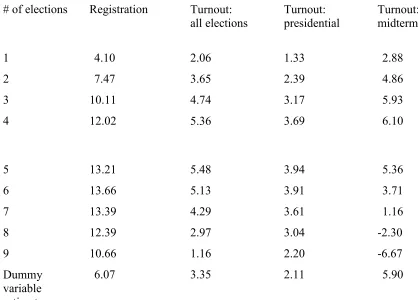
Table 3 indicates how the impact of "active" motor voter on participation rates cumulates over time. As expected, the percentage-point impact on turnout is found to reach its maximum by the 4th or 5th election following implementation. For registration, the peak is reached at the 6th election following implementation. While turnout effects appear to turn sharply downward past the
20The pooling of presidential with midterm elections is somewhat dubious with turnout -- which rises in
presidential years much more than does registration -- as the dependent variable. While year dummies will pick up the surge effects associated with the presence of a presidential election on the ballot, the implicit assumption is that the participation effects of the other independent variables -- such as the presence of a Senate race on the ballot -- remain constant from midterm to presidential years. Clearly, the structure of the turnout equation may in fact differ substantially from one case to the other: e.g., the presence of a Senate or gubernatorial race on the ballot may be of little consequence for turnout in presidential years if most people interested in these races are planning to vote in the presidential contest anyway.
21Iowa' s motor voter program registers only first-time driver' s license applicants, not renewals. Re-coding
6th or 7th election, estimates for 6 or more elections are largely out-of-sample extrapolations, as Michigan was the sole "active" motor voter state until prior to the 1984 election. Estimates for the 4th or 5th election are thus likely the most appropriate for gauging the performance of motor voter.
Employing a simple dummy variable specification for motor voter, as in Crocker (1990), underestimates the impact of these programs, due to their newness in many states. For registration, the dummy variable substitute for "motor duration" and "motor duration2
" indicates a mere 6.1 percentage-point impact on registration, as opposed to the 13-plus points indicated by the duration specification (see Table 3). For turnout for all 9 elections, and for the subset of presidential elections, the dummy version also understates the efficacy of motor voter. When differences in the age of motor voter programs across states are taken into account, the estimated presidential-year turnout impact rises from 2.1 percentage points to nearly 4 points. While even the duration-based estimates are perhaps disappointingly modest for the more optimistic advocates of registration reform, they reject the not uncommon view that participation is insensitive to how convenient the process of registering is. They also reject the skeptical view that most registrants signed up via motor voter won' t bother to turn out on election day; these estimates suggest that roughly one-half of them will.
An unexpected result is the larger estimated impact on midterm than on presidential-year turnout (Tables 2 and 3). On the surface, this finding may appear plausible, as there is a larger pool of nonvoters in midterm elections that may be affected by a new stimulus to vote. However, motor voter affects turnout only through registration; if these new registrants are at all similar to other registrants, they can be expected to vote more frequently in presidential than in midterm elections. No explanation is offered here for the inability to confirm these expectations.
(Table 2), contrasted to 5.9 points for a dummy specification of "active" motor voter (Table 3). In other turnout -- and even registration -- equations, the impact of "passive" motor voter falls short of 3 percentage points. A duration-based specification for passive motor voter does not substantially raise its estimated impact on participation.
B. Mail-in Programs
The case of mail-in registration provisions provides a striking illustration of the influence of state dummies as controls. In Model II of Table 1, the active version of mail-in appears to reduce registration by about 2.4 percentage points, while the passive version (requiring notarization and/or witnessing) increases it by 6 points. The inclusion of state dummies in Model III eliminates these counterintuitive findings, and leaves neither of the mail-in coefficients statistically different from 0. In turnout equations, mail-in also exhibits little evidence of raising voting participation. As with motor voter, many states adopted mail-in programs over the 1976-92 period; the poor showing of mail-in is thus not merely a matter of having little within-state variation for the variable in the sample.
These findings are consistent with those of several previous studies demonstrating the limited effectiveness of mail-in registration (e.g, Crocker, 1990; Teixeira, 1992). When observations are weighted by voting-age population (VAP), however, active mail-in programs appear more efficacious: the registration impact (fixed-effects model) rises to a statistically significant 3.5 points, while the presidential turnout effect rises to a (significant) 2.2 points. What importance should be attached to this result is debatable; while the California observations arguably contain more information than the Vermont observations, they surely do not contain anything like 40 times as much information.
availability of mail-in forms across the states. In an attempt to measure the distribution of these forms, mail-in provisions were interacted with agency registration, on the assumption that the forms are more easily obtained in states with registration forms accessible in various government offices serving the public. The NVRA, in fact, requires that agencies providing public assistance and disability services distribute such forms. These tests, however, found no enhanced impact of mail-in associated with this proxy for availability of forms.
"Active" motor voter states tend to also have mail-in programs: 54% of the state-year observations with active motor voter had mail-in registration, either active or passive, compared to 43% of states without active motor voter (difference is significant at .06 for 2-tailed test). Any potential effects of mail-in thus may be obscured by motor voter; where motor voter is registering large numbers of people, mail-in may add little to the registration rolls. Regression coefficients for mail-in therefore may underestimate its effects in a non-motor voter state. However, tests of a motor voter/mail-in interaction term show no support for such a conjecture.
C. Agency Registration
Previously, agency registration has been examined only in a cross-sectional test using 1988 CPS data, in which Teixeira (1992) found it increased the likelihood of voting by 1.2 percentage points.22
Similarly modest evidence for the efficacy of agency registration is found in the current study. Its coefficient is negative in all 6 equations in Tables 1 and 2, significantly so in some cases. VAP weights reduce the magnitudes of these coefficients, leaving them statistically insignificant, but fail to turn them positive. In principle, agency programs can be differentiated along "active" and "passive" lines, as with motor voter. Unfortunately, too few active programs -- those roughly corresponding to the requirements of the NVRA -- were in effect in the sample period to reliably
22Knack (1993) finds a significant and positive impact for an agency dummy for a state-level fixed effects
estimate the differential effects. These results thus do not provide a sufficient basis for concluding that agency programs established under the NVRA will fail to significantly influence participation rates.
D. Purging for Nonvoting
The NVRA bans purging voters solely for not having voting for some specified period of time or number of elections; there must be in addition some evidence that a registrant has moved before he or she can be deleted from the rolls. Over the 1976-92 interval, states with provisions for purging registrants failing to vote in a period of time show indications of lower registration rates, in the equations without state dummies (Models I and II, Table 1). As few states changed their purging provisions over the 1976-92 period -- in sharp contrast to motor voter, mail-in, and agency programs -- this variable is perhaps better tested by Models I and II than by Model III, the fixed effects specification. Models I and II indicate purging provisions are associated with a 3 to 4 point drop in registration rates.
In turnout equations, even in models without state dummies, the purge variable coefficient is generally smaller and often not significant, suggesting that most purged nonvoters have either moved or died. Particularly with motor voter in place, when most would-be voters have an opportunity to register at extremely low cost at least once every several years, purging names from the rolls after 4 to 8 years of nonvoting (the typical periods specified in current purging provisions) should have no more than trivial effects on turnout.
E. Registration Closing Date
prior to election day.
In models without state dummies, early closing is estimated to reduce registration by about 7 points, while election-day registration appears to raise it by 11 points, relative to states in the reference category (Table 1). The inclusion of state dummies reduces these estimates by 2 to 3 percentage points, consistent with Crocker' s observations regarding the already-high participation rates of states that subsequently adopted election-day registration. However, these fixed-effects estimates -- as well as those in Table 2 indicating virtually no turnout effects of closing date -- are based on very little within-state variation. Only Oregon abandoned election-day registration during the period, while no state adopted it. All of Oregon' s registration figures subsequent to dropping election-day registration prior to the 1986 election fall short of even its lowest figure for the 1976-84 period; its turnout has not fallen, however, resulting in a significant negative coefficient for the election-day variable in the registration equation but not in the turnout equation.
Coincidentally, the three largest positive state effects in the presidential turnout equation are for Minnesota, Maine, and Wisconsin -- the only 3 states with election-day registration over the entire 1976-92 period. This result may lead one to suspect that the fixed-effects model underestimates the turnout effects of election-day registration. Yet, these state effects may well be capturing, at least in part, some underlying third factor or set of factors responsible for both high turnout and the introduction of election-day registration in the early 70s.
The NVRA requires the implementation of motor voter, mail-in programs, etc. only in states closing the registration rolls prior to election day; states could thus avoid these requirements by permitting election day registration. Due to limited variability in the data, coupled with strong evidence of substantial unmeasured state-specific effects on the other, it is difficult to evaluate with much confidence the impacts on participation rates of election day registration, for comparisons with motor voter, agency, and mail-in.
turnout lead experienced by Wisconsin, Minnesota, and Maine prior to adopting election-day registration with the 12-14 point average advantage subsequent to implementation. However, Smolka' s (1977; cited in Teixeira, 1992) case-study approach to analyzing the effects of the reform in Minnesota and Wisconsin estimates a much smaller impact of no more than 2 percentage points on turnout.
Teixeira (1992) notes, in attempting to forecast the impact of motor voter, that election-day registration and motor voter should be close substitutes for each other in enhancing turnout: with either reform, no trip to a registration office is necessary; to vote only a single trip to the polls on election day is required. From this perspective, a state' s choice between election-day registration and adoption of the NVRA provisions may thus be largely a matter of perceived administrative costs and potential for fraud under each alternative.
However, there are sources of possible differences in the impact of election day registration and motor voter. The latter will not reach all potential voters, but only those who drive (or non-drivers who apply for an ID card from a driver' s license bureau). On the other hand, being registered for a period of time prior to the election may create a psychological predisposition to vote, perhaps giving motor voter an advantage.
F. Non-NVRA Variables
The Election Calendar
The presence of Senate, gubernatorial, and contested House races on the ballot makes little difference for registration rates (Table 1). The positive effect of House races in Model I largely disappears with the addition of "South" in Model II; southern states predominate among states with relatively few House seats contested in November.
imprecise; the difference between none and all of a state' s House seats being contested adds 3.9 points to the turnout rate, but large standard errors prevent these estimates from attaining statistical significance. No effects for Senate races, or for a contested House race, are found for presidential years.
Surprisingly, gubernatorial races show the reverse pattern: no turnout-enhancing effects are found for midterm elections (the estimate is negative, sizeable, and statistically significant), but a governor' s race adds 2.5 points to presidential-year turnout.
Economic Effects
Unemployment is consistently, positively, and significantly associated with higher registration (Table 1), although the quantitative impact is fairly small. A 1-point rise in a state' s unemployment rate increases registration by between four- and six-tenths of a percentage point. Turnout effects are smaller and insignificant, however. Income has a significant negative influence for registration when state effects are excluded, but is not significant for turnout or when state effects are included.
Closeness
For presidential-year turnout equations, the state' s presidential contest vote margin, in hundreds of thousands of votes, is added to the model.23
The (insignificant) coefficient for "margin" reported in Table 2 indicates a 4 million vote margin is needed to reduce turnout by only 1 percentage point. In a model weighting observations by VAP, "margin" is significant at .05, but a margin of about 1 million votes -- far larger than the number of voters in many states -- is needed on average to reduce turnout by a single point. The square of margin proved insignificant and was dropped from the equation reported. Controlling for voting age population, under the hypothesis that a given vote margin might imply (at least psychologically) a closer election in a larger state than in a small one, failed to improve the performance of "margin."
Year Effects
Year dummies for registration are negative and statistically significantly for the midterm years, with 1992 as the reference year; registration is 4 to 5 points lower for the non-presidential elections. Large and statistically significant year dummies in models of presidential-year (only) turnout indicate substantial election-specific factors influencing decisions to vote. For the 1976-92 elections with 1992 as the reference year, coefficients for all other years are negative:
Year B t
1988 -5.7 10.67 1984 -3.1 4.42 1980 -3.0 3.85 1976 -2.7 2.94
These year dummies indicate strong election-specific effects pushing turnout downward in 1988 and upward in 1992. The increased turnout of 1992, therefore, cannot be explained in terms of the spread of motor voter, higher unemployment, closeness of the election, or by other variables included in the model.24
V. Conclusion
If the experience of states choosing "motor voter" registration programs can be generalized to states it is imposed on, the registration rolls will be substantially augmented in the coming years. Of greater importance, of course, is the finding that up to one half of these added registrants will actually vote, contradicting assertions by Sen. McConnell (D-Ky) and other opponents. Where the active version of motor voter mandated by the NVRA has already been implemented, registration and turnout were significantly higher over the 1976-92 period than they would otherwise have been.
24Ross Perot' s candidacy is the most obvious possible source of the turnout rise: 1 out of 7 Perot voters told exit
Estimating the impact of motor voter using a "duration" specification indicates that the dummy specification employed by Crocker (1990) understates the efficacy of motor voter, as many states in the sample period had only recently adopted the program. The potential impact on voter participation of the various other NVRA provisions appears to be relatively minor, although available data do not permit a fully valid test of agency registration.
These estimates are not wholly free of "self-selection" bias, however. Motor voter--as well as other reforms--may be more effective when mandated in the states that have not yet implemented them than in states already adopting them on their own, because the latter had somewhat smaller pools of nonregistrants and nonvoters to begin with. Maine, Minnesota, Oregon, and Washington have long been high-participation states; all have adopted motor voter, while very few southern states have. On the other hand, states choosing motor voter or mail-in registration on their own may implement it more effectively than states having it forced upon them, possibly leading to larger impacts in the former than in the latter.
A further issue receiving little or no attention, even in the more careful voter participation studies (e.g., Teixeira, 1992), is that of interaction among registration provisions. In states with election-day or motor voter registration, for instance, mail-in may be less effective, because it is less needed: any potential effects from mail-in are "crowded out" by more powerful programs. While no significant interaction effects among motor voter, mail-in, agency, and election-day registration were found in this study, one must remain cautious about assuming that estimates obtained from simple linear specifications using data from past elections--for which many states had either mail-in, or motor voter, for example, but not both--can be used to forecast participation rates for future elections--for which all states without election-day registration will have motor voter, and mail-in, and agency, and purging reform.
cannot be blamed for the low turnout rates of the 70s and 80s (interrupted at least temporarily by the ' 92 rise). Registering to vote in the U.S. is currently remarkably cheap and easy by historical standards: literacy tests and poll taxes were banned in the early and mid-1960s, residency requirements were drastically cut back in the early 1970s, several states have adopted election day registration and many others have implemented mail-in, motor voter, and agency programs.25
Registration requirements are certainly more burdensome in the bulk of American states than in most industrial democracies, but it is clear that obstacles to registering do not fully account for turnout differences between the U.S. and other nations. Even in North Dakota, which does not require registration, turnout rates do not exceed 70% in presidential elections. Congressman Louis Stokes (D-Ohio), who supported the NVRA, has noted: "Even in developing nations, such as Namibia, where the people had to walk for miles, and stand in line for hours under the broiling sun, to vote in a free election, voter participation rates are higher than in the United States" (Congressional Record, 1990, H269). The Supervisor of Elections in Orange County, Florida, who testified against motor voter, remarked: "At present [in Florida] it is one hundred times easier and quicker to register to vote than it is to obtain a driver' s license!" (U.S. Congress, House Subcommittee on Elections, 1989) Although motor voter can be expected to noticeably increase
25It is conceivable that a given obstacle to registering has a greater deterrent impact now than formerly, with the
decline of political parties: "Without the parties as intermediaries to help complete registration procedures, the `costs' of registration rise" (Piven and Cloward, 1988, p. 111). If declining party-based mobilization is responsible for a rise in the deterrent effect of closing date, e.g., stronger parties should be associated with to a diminished effect of closing date. I find the opposite to be the case with state-level electoral participation rates, using indexes of average strength of local party organization in the various states, circa 1979, available in Gibson et. al. (1985): Closing date reduces registration by a significantly greater amount in the states with stronger parties, controlling for other variables affecting participation. Similarly, interacting closing date with year dummies indicates no upward trend in closing date's deterrent impact on participation rates.
References
Boyd, Richard W. (1986). "Election Calendars and Voter Turnout." American Politics Quarterly, 14, 89-104.
Cain, Bruce E. and McCue, Ken (1985). "The Efficacy of Registration Drives." Journal of Politics, 47, 1221-1230.
Congressional Record (1990). "National Voter Registration Act of 1989." February 6, 1990, H254-H284.
Conway, M. Margaret (1981). "Political Participation in Midterm Congressional Elections." American Politics Quarterly, 9, 221-244.
Cook, Philip J. and Tauchen, George (1984). "The Effect of Minimum Drinking Age Legislation on Youthful Auto Fatalities, 1970-77." Journal of Legal Studies, 13, 169-90.
Cox, Gary W. (1988). "Closeness and Turnout: A Methodological Note." Journal of Politics, 50, 768-75.
Cox, Gary W. and Munger, Michael C. (1989). "Closeness, Expenditures, and Turnout in the 1982 U.S. House Elections." American Political Science Review, 83, 217-31.
Council of State Governments (1976-92). The Book of the States Vols. 21-29. Lexington, Kentucky.
Crocker, Royce (1989). Voter Registration and Turnout: 1948-1988. Congressional Research Service, Library of Congress.
Crocker, Royce (1990). Voter Registration and Turnout in States With Mail and Motor-Voter Registration Systems. Congressional Research Service, Library of Congress.
Gibson, James L. et. al. (1985). "Whither the Local Parties? A Cross-Sectional and Longitudinal Analysis of the Strength of Party Organizations." American Journal of Political Science, 29, 139-160.
Kelley, Jr., Stanley; Ayres, Richard E. and Bowen, William G. (1967). "Registration and Voting: Putting First Things First." American Political Science Review, 61, 359-379.
Knack, Stephen (1992). "Deterring Voter Registration Through Juror Selection Procedures: Evidence from the 1991 NES Pilot Study." Report to the American National Election Studies Board of Overseers, January.
Mitchell, Glenn and Wlezian, Christopher (1989). "Voter Registration Laws and Turnout, 1972-1982." Presented at the Midwest Political Science Association annual meetings in Chicago, Ill., 1989.
Piven, Frances Fox and Cloward, Richard A. (1987). Why Americans Don' t Vote. New York: Pantheon.
Piven, Frances Fox and Cloward, Richard A. (1989). "Government Statistics and Conflicting Explanations of Nonvoting." PS: Political Science and Politics, September 1989, 580-588.
Rosenstone, Steven J. (1982). "Economic Adversity and Voter Turnout." American Journal of Political Science, 26, 25-46.
Rosenstone, Steven J. and Wolfinger, Raymond E. (1978). "The Effect of Registration Laws on Voter Turnout." American Political Science Review, 72, 22-45.
Smolka, Richard G. (1977). Election Day Registration: The Minnesota and Wisconsin Experience in 1976. Washington, DC: American Enterprise Institute for Public Policy Research.
Teixeira, Ruy (1992). The Disappearing American Voter. Washington, DC: Brookings.
U.S. Congress, House Subcommittee on Elections (1989). Hearing on Voter Registration, March 21, 1989. Washington, DC: U.S. Government Printing Office.
U.S. Congress, Senate Committee on Rules and Administration (1991). "National Voter Registration Act of 1991." Report of the Committee on Rules and Administration together with minority and additional views to accompany S. 250. Senate Report No. 102-60, 102d Cong., 1st Sess. Washington, DC: U.S. Government Printing Office.
Table 1: State-Level Registration, 1976-1992
(all midterm and presidential elections included)
Model: I (OLS) II (OLS) III (F.E.)
Variable Parameter Estimate (Standard Error)
log per cap income -8.825** (2.474) -10.630** (2.611) 4.604 (4.200) unempl rate 0.490** (0.188) 0.587** (0.184) 0.426** (0.156) guber. contest -0.784 (0.747) -0.947 (0.717) 1.349** (0.452) senate contest -0.120 (0.779) -0.337 (0.745) -0.008 (0.380) % congr. races 7.199** (1.618) 2.392 (1.707) -0.446 (1.399) election- day reg. 10.832** (1.837) 10.751** (1.761) 8.338** (2.853) early closing -7.250** (0.883) -6.806** (0.854) -1.551 (1.316) purge for nonvoting -3.291** (0.952) -3.739** (0.916) 2.581 (1.719) mailin active -0.463 (0.921) -2.376** (0.924) 0.044 (1.679) mailin passive 5.866** (1.085) 5.959** (1.045) -0.394 (1.108) agency registr. -1.040 (1.671) -1.206 (1.618) -3.170** (0.968) motor duration 3.349** (0.979) 3.058** (0.934) 4.462** (0.625) motor duration2 -0.108 (0.152) -0.129 (0.145) -0.364** (0.081) motor passive 2.360 (1.320) 2.811* (1.260) 1.261 (0.796)
South -4.126**
census response
0.320** (0.080)
# observ. 441 441 441
R2 .46 .51 .90
** and * indicates significance at .01 and .05 levels (2-tail tests) respectively.
Table 2: State-Level Turnout, 1976-1992 Two-Way "Fixed-Effects" Models
Elections: All Presdt'l Year Midterm
Variables
log of per capita income 0.702 (4.267) 1.565 (3.492) -5.310 (6.955) unemployment rate 0.268 (0.156) 0.146 (0.129) 0.337 (0.260) gubernatorial contest 1.976** (0.456) 2.526* (1.206) -7.519* (3.680) senate contest 0.934* (0.380) 0.468 (0.314) 1.559* (0.639)
margin -0.024 (0.093) % congressional contests 2.194 (1.403) 0.774 (1.289) 3.927 (2.327) election-day registration -0.275 (2.776) 0.304 (2.233) 1.243 (4.582) early reg. closing date -0.039 (1.394) -0.756 (1.054) 2.968 (2.714) purge for nonvoting 1.768 (1.499) 0.808 (1.234) 3.714 (2.435) mailin (active) -0.056 (1.697) 0.424 (1.303) 4.662 (3.241) mailin (passive) 0.016 (1.119) -0.026 (0.846) 0.909 (2.135) agency registration -1.351 (0.977) -1.528* (0.762) -0.433 (1.749) motor (active) duration 2.307** (0.631) 1.465** (0.487) 3.338* (1.186) motor (active) duration2 -0.242** (0.082) -0.136* (0.062) -0.453** (0.152)
(passive) (0.802) (0.653) (1.390)
# observ. 448 250 198
R2 .90 .94 .87
Table 3: Cumulative Impact of "Active" Motor Voter
# of elections Registration Turnout: all elections
Turnout: presidential
Turnout: midterm
1 4.10 2.06 1.33 2.88
2 7.47 3.65 2.39 4.86
3 10.11 4.74 3.17 5.93
4 12.02 5.36 3.69 6.10
5 13.21 5.48 3.94 5.36
6 13.66 5.13 3.91 3.71
7 13.39 4.29 3.61 1.16
8 12.39 2.97 3.04 -2.30
9 10.66 1.16 2.20 -6.67
Dummy variable estimate:
Appendix: NVRA Provisions by State, as of 1992 Election
State Provisions State Provisions
AK MV ML MT MV ML AG
AL NP NB ML NP
AR NC MV
AZ MV ML AG ND no reg. req' d
CA ML NP NH
CT AG NP NJ MV ML AG
CO MV NM MV
DC MV ML NV MV ML
DE ML NY MV ML AG
FL OH MVML AG
GA OK
HI MV ML OR MVML
IA MV ML AG PA MV ML
ID MV RI MV AG
IL MV SC ML
IN SD ML
KS ML TN ML
KY ML TX MVML AG NP
LA UT ML
MA NP VA
MD MV ML AG VT MV ML NP
ME MV ML NP ED WA MV AG
MI MV WI ML ED
MN MV ML AG ED WV MV ML
MO NP WY
Notes:
MV = motor voter ML = mail-in AG = agency-based
NP = no purging for nonvoting ED = election-day