Preventing Direct Communication between a Sensor and
Sink Node with the Help of Hybrid Network Topology for
Energy Conservation in Wireless Sensor Network
Srishti Singal
M.Tech Scholar
G.I.T.M. Bilaspur, Gurgaon (Haryana)
Naveen Sharma
Assistant Professor
G.I.T.M. Bilaspur, Gurgaon (Haryana)
ABSTRACT
Wireless Sensor Networks (WSNs) are paving a way of miniaturization of sensors and actuators by proving a way of boost in the wireless communications by constructing small sized, low power and inexpensive sensor devices that posses high-speed sensing, computational, and communication capabilities. This paper presents the combination of Hybrid Hierarchical Network Topology and Use of different Communication Techniques like Sleep & Wait: Transmission of Data and Low Power Listening: Reception/Listening. This paper proposes a system in which the setup of intermediate nodes (Parent nodes) is done to prevent direct communication between a Sensor and Sink node, which in a nutshell prevents large wait times for transmission.
Keywords:
Wireless Sensor Networks, Hybrid Network Topology1. INTRODUCTION
The recent advances in various technologies including nanotechnology, electronics, and wireless communications and computing have led to evolution of wireless sensor networks (WSNs). WSN is a self configuring, self healing network comprised of low powered, small sized nodes. The first wireless trend known as Wireless Voice Networks emerged in 1980s [6]. WSNs are mainly deployed in human unattended environment. Sensor network covers space and time: location, coverage and data synchronization. Typically, data is the basic entity of any sensor network, which is highly time stamped and highly time dependent data [3]. Improvement in the microelectronics have altered the development of extremely small sensor devices capable of evaluating ambient conditions such as pressure, temperature, light intensity, humidity, and motion. The WSN consists of following computation architecture:
1.1 Sensors:
Sensors can be either small sized (nano scaled electromechanical devices) or medium sized (micro scale electromechanical systems), and large sized (eg. RADARs).
Sensors can be either active (RADARs) or passive (video, infrared).
Sensors can be either mobile (robot devices) or stationary (seismic sensors).
1.2 Controlling Environment:
It Contains network of either homogeneous sensors or heterogeneous sensors.
It can be distributed or localized.
It can be deployed either directly into any particular application area or close to it. Spans over several areas ranging from dense to sparse.
2. THE STRUCTURE AND
OPERATION WITH FEATURES IN A
WIRELESS SENSOR NETWORK
Figure 1 Basic Structure of Wireless Sensor Network [2]
1. The Sensor network is composed of very large number of nodes which are self-organized and densely deployed. Therefore, sensor network applications are mainly concerned with the data generated by the sensor nodes and not the ids of the reporting sensor nodes.
2. Every single node is incorporated with digital signal processing algorithms.
3. The deployment of sensor networks takes place in dynamic environment
4. On the basis of previous partially aggregated data, the computations are performed (for example, only the average result of particular parameters).
5. The input data is collected on the downstream nodes, which then transmits the result.
6. MAC protocol regulates the access in the network.
2.1 Components of Sensor Network:
A WSN node mainly consists of four main parts: Processing unit,
Sensor Transceiver Energy Source Unit
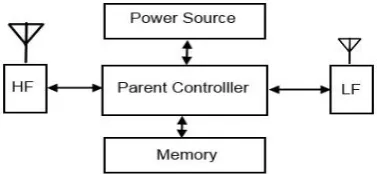
The main components of a sensor node as seen in the figure 2, are:
[image:2.595.323.529.121.250.2] Microcontroller, Transceiver, External Memory, Power Source and One or more Sensors.
Figure 2 The Components of a Sensor Node [5]
3. SYSTEM ARCHITECTURE
The considered system architecture relies on three types/roles of sensor nodes [1]:
Sensing nodes (or sources) that sense certain physical parameters and transmit the relevant information towards other nodes in the infrastructure.
Communication (or relay) nodes that, wirelessly, receive readings from sensing nodes (or other communication nodes) and relay them upstream towards the final recipient of such information. Communication nodes come into play whenever direct network connectivity is not feasible (due to limited resources such as power in the radio interface) and bridge the, otherwise inaccessible, nodes.
Sink nodes that are the final recipients of the sensed information. Sink nodes are typically connected to conventional computing equipment for complex processing of the accumulated readings. Alternatively, sink nodes may be attached to another, more elaborate network topology (e.g., a WLAN or a fixed network) for further forwarding. The aforementioned nodes form a directed acyclic graph, a rooted tree structure. The root of the tree is the sink node (exactly one node), all other nodes may assume the role of sensing nodes (at least one node is required), or communication nodes.
Through a sequence of nodes a data flow (DF) associating a certain leaf node with the root node is being served. For example, a data flow is SN4 → CN4 →CN1 →S.
Figure 3: WSN Topology
Every communication node reserves memory and communication resources for each DF, while sense nodes reserve resources only for their own DF. The architecture can be generalized in a forest-like topology with multiple sinks. Each node forwards all of its messages to the selected sink following an already established path.
4. RESEARCH CHALLENGES
Although the challenges involved in the wireless sensor networks are application dependent, there are some facts that all applications share:
Sensors are typically resource constrained. Therefore there is a need of using resources very carefully. Sensors suffer with the problem of limited processor
bandwidth and small memory and computational capacity.
Limited battery power is the main challenge of sensors. WSN employs a mechanism of sending aggregated
queries to the sink node (only the average result of particular parameters), thereby introduces the channel contention and unbalanced energy consumption problems.
Most protocols for the sensor networks ignores real time or simply attempts fast transmission due to that frequent packet failure occurs.
There is always a need of software up gradation during the lifetime of a sensor, since sensor networks are deployed for long time without any human intervention.
In terms of privacy and security there is always exist a risk of physical attacks in the infrastructure based networks which includes denial of service attack and eavesdropping. Therefore, it involves an additional security overhead.
5. DESIGN FACTORS
[image:2.595.53.293.165.386.2]5.1 Deployment Configuration
Sensor networks are deployed densely in the physical environment; A good technique is to deploy sensors in any coverage area is the key feature for the proper functioning of a sensor network. Sensors should be deployed in such a fashion that their densities is always greater towards the sink in order to overcome the problem of frequent node failure due to variable energy needs of the nodes which are close to the sink as compared to farther ones.
5.2 Mobility
Mobility in the sensor network reduces the energy consumption since mobility in the network increases the lifetime of the nodes. Environmental influences such as wind or water ensure mobility in the network. Active mobility can be the result of mobility in nodes and passive mobility is the result when nodes are attached with some moving object.
5.3 Reliability and Scalability
These two parameters are inversely proportional to each other; reliability in the network always decreases with increase in the number of nodes in the sensor network. This is due to the fact that when number of nodes will increase, the latency of the network increases as if one router node will crash then the data transmission will definitely be rerouted from other path.
5.4 Hardware Constraints
Any sensor node is basically composed of four primitive components which include transceiver unit, sensing unit, processing unit and power unit with additional application specific components. The intrinsic analog signals sensed by any node are converted into digital signals by the help of ADC (Analog to digital Converter) and are fed to the processing unit. Power unit is the vital unit of any sensor node which is supported by an energy harvesting unit such as solar cells.
5.5 Operating System:
1. In sensor network a sensor node is mainly responsible for computation of the extracted data from the local environment. It processes the extracted data and manipulates the data as per the requirement of an application. All these activities require real time response, processing and routing of the data. So concurrency management is needed in sensor nodes.
2. An OS for sensor nodes should be hardware independent and application specific. It should support multi-hop routing and simple user level networking abstractions.
5.6 Synchronization
1. Energy utilization in some synchronization schemes is more due to energy hungry equipments like GPS (Global Positioning System) receivers or NTP (Network Time Protocol).
2. The lifetime or the duration for the nodes which are spread over a large geographical area needs to be
taken into account. Sensor nodes have higher degree of failures. Thus the synchronization protocol needs to be more robust to failures and to communication delay.
3. Sensor nodes need to coordinate and collaborate to achieve a complex sensing task like data fusion. In data fusion the data collected from different nodes are aggregated into a meaningful result. If the sensor nodes lack synchronization among themselves then the data estimation will be inaccurate.
5.7 Power Management
Power management is the vital feature of any sensor network. The wireless sensor node has a limited power and the replenishment of power again is difficult or usually impossible. Therefore, there is a need of more power aware protocols and algorithms in the wireless sensor networks.
6. PROPOSED WORK
We are deploying the several Parent Nodes as the intermediate between the Sink Node and the Sensor Node.
Now we will discuss the working and the architecture of the all the three nodes:
Parent Node Sensor Node Sink Node
6.1 Functioning of the Parent Node
[image:3.595.335.524.500.587.2]Parent is a device which controls the data transmission between the sink node and the other nodes. This model is deploying several Parent nodes in place so that the work done by the single Sink Node can be distributed further. This is proposing the physical position of the parent node between the Sink and the Sensor nodes.
Figure 4: Components of the Parent Node
A parent node can have two to three children as the sensor node, the data will be stored in Parent nodes itself and they will employ LPL.
(Low Power Listening) is used for data handling and data request.
Following are the components of the Parent Node: Power Source
6.2 Functioning of the Sensor Node
Wireless communications, and digital electronics have enabled the development of low-cost, low-power, multifunctional sensor nodes that are small in size and communicate easily in short distances [7]. These tiny sensor nodes, which consist of sensing, data processing, and communicating components, leverage the idea of sensor networks based on collaborative effort of a large number of nodes.
[image:4.595.329.516.79.201.2] Each Sensor Node used to have direct communication with the Sink Node because of which the sink node used to get overloaded, the energy was wasted and there could not be sufficient transmission. So our proposal puts Parent Node, between the sensor node and the sink node to get the efficiency in the power consumption.
Figure 5 Components of the Sensor Node
Sensor will employ sleep and wait method for routine data handling and registration. Each sensor node is allotted its unique ID. Each sensor node will be initially registered with parent node and they will have the conversation through beep messages.
Each sensor unit has its own memory for the data storage and then transfers the information to the interested node by listening to the beep messages. A sensor network is composed of a large number of sensor nodes [9], which are densely deployed either inside the phenomenon or very close to it.
6.3 Functioning of the Sink Node
A sink is necessary in order to collect , process and probably forward these data to a more sophisticated system for further processing [8]. The use of sink mobility in wireless sensor networks (WSN) is commonly recognized as one of the most effective means of load balancing, ultimately leading to fewer failed nodes and longer network lifetime.
In traditional network all the sink was considered as the main node for the data transmission
[image:4.595.66.260.282.373.2]Figure 6 Components of the Sink Node
But in this approach is deploying a Parent Node for the sink node to have distribution of the load and hereby this is conserving the energy of the overall structure by adding additional hardware and the use of certain protocols.
Here Sink Node is not totally responsible for the data storage, it has to send the request to the parent node to data access by using its unique ID.
6.4 Multilevel MAC Algorithm
(Working Model)
I. Initialization of Nodes
Sensor will employ sleep and wait method for routine data handling and registration.
Parent will employ LPL for data handling and data request.
II. Communication from sensor to parent
node:
Any sensor in range is registered with Parent Node. They will have sleep and wait method for handling
routine data transfers and requests from parent.
1.
Sending the Data:-
Sensor will send beep message with sensor id like SB_SID_SB and will wait until it gets response and send same beep message after some interval. Parent on receiving beep message will transmit
back beep message like PB_SID_PB
Sensor on receiving response will transmit beep followed by data like SD_SID_DATA_SD.
2.
Handling The Request:-
Sensor will alternately sleep and check for beep message from parent node.
When parent is willing to request data from sensor, it will transmit beep message after every small interval until sensor responds like PD_SID_PD Sensor on receiving response will transmit beep
followed by data like SD_SID_DATA_SD
III. Communication from Parent to Sink
Node:
1. Sending the Data:-
Response and send same beep message after some interval.
Sink on receiving beep message Parent node will send beep message with parent id like PB_PID_PB and will wait until it gets will transmit back beep message like S_PID_S.
Parent on receiving response will transmit beep followed by data like PD_PID_DATA_PD.
2. Sink Node Making Request:-
Parent node will use LPL to check for beep message from sink node.
When sink is demanding data from parent, it will transmit beep message after every small interval until sensors responds like S_PID_S.
Parent on receiving response will transmit beep followed by data like PD_PID_DATA_PD.
IV. Registration
Sensor will transmit RS_SID_RS until it gets response from atleast one parent node.
Parent node on receiving registration request will transmit RP_PID_RP to confirm registration. and register current sensor in list of child sensors.
V. Sensor Lost
If a sensor has not reported in last cycle, parent node will issue request signal to sensor. If sensor fails to respond over a duration of time.
Parent node will mark current sensor as sensor lost in his list of child sensors.
7. DISCUSSION OF THE WORK
PROPOSED
In this section of our chapter we are explaining the detailed work done with the practical simulation with the help of the screenshots .This approach is introducing the Sink node in the centre, the Parent nodes are being introduced so that they can handle the load of the sink node as all the sensor nodes were earlier used to be in connection with the sink node directly.
The result it was time consuming and less energy efficient, this proposed work will be able to prove by the help of hierarchical hybrid structure so that our energy can be conserved. The Sink Node registers some sensor nodes and the Parent Nodes also registers some of the sensor nodes. Each parent node registers specific sensor nodes and the number of nodes registered is displayed as you will see in the section below.
The Sink Node is represented in the form of a big square with the outlining of black color. The Parent Nodes are represented in the form of small squares as compared to the Sink Node. The Parent Nodes are denoted by different colors.
This proposal is concerned mainly for the energy conservation by making the approach with multiple MAC in a hybrid hierarchical structure by introducing the registration mode. The main idea behind this is no sensor should be left so as to transmit the data. Firstly when the sensors are willing to carry the transmission they have to register themselves with the Sink Node or the Parent Node. Once the registration has been done
the sensors are provided with their Unique ID by the Sink Node or the Parent Node with whom they are registered.
8. OUTCOMES / RESULT
As discussed above about the work, you will be able to visualize more clearly about the output after all the discussions we have been doing so far. You get a screen with Sink Node in the centre and the Parent Nodes at the sides. On the right hand side (analysis part) of the screen ,it is representing the output results.
There are three steps in our work:
Plot Sensors
Register Sensors
Simulation
The basic terms used in the simulation work are:
• Normal: - Refers to a simple WSN with a Sink node and various Sensor nodes.
• Actual: - Refers to our proposed WSN.
• TN: - No of transmission made in simple WSN.
• TA: - No of transmission made in our WSN.
• RPN: - Remaining battery power in simple WSN.
• RPA: - Remaining battery power in our WSN.
• ID: - Sensor ID.
• Large Rectangle: - Sink Node, number inside indicates no of registered and active sensors.
• Small Rectangle: - Parent Node, number inside indicates no of registered and active sensors.
• Hollow Circle: Unregistered Sensor.
• Hollow coloured Circle: - Inactive registered sensor.
• Dense coloured Circle: - Active registered sensor.
Screenshot 1:
Here, this approach is plotting the sensors with the parent node and the sink node. There are total 100 sensors which are plotted and are need to be registered. As you see in the right section (analysis part) of the screen the ID’s have been allotted. RPA and RNA have the same figure i.e. 100. The hollow dots are represented for sensor nodes and the parent nodes are shown with the colored small rectangle, the sink node is represented with the help of large rectangle.
RPN denotes Remaining battery power in simple WSN.
Figure 7 Screenshot 1-Plotting the sensors
Screenshot 2:
[image:6.595.54.280.73.228.2]Now the second step it is going to consider is Register Sensors. In this as you can visualize the black hollow dots have been converted to the colored ones.
Figure 8 Screenshot 2: Registration of the Sensors
As you observe that all the sensor nodes have been registered with the parent nodes and no sensor node is registered with the sink node. The registration will be seen with the particular sensor nodes being registered with parent node of the same color. Example:-13 sensor nodes are registered with the pink colored parent nodes , similarly 20 sensor nodes are registered with blue colored parent node and same for every sensor node and parent node relationship. No changes are taking place in the analysis part of the screen.
Screenshot 3:-
Here it is starting the simulation part .Here the data transmission will be executed. Till this step it has plotted the sensors and registration has been executed.
[image:6.595.55.279.324.488.2]The RPA and RNA will be of the same value since till now the data transmission has not been performed and hence the transmission power in actual mode and the normal mode has not been exhausted and the remaining two values of every registered sensor nodes will be equal to each other.
Figure 9 Screenshot 3:- Start Simulation
Screenshots 4:-
This is the first step for the actual beginning after the start of the simulation. Now here you can analyze number of transmissions in actual and normal (TA and TN) has changed. And the power in actual and normal mode (RPA and RNA) has also reduced gradually from 100 to 98.25 and 97.54 for the node with ID 0. Here we observe at the bottom of the screen that, Total Sensors and the Active Sensors (both with 100 value) meaning to say that all the sensor nodes are participating in the transmission. All the steps will work in the similar way.
Figure 10 Screenshot 4: Step 1 after the Simulation
Screenshots 5:-
[image:6.595.316.553.397.551.2] [image:6.595.316.558.595.753.2]Here you can observe that the active sensors have started decreasing from 100 to 99.The orange parent node has changed its value from 11 to 10 i.e. one of its sensor node has stopped its transmission or the node has lost its energy and is dead.
You can here visualize the values for TN where they are instantly decreasing at a fast rate, indicating the amount of energy wasted in the normal WSN as compared to work proposed.
Screenshot 6:
Similarly all the steps are being performed and in the last few stages you observe step 81, and analyze the behavior of the parent node and the sensor nodes. The active sensors available are 1 and all other sensor nodes are dead for the transmission to take place.RPA and RNA have almost reduced to nil.
[image:7.595.315.545.286.438.2]You can find that only 1 blue colored sensor node is still participating and all others are dead. Dead nodes are represented by hollow colored nodes and the value of the parent node has gradually changed to zero (nil).
Figure 12 Screenshot 6- only 1 active sensor is present
The total sensors present are: 100 The active sensors present are: 1
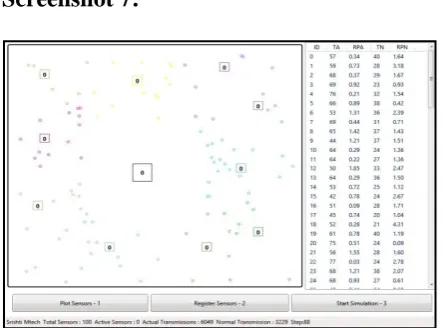
Screenshot 7:
[image:7.595.53.291.327.478.2]
Figure 13 Screenshot 7: Step 88 Last Step of Simulation
Here you see that the all the transmissions have ended. The actual sensors have changed to zero (nil).
All the parent nodes have lost all the sensor nodes. The TA is much greater than TN meaning to say that number of transmissions in actual mode is always more than the normal mode. At the bottom you analyze the actual transmissions are 6049 and the normal transmissions are 3229.
The energy efficiency can be seen , there by energy conservation can analyzed automatically.
The total sensors present are=100 The active sensors present are= 0 The actual transmission = 6049 The normal transmission = 3229
Screenshot 8:
[image:7.595.53.275.544.708.2]Here our simulation gets completed and hence you get the required results.
Figure 14 Screenshot 8: Network Dead
After all the simulation is over you get the initial blank screen. All the parent nodes value is changed to zero and the sensors disappear. All the values get blank.
After this step you can further start another new simulation as started in our initial stage. Now here it come onto the beginning of the simulation and further all the three steps will be preceded.
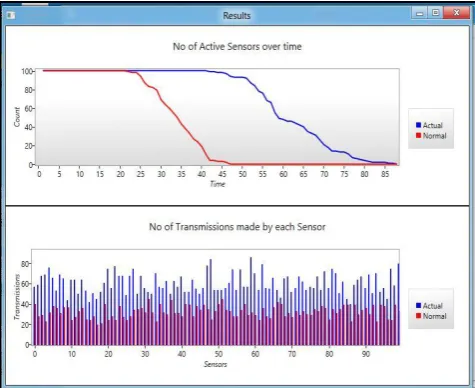
Screenshot 9: Results
Active Sensor Graph
• X-axis represents no of steps/transmissions done in the network.
• Y-axis represents the number of active sensors.
• There are two curves being plotted, one for normal WSN (Normal - Red) and one for Our Proposed WSN (Actual – Blue)
Transmissions Made By Each Sensor
• This graph is plotted against number of transmission made by sensors over sensor id.
• X-axis represents the sensor id.
• Y-axis represents the number of transmission made by a particular sensor.
Figure 15 Screenshot 9: The results of the simulation
9. CONCLUSION
With the evidence of comparison graphs and simulation results, it can be conclude that our proposed system has been successful in conserving Sensor’s energy and extend their work lifespan as compared to a simple WSN.
Intermediate Parent Nodes successfully perform their act of Data collection, sensor management thus dividing the role of Sink Node among them, preventing the situation of long waiting periods for sensors for data transmission. Parent Nodes have enabled Sink to issue accurate data requests and being served by sensors nodes, by implementing sensor registration system and maintaining a list of registered sensors and active sensors.
Sensor Nodes have saved considerable amount of energy boosting life up to 70%. Different communication techniques have ensured that only the minimum possible amount of energy is used for a particular operation.
Moreover reduction in communication distance has also helped in saving energy by allowing sensors to operate at considerable low signal strengths. Sink Node has divided its role of monitoring and managing sensors nodes to Intermediate Parent Nodes, and is left with tasks of final data collection, data analysis, data logging and raising suitable Requests and Alarms
10. FUTURE SCOPE
Research and Analysis is a never ending process and leads to various changes and improvements in existing systems over time. So is the case with WSN’s and our proposed system.
Few things that can be considered in Future are:-
1. Developing Better and Efficient remotely-deployable power sources.
2. Develop a Poke/Notify/Request system for sensors, so that they don’t have to Poll/Sense for requests all the time and waste energy.
3. Develop a conflict resolution system for Parent node/Sink so that sensors need not to transmit again and again in case of conflict.
Implement a Security protocol with minimum overhead to ensure data integrity.
11. REFERENCES
[1] Manoussos Athanassoulis, Ioannis Alagiannis and Stathes Hadjiefthymiades ,”Energy Efficiency in Wireless Sensor Networks: A Utility-Based Architecture”
[2] Anurag Kumar,” Design and Optimisation Problems in Wireless Sensor Networks”.
[3] Kemal Akkaya, Ismail Ari, “In-Network Data Aggregation in Wireless Sensor Networks.”
[4] Neha Jain and Dharma P Aggarwala, “Current Trends in Wireless Sensor Network Design” OBR Research Center for Distributed and Mobile Computing, ECECS Department and Mobile Computing, ECECS Department, University of Cincinnati, Cincinnati, OH 45221-0030, USA.
[5] I.F. Akyildiz , W. Su , Y. Sankarasubramaniam , E. Cayirci,”Wireless sensor networks: a survey, Computer Networks” The International Journal of Computer and Telecommunications Networking, v.38 n.4, p.393-422, 15 March 2002
[6] Yazeed Al-Obaisat, Robin Braun, “On Wireless Sensor Networks: Architectures, protocols, Applications, and Management”, Robin Braun Institute of Information and Comm. Technologies University of Tech. Australia.
[7] Q. Gao a, , K. J. Blow a 1, D. J. Holding a, I. W. Marshall b, X. H. Peng a “Radio Range Adjustment for Energy Efficient Wireless Sensor Networks”,Electronic Engineering, Aston University, Birmingham B4 7ET,United Kingdom,Computing Laboratory, University of Kent, Canterbury, Kent CT2 7NZ, United Kingdom
[8] Manoussos Athanassoulis, Ioannis Alagiannis and Stathes Hadjiefthymiades “A Multi-Criteria Message Forwarding Architecture for Wireless Sensor Networks”University of Athens,Department of Informatics and Telecommunications, Pervasive Computing Research Group, Panepistimiopolis, Ilissia, 15784 Athens, Greece
![Figure 2 The Components of a Sensor Node [5]](https://thumb-us.123doks.com/thumbv2/123dok_us/8097669.786682/2.595.53.293.165.386/figure-components-sensor-node.webp)