Video based Saliency Detection
Alok Thakur
Department of Electronics and Communication Engineering,
Technocrafts Institute of Technology, Bhopal India
Niraj Tiwari
Department of Electronics and communications Engineering
Technocrafts Institute of Technology ,Bhopal India
ABSTRACT
Saliency Detection is very important for image and video processing application. This paper presents Saliency Detection for video processing. The sample video is converted in the form of Frames. Now Saliency algorithm is apply to the frames of images to filter the background from the video frames. The frames are filter in four parts, first the Hyper Complex Form algorithm is apply to separate the R, G & B color form the image. In second part Gaussian filter is apply to smooth the image. In third part Binary filter is apply to filter the noise factor from the images. In last again Gaussian filter apply to filter the image for smoothness. The output of the paper gives the compressed and reduced background video frame. The experimental result clearly justifies our model.
Keywords
Saliency Detection, Hyper Complex Form Algorithm, Gaussian Filter, Binary Filter, background subtraction.
1.
INTRODUCTION
The main problem of obtaining objects from the scene and separating them from the background of image is figure– ground separation. The human brain can do this separation very easily and fast [3], but doing same on a machine is one of the major challenge for engineers and scientists. Background separation from the images is the one of the task in the machine application makes it a critical part of the system. The output of the Background separation is the input to the higher-level process, for example, the tracking of identified objects from the image. The main problem is related with image application of machine vision, scene understanding, content-based image retrieval, object recognition and tracking. In this paper, we provide an approach to figure ground separation problem using hyper complex from and holistic image descriptor also known as “image signature”. It defines the sign function of the Discrete Cosine Transform (DCT) of the image frame. It also shows the formation about foreground of an image, a very important property which we used underlies the usefulness for salience image regions.
As the studies have shown that the salient region in the image would first pop out for their different low features from their surrounding [1], [2]. According to the feature-integration theory [1], number of saliency detection modules proposed to detect the salient regions for many image processing applications [4] [5]. Existing salience detection algorithms [4] are implemented using uncompressed domain. In this paper we are going to propose the method to compress the image frame of the video sample. In this paper we also try to solve the figure – ground separation problem in the framework of the sparse signal analysis. We also shows the phenomenon on the synthetic image with sparse foreground much weaker in intensity than the complex background pattern.
Most of the images are stored in the compressed domain of joint photographic expert group (JPEG). The compressed JPEG images are widely used because of their compress size. In order to obtain features from compressed image, the existing saliency detection have to decompress there JPEG image from the compressed domain into the spatial domain. The full decomposition from saliency detection is very time consuming but computing consuming also.
In this paper we proposed the saliency detection model in compressed domain. Furthermore we are going to use hyper complex form algorithm, Gaussian Filter algorithm and binary Filter algorithm to get the video in the foreground form and in compressed form. Here we directly extract the color, texture and other feature of the video image frame by using Hyper Complex Form algorithm. After getting the value of color, intensity and texture from the image, the saliency map is calculated on the bases of weighted feature difference from DTE block. The saliency map in the compressed domain is used to get visual importance of the each video image frame. The study has shown that the direct extraction of features form the compressed frame image domain is very useful information for many applications. The Experimental result shows the results for proposed saliency detection model for video very efficiently.
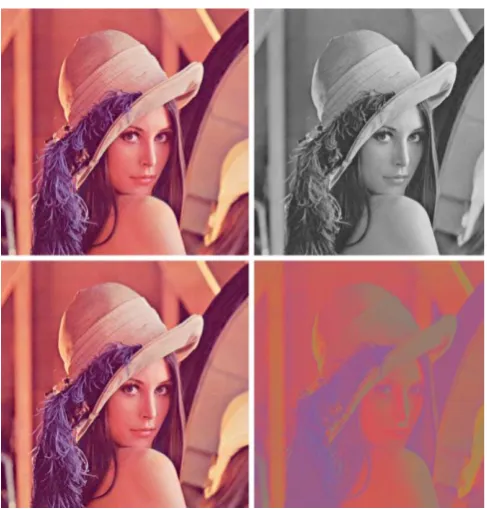
(a) (b) (c)
(d) (e) (f)
[6]), (d) saliency map from the model in [6] , (e) saliency map from our proposed model, and (f) retargeted image our proposed algorithm. The width of the retargeted
images is 75% of that from the original image.
2.
RELATED WORK
2.1. Saliency Detection
.
The saliency detection model proposed by Itti et al. and it’s design is based on the neuronal architecture of the primates early vision system [3]. In our paper, the saliency map is calculated with the help of three features of the image frame of video: intensity color and orientation. The combination of this three quality of images is used to obtain the final saliency map. Based on the Itt’s model, Harel et al. proposed the graph-based on visual saliency model by using a graph-based dissimilarity measure [9]. Another author Ma et al. devised a saliency detection model based on the local contrast analysis [10]. In this paper the hyper complex from algorithm and Gaussian filter algorithm is adapted to obtain the salient region of the image. In Gonferman et al. built a contrast – aware saliency detection with consideration of the contrast from both local and global perspective. One another author Liu et al. utilized the machine learning technique to obtain the saliency map for image processing [4]. In this paper we used a Gaussian filter and binary filter to get the image smooth and remove the noise factor from the image frame of video. The more relevant study comes from the Hou and Zhang [8], motivation by Oppenheim et al.’s early discovery [9], [10]. They found that the residual furies amplitude spectrum and it’s smoothed copy would be used to form a saliency map. The residual retains more high frequency than the low frequency of the image spectrum, where smoothen copy similar to the original image frame. Later Guo et al. found that Hou’s model was actually coursed by the phase spectrum and they devised phased – based saliency map by using inverse furrier transform on a constant amplitude spectrum of the original phase spectrum of the input image. Another author Bruce at al. decided saliency information based on the concept information maximization. The image frame compressions, discards the amplitude information across the entire frequency spectrum of the image frame of video, storing only the sign of DCT components, equivalent to phase for Furies decomposition. Thus the image obtain from the output is very compact, with a single bit per component and we also show in the remainder of this paper, possesses important properties related to the foreground of an image All the above model mentions for saliency detection are implementing for the uncompressed domain. In this paper we propose a saliency detection model for compressed domain. We extract the RGB components from image frame of the video using Hyper complex form algorithm and also extract the intensity, color and texture features from DCT coefficients of image to calculate the block difference for the saliency detection. The saliency map obtained in the compared domain is used to reduce the background from the image frame of the each DCT block in the proposed image retargeting algorithm. Because of the directly derived saliency map from the compressed domain, the algorithm effectively preserve the objects of attention and remove the less curious region as show in fig 1. We can say that our saliency map identifies the salient region more accurately than the gradient map and saliency map from [3]. These we can say that our proposed algorithm is give the reduced background and compressed video from the input video
2.2. Hyper Complex Form
.
Hyer Complex Form Algorithm is used to extract the RGB color component from the image frame of the video. Hyper Complex Form used the Fourier transform algorithm to separate the RGB component from the image. Fourier transform have been widely used in signal processing and image processing from the very first discovery of the Fast Fourier transform feasible using computer. The color image color image processing has a short history, but can be traced to the root of the color television in the earlier days of digital image processing. It is possible to separate a color image into three scales images and compute the Fourier transform of these image separately, i.e. RGB [13].
Color image pixels have three components and they can be represented in quaternion form using pure quaternion. For example, a pixel at image coordinates (n, m) in an RGB image can be represented as
f(n , m) = r(n , m)i + g(n , m)j + b(n , m)k ,
Where r(n, m) is the red components and g(n , m) and b(n , m) are the green and blue components of the pixel, respectively. Ell’s original quaternion Fourier transform [11], [12] was defines as follows:
𝐻 𝑗𝑤, 𝑘𝑣 = 𝑒∞ −𝑗𝑤𝑡
−∞ 𝑡, 𝜏 𝑒−𝑘𝑣𝜏 ∞
−∞ 𝑑𝑡𝑑𝜏
With inverse define as,
𝑡, 𝜏 = 𝑒∞ 𝑗𝑤𝑡
−∞ 𝐻 𝑗𝑤, 𝑘𝑣 𝑒𝑘𝑣𝜏 ∞
−∞ 𝑑𝑡𝑑𝜏
However, subsequent attempts to implement convolution and correlation using a simple generation of the standard complex operation formula failed, and this motivate the search for alternate formulation of quaternion Fourier transform .This search resulted in the following generalized quaternion Fourier transform.
𝐹 𝜇 , 𝑣 = 1
𝑀𝑁 𝑒
−𝜇2𝜋 𝑚𝑣𝑀 + 𝑛𝜇𝑁
𝑓(𝑛, 𝑚)
𝑛−1
𝑛=0 𝑚 −1
𝑚 =0
Fig.2. Symplectic decomposition of “Lena” image. Clockwise from upper left: original, parallel part, perpendicular part, and all original images were full color
images. _ is along the gray line and _ the red line.
Given a quaternion image f(n , m) , it’s pixel by pixel simplistic decomposition is given as ,
𝑓 𝑛, 𝑚 = 𝑓1 𝑛, 𝑚 + 𝑓2 𝑛, 𝑚 𝜇2
Where each part f1 and f2 can be represented as a complex image is of the quaternion images is equivalent to a complex image required only two real components for its representation.
Fig2 shows a simplistic decomposition of the image. The axis is along the gray line. Hence, the simplex part is the luminance information (this is still a full color image, not a grayscale image) and the perplex part is the chrominance information. There two parts can be summed using the above equation to yield the original image. The simplistic decomposition was to decompose the image spectra.
2.3. Gaussian Filter.
In image processing, Gaussian Filter is used to smoothen the image by reducing the time delay and time rate function of the image frame of a video. Gaussian filter is a filter whose impulse response is a Gaussian function. Gaussian filter have the properties of having no overshot to a step function input while minimizing the size and fall time. The Gaussian filter has the minimum time delay filter. It considers the ideal time domain filter, like the sinc is the ideal frequency domain filter. Definition: The one – dimensional Gaussian filter has an impulse response given by
𝑔 𝑥 = 𝑎 𝜋 . 𝑒
−𝑎 . 𝑥2
And the frequency response is given by
𝑔 𝑓 = 𝑒−
𝑥2𝑓2 𝑎
With f the ordinary frequency. These equations can also be expressed by standard deviation as parameter
𝑔 𝑥 = 1 2𝜋 .𝜎 . 𝑒
−2𝜎2𝑥2
and the frequency response is given by
𝑔 𝑓 = 𝑒 − 𝑓2
2 𝜎𝑓2
By writing the function of with the two equation for g(x) and as a function with the two equation for (f) it can be shown that the product of the standard deviation in the frequency domain is given by
𝜎 . 𝜎𝑓 =2𝜋1
Where the standard deviation are expressed in those physical units, e.g. in the case of time and frequency in seconds and Hertz. In two dimensions, it is the product of two such Gaussians, one per direction:
𝑔 𝑥, 𝑦 =2𝜋 𝜎1 2 . 𝑒
− 𝑥2+ 𝑦 22 𝜎2
[image:3.595.354.499.437.549.2]Where x is the distance from the origin in the horizontal axis, y is the distance from the origin in the vertical axis, and is standard deviation of the Gaussian distribution.
Fig. 3 Shape of typical Gaussian filter
Fig. 4 Coordinate x0,y0 arbitrary pixel position in a bitmap image.
The fig 4 shows the x, y is a local coordinate system centered in x0, y0 as shown.
The gray area is a filter box with m*m knots. x and y reach from -n to +n. The box width is denoted by m assumed odd. Weight factor are calculated by w
𝑤(𝑥, 𝑦) = e−𝑎
𝑎 = (x2+ y2)/(2. r2)
The filter radius r is in statistic the standard sigma, selects n= (2 . . . 3).r for a reasonable reproduction without clipping. The image shows the function relative to the filter box vertically shifted.
3.
PROPOSED WORK
[image:4.595.314.544.490.693.2]In this paper first we are going to break the video into image frame to apply the algorithm on the multiple frames of video. Now our proposed saliency algorithm is applied on the frames to get the desired output. In first stage Hyper complex form algorithm is applied on the images. This gives the RGB color components of the image. After that we apply 8 times Gaussian filter the on the image, this smoothen the image. Once the image has done with the Gaussian filter then Binary filter algorithm is applied on image to remove the noise factor from image frames. In last Gaussian filter algorithm applied to get smooth and compressed image frame. The output images then combine to form the compressed and salience video. The overall diagrammatic representation of the proposed work is as shown below:-
Fig. 5 - Diagrammatic representation of work flow
4.
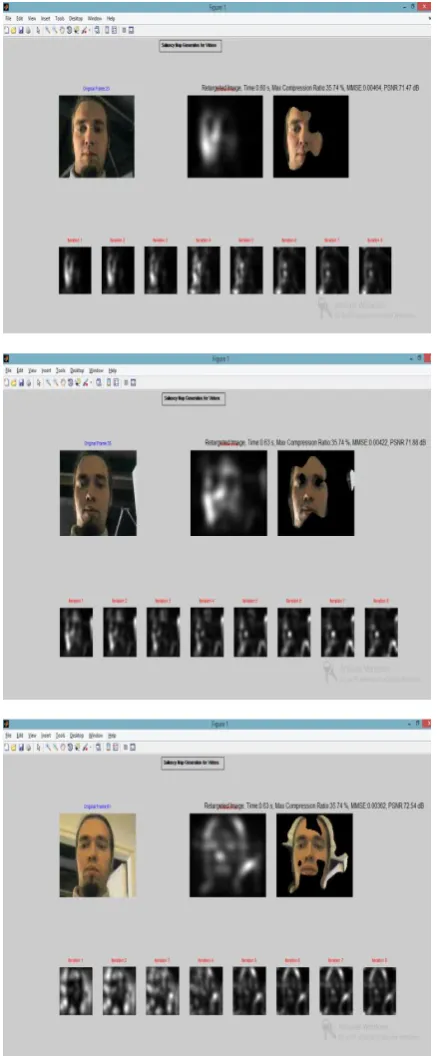
EXPERIMENTAL RESULT
INPUT
VIDEO
STAGE 1
BREAK VIDEO INTO FRAMES
STAGE 2
SALIENCY DETCTION
ALGORITHM
8 TIMES GAUSSIAN FILTER
BINARY FILTER ALGRITHM HYPER COMPLEX
FORM
OUTPUT VIDEO BINARY FILTER
ALGRITHM
Table 1. Tabular Representation of Result Data
Fig. No Time Max. Comparison ratio
MMSE PSNR
1 0.63 s 24.49 % 0.00459 71.51 dB
2 0.60 s 35.74 % 0.00464 71.47 dB
3 0.63 s 35.74 % 0.00422 71.88 dB
4 0.63 s 35.74 % 0.00362 72.54 dB
5.
CONCLUSION
In this work we find that we have optimized the saliency detection algorithm and obtained results which are good .usually PSNR between 45 dB to 50 dB, but in our case the PSNR is between 70 to 75 dB, Table 1. shows the result of proposed method. Compression ratio of upto 30% is achieved using the retargeting technique used by us.
6.
REFERENCES
[1] A. Treisman and G. Gelade, “A feature-integration theory of attention,” Cognit. Psychol., vol. 12, no. 1, pp. 97–136, 1980
[2] J. Wolfe, K. R. Cave, and S. L. Franzel, “Guided search: An alternativeto the feature integration model for visual search,” J. Experim. Psychol.:Human Percept. Perform., vol. 15, no. 3, pp. 419–433, 1989.
[3] H. Zhou, H. Friedman, and R. von der Heydt, “Coding of Border Ownership in Monkey Visual Cortex,” J. Neuroscience, vol. 20, no. 17 pp. 6594-6611, 2000. [4] T. Liu, J. Sun, N. Zheng, X. Tang, and H. Y. Shum,
“Learning to detect a salient object,” in Proc. IEEE Int. Conf. Comput. Vis. Pattern Recognit.,Jul. 2007, pp. 1–8. [5] L. Wolf, M. Guttmann, and D. Cohen-Or, “Non-homogeneous content-driven video retargeting,” in Proc. IEEE 11th Int. Conf. Comput. Vis., Oct. 2007, pp. 1–6 [6] T. Ren, Y. Liu, and G. Wu, “Image retargeting based on
global energy optimization,” in Proc. IEEE Int. Conf. Multimedia Expo, Jun.– Jul. 2009,pp. 406–409.
[7] M. Rubinstein, A. Shamir, and S. Avidan, “Improved seam carving for video retargeting,” ACM Trans. Graph., vol. 27, no. 3, pp. 1–9,2008.
[8] X. Hou and L. Zhang, “Saliency Detection: A Spectral Residual Approach,”Proc. IEEE Conf. Computer Vision and Pattern Recognition, 2007..
[9] A. Oppenheim and J. Lim, “The Importance of Phase in Signals,” Proc. IEEE, vol. 69, no. 5, pp. 529-541, May 1981.
[10]M. Hayes, J. Lim, and A. Oppenheim, “Signal Reconstruction from Phase or Magnitude,” IEEE Trans. Acoustics, Speech, and Signal Processing, vol. 28, no. 6, pp. 672-680, 1980.
[11]T. A. Ell, “Hypercomplex Spectral Transforms,” Ph.D. dissertation,Univ. Minnesota, Minneapolis, 1992. [12]“Quaternion-Fourier transforms for analysis of
two-dimensional linear time-invariant partial-differential systems,” in Proc. 32nd IEEE Conf. Decision and Control, San Antonio, TX, Dec. 15–17, 1993, vol. 1–4, pp. 1830–1841.
[13]Todd A.Ell and Stephen J. Sagwine,”Hyper complex Fourier Transform of color Image” IEEE Tran. on image processing vol. 16, no. 1, Jan- 2007.