Gray-Level Histogram based Multilevel Threshold
Selection with Bat Algorithm
V. Rajinikanth
Professor,
Department of Electronics and Instrumentation Engineering, St.Joseph’s College of Engineering,
Chennai – 600119, TN, India
J.P. Aashiha
Student,
Department of Electronics and
Communication Engineering, St.Joseph’s College of Engineering,
Chennai – 600119, TN, India
A. Atchaya
Student,
Department of Electronics and Communication Engineering, St.Joseph’s College of Engineering,
Chennai – 600119, TN, India
ABSTRACT
Image thresholding is a well known image segmentation procedure extensively attempted to obtain binary image from the gray level image. In this article, histogram based bi–level and multi-level segmentation is proposed for gray scale images using Bat Algorithm (BA). The optimal thresholds are attained by maximizing Otsu’s between class variance function. The performance of BA is demonstrated by considering five benchmark (512 x 512) images and compared it with the existing algorithms such as Particle Swarm Optimization (PSO), and Bacterial Foraging Optimization (BFO) existing in the literature. The performance assessment between algorithms is carried out using prevailing parameters such as objective function, Peak Signal to Noise Ratio (PSNR), and Structural Dissimilarity (SSIM) index. The results evident that BA provides better objective function, PSNR and SSIM compared to PSO, and BFO considered in this study.
General Terms
Swarm Intelligence, Image Processing
Kewords
Histogram, Otsu, Bat algorithm, Segmentation, PSNR, DSSIM
1.
INTRODUCTION
In imaging science, image segmentation is widely adapted to examine gray scale and colour images in medical discipline, navigation, environment modeling, automatic event detection, surveillance, pattern recognition, and damage detection. The advancement in digital imaging technique and computing technology has increased the potential of imaging science. For gray scale images, thresholding is widely considered to extract key features from input image. The main objective is to enhance the key feature of an image using the best possible bi-level as well as the multilevel threshold.
A considerable number of image segmentation techniques have been proposed and implemented by most of the researchers in the literature [1, 2]. Among them, global thresholding is judged as the most efficient procedure for image segmentation, because of its simplicity, robustness, accuracy and competence [3]. Based on the segmentation scheme, global thresholding is classified as parametric and nonparametric method.
In existing parametric thresholding procedures, the statistical parameters of the image are estimated using classical approach. Most of the classical approaches has the following drawbacks; (i) computational complexity, (ii) time
consuming, and (iii) the overall performance varies based on the image quality.
The nonparametric classical segmentation procedures such as Otsu, Kapur, and Kittler are very efficient and successful in the case of bi-level thresholding process [4]. When the number of threshold level increases, classical thresholding techniques require more computational time. Hence, in recent years, heuristic methods based bi-level and multi-level image thresholds has increased the interest of researchers because of the computational inefficiency of the classical exhaustive methods [5].
Recent literature illustrates that the heuristic and metaheuristic algorithms such as Particle Swarm Optimization (PSO) [6-8], Bacterial Foraging Optimization (BFO) [9, 10], Differential Evaluation (DE) [11,12], Artificial Bee Colony (ABC) [13], and Cuckoo Search (CS) [14] are widely considered for optimal multilevel image segmentation problems to enhance the outcome.
In this paper, the Bat Algorithm (BA) proposed by Xin-She Yang is considered [15-17]. The algorithm is allowed to explore the ‘m’ dimensional search universe, until Otsu’s between-class variance function reaches a maximal value. Proposed technique is tested on five standard 512x512 sized test images and compared with the Particle Swarm Optimization (PSO) and Bacterial Foraging Optimization (BFO) based image segmentation techniques.
The performance of considered algorithms has been evaluated using the gray-level histogram of the test images. The statistical analysis of the obtained result evident that, BA based segmentation procedure shows improved result that PSO and BFO based methods. For bi-level and multi–level segmentation process, the search time taken by BA is less compared to BFO.
The remaining part of the paper is organized as follows: overview of Otsu based segmentation procedure is discussed in section 2. The heuristic algorithm considered in this paper is discussed in section 3. Section 4 presents a brief description of the performance measures. The research findings are discussed in section 5. Section 6 provides conclusion of the present research work.
2. METHODOLOGY
work, Otsu’s nonparametric segmentation method known as between-class variance is considered to identify the optimal image thresholds. A detailed description of the between-class variance method could be found in [19].
In bi-level thresholding (for m = 2), input image is divided into two classes such as C0 and C1 (background and objects,
or vice versa) by a threshold at a level‘t’. The class C0
encloses the gray levels in the range 0 to t-1 and class C1
encloses the gray levels from t to L – 1. The probability distributions for the gray levels C0 and C1 can be expressed
as; ) ( 0 1 ... ) ( 0 0 0 t t p t p C and ) ( 1 1 ... ) ( 1 1 t L p t t p C (1) where 1 0 ) ( 0
t i i p t , 1 ) ( 1
L t i i p t and L=256
The mean levels μ0 and μ1for C0 and C1 can be expressed as;
) t ( ip t i i
1 0 0 0
and ) t ( ip L t i i
1 1 1
(2)The mean intensity (μT) of the entire image can be represented
as;
T
0
0
1
1and
0
1
1
The objective function for the bi-level thresholding problem can be expressed as;
Maximize J(t) = σ0 + σ1 (3)
where σ0=ω0( μ0- μT)2 and σ1=ω1( μ1- μT)2
The above discussed procedure can be extended to a multi-level thresholding problem for various ‘m’ values as follows; Let us consider that there are ‘m’ thresholds (t1, t2, …, tm),
which divide the input image into ‘m’ classes: C0 with gray
levels in the range 0 to t-1, C1 with enclosed gray levels in the
range t1 to t2-1, …, and Cm includes gray levels from tm to
L – 1.
The objective function for the multi-level thresholding problem can be expressed as;
Jmax(t) = σ0 + σ1+...+ σm (4)
where σ0=ω0( μ0- μT)2,σ1=ω1( μ1- μT)2, … , σm= ωm( μm - μT)2
In this paper, objective functions are assigned for m=2, m=3, m=4, and m=5.
3. HEURISTIC ALGORITHMS
Literature evident that, in the past decade, heuristic algorithms are successfully implemented to solve variety of engineering optimization problems [20-23, 29,30].
3.1 Particle Swarm Optimization
PSO is an evolutionary optimization technique, developed due to the inspiration of the social activities in flock of birds and school of fish [24].
The PSO algorithm has two basic equations such as Velocity
) ( 2 2 ) ( 1 1 . ) 1
(t WtVit CR Pit Sit C R Git Sit i
V
(5) ) 1 ( ) 1
(t XitVi t i
X (6)
where W – inertia weight = 0.75, t Vit - current velocity of particle, Vi(t1)- updated velocity of particle, Xit- current position of particle, Xi(t1)- updated position of particle, R1, R2 are the random numbers [0,1], and C1 = C2 = 2.1 [25].
3.2 Bacterial Foraging Optimization
BFO is a nature inspired stochastic search technique based on mimicking the foraging behavior of E. coli bacteria [26]. Due to the merits such as high computational efficiency, easy implementation and stable convergence, it is widely applied to solve a range of complex engineering optimization problems. BFO algorithm discussed by Rajinikanth and Latha (2012a) is adapted in this work [26].
The initial algorithm parameters are assigned as follows; Number of E.Coli bacteria = N
Nc =
2 N
; Ns = Nre
3 N
; Ned
4 N
; Nr =
2 N
; Ped =
Nr
N ed N
; dattractant = Wattractant = N
s N
; and
hrepellant = Wrepellent = N
c N
.
The main advantage of EBFO compared to the classical BFO is, the number of initializing parameters to be assigned for the search in EBFO is reduced to just two i.e. N (E. Coli size) and D (search dimension).
3.3 Bat Algorithm
The existing Bat Algorithm (BA) was based on the echolocation or bio-sonar characteristics of microbats. BA was developed by modeling the navigating and hunting manners of bats. The main dealings of Bats when finding/hunting a prey is, it will tend to diminish the loudness and amplify the rate of emitted ultrasonic sound signal when they hunt prey.
The classical BA has three mathematical models such as velocity update equation, position update equation, and frequency vector as given below;
Velocity update: Vi(t1)Vi(t)(Xi(t)Gbest)Fi (7) Position update: Xi(t1)Xi(t)Vi(t1)
(8) Frequency vector: Fi Fmin(Fmax Fmin)
(9) where β is a random number in the range [0,1]. From Eqn.7, it is noted that, the velocity update mainly relies on frequency vector value.
t A old X new
X
(10) where ε is a random number in the range [-1,1] and A is the loudness of emitted sound by bats used during the exploration of search space.
The minimum and maximum value of the loudness variable A is chosen as A0 = 10, and Amin =1 (which decay in steps of
0.1).
The other equations available in the BA are presented below;
) ( ) 1 (t Ai t i
A
(11) )]
exp( 1 )[ 0 ( ) 1
(t ri t
i
r
(12) where the constants α, and γ are assigned as; α = γ = 0.75. A detailed analysis of the bat algorithm could be found in [27, 28].
4. IMPLEMENTATION
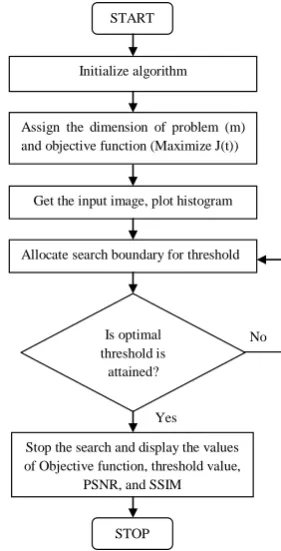
The multi-level thresholding problem deals with finding optimal thresholds within the gray scale range [0, L−1] that maximize a fitness criterion J(t). Otsu’s between class variance function is employed to find the threshold values. The search dimension of the optimization problem is assigned based on the number of thresholds (m) considered. In this paper, optimal multi-level thresholding has been carried out by an unsupervised global-level nonparametric approach. In this work, LF driven BFO algorithm is employed to find the optimal threshold values by maximizing the Otsu’s objective function. Fig. 1 depicts the flow chart of the proposed work.
The performance of the hybrid algorithm is assessed using the well known parameters such as peak-to-signal ratio (PSNR) and structural dissimilarity indices (DSSIM) [6].
The PSNR is mathematically represented as;
) , ( 255 10
log 0 2 y) P SNR(x,
y x MSE
;dB (13)
where MSE – Mean Square Error between original and segmented image.
The SSIM is normally used to estimate the image quality and inter dependencies between the original and processed image.
) 2 )(
1 2 2 (
) 2 2
)( 1 2
( y) SSIM(x,
2
2 C
y x C y x
C xy C y x
(14)
where μx = average of x, μy= average of y, σx2 = variance of x,
σy2 = variance of y, σxy = covariance of x and y, C1= (k1L)2
and C2= (k1L) 2
[image:3.595.356.497.71.347.2]stabilize the division with weak denominator, L = 256, k1 = 0.01, and k2 = 0.03.
Fig. 1: Flow chart of segmentation method
Structural dissimilarity (DSSIM) is a distance metric derived from SSIM (though the triangle inequality is not necessarily satisfied).
2 ) , ( 1 ) ,
(xy SSIM x y
DSSIM (15)
5. RESULTS AND DISCUSSIONS
Otsu guided, Bat algorithm based multi-level thresholding techniques have been tested on different standard 512 x 512 test images such as Mandrill, Bridge, Livingroom, Crane and Bee. For the PSO, BFO, and BA, the total population size is assigned as 20, and the total number of run for the search process is chosen as 250.
Simulation work is performed on a work station with an AMD C70 Dual Core 1 GHz CPU with 4GB of RAM and equipped with MATLAB R2010a software. During the experiment, each image is examined with a number of thresholds such as m = 2 to 5. The simulation study is repeated seven times individually and the best value among the search is recorded as the optimal threshold value. Initially the PSO, BFO, and BA based optimization is tested on the Mandrill image.
Fig 2. (a) represents the original gray scale test image, and 2. (b) shows the histogram. For this image, the span of gray level is from 8 to 212.
START
Get the input image, plot histogram Initialize algorithm
Assign the dimension of problem (m) and objective function (Maximize J(t))
Stop the search and display the values of Objective function, threshold value,
PSNR, and SSIM Is optimal threshold is
attained?
Allocate search boundary for threshold
STOP
No
(a) Mandrill (b) Histogram
Fig 2: Orignal image and its histogram
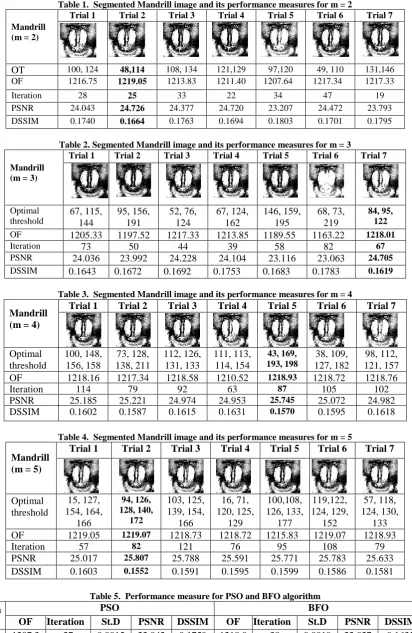
Initially, BA based search is proposed for m = 2. The search process is repeated seven times and the optimal threshold values and the corresponding performance measures such as objective function (OF) = Jmax(t), total number of iterations
[image:4.595.322.534.81.278.2]taken to terminate the search process, PSNR in dB, and DSSIM values are presented in Table 1. For bi-level thresholding, Trial 2 offered better performance measures compared to other trials. Hence, Trial 2 value is chosen as the best possible value. Similar procedure is repeated using PSO and BFO algorithms and corresponding performance measure values are recorded (refer Table 5).
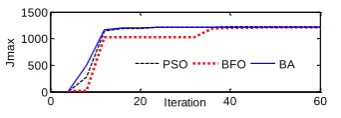
Fig 3. Convergence of search for mandrill image
Convergence of optimization search for bi-level thresholding is presented in Fig 3. From this, it is observed that, search efficiency of the BA is superior compared to PSO and BFO. The BA algorithm offered the optimal threshold at 25th iteration, where as the PSO and BFO converged at 27th and 38th iterations respectively.
The above discussed segmentation procedure is then implemented on the Mandrill image for m = 3, 4, and 5 using BA, PSO, and BFO.
Table 2. presents the BA based optimized threshold value and corresponding performance measure values for m=3.
Table 3. shows best possible threshold value and performance measure values for m=4.
Table 4. presents optimal threshold values and performance measure for m=5.
In above Tables, the highlighted column values are chosen as the best value among seven trials.
(a) Bi-level (b) m = 3
(c) m = 4 (d) m = 5
Fig. 4 Optimal threshold for the mandril image for various ‘m’ values
Fig 4. Illustrate the optimal threshold values of gray scale mandrill image. Fig. 4 (a) shows gray level histogram of mandrill image for m = 2. Fig. 4 (b), (c), (d) shows the gray level histogram for m = 3, 4, and 5 respectively.
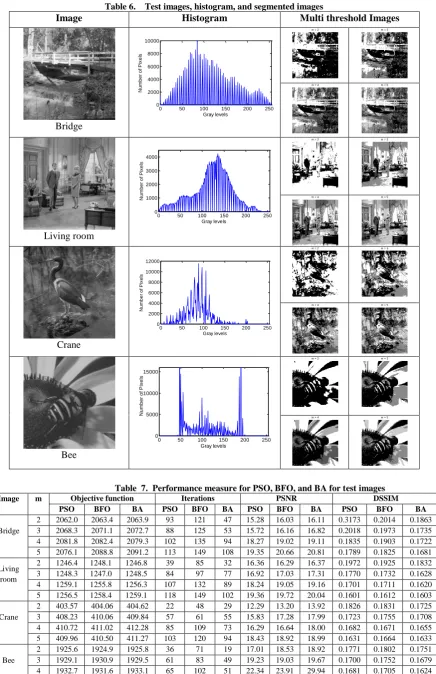
Gray-level histogram based bi-level and multi-level threshold selection procedure is then extended to 512x512 sized gray scale images such as Bridge, Living room, Crane, and Bee. The major reason to select the above mentioned images is, these images have a randomly varying pixel level with respect to the gray levels.
The histogram of these images is more oscillatory, compared to histogram of mandrill image. Finding an optimal threshold on the complex histogram is a challenging task.
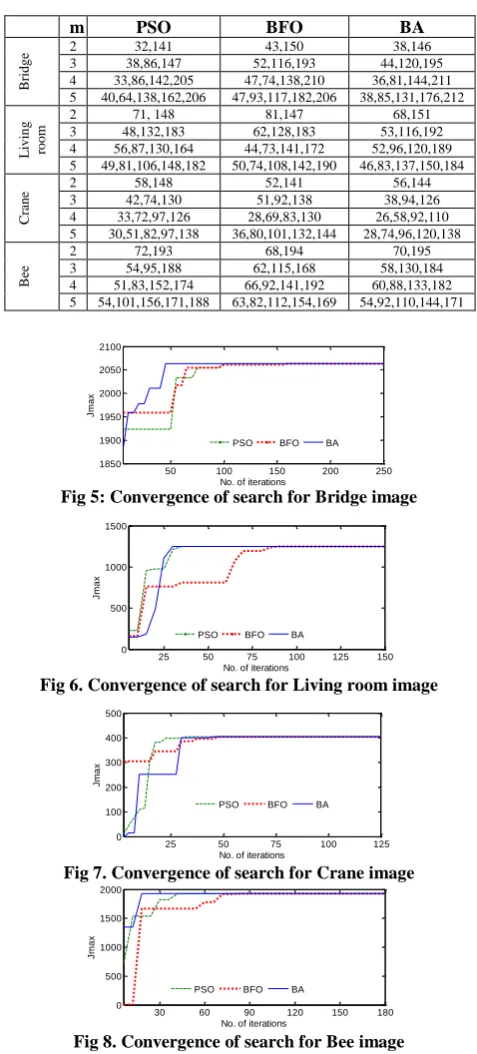
Initially, we attempted the heuristic algorithm based search on the gray–level histogram of the bridge image. The histogram pattern is very complex compared to other images. Hence the convergence time taken by the heuristic algorithms is slightly larger than Crane and Bee image. Later, the procedure is extended for other gray scale images. The thresholded images (for m=2,3,4, and 5) are illustrated in Table 6, and the corresponding performance measures and optimal threshold values are presented in Table7 and Table 8 respectively. From Table 7, it is observed that, BA offers better objective function, PSNR, and DSSIM compared to PSO and BFO. Fig. 5 to Fig.8 shows the convergence of optimization search for the considered test images when m =2. For Bridge, Living room, and Bee images, the BA based search convergence is better. Whereas for Crane image, PSO shows faster convergence than BA and BFO.
0 50 100 150 200 250 0
500 1000 1500 2000 2500 3000
Gray levels
N
u
m
b
e
r
o
f
P
ix
e
ls
0 20 40 60
0 500 1000 1500
Iteration
J
m
a
x
PSO BFO BA
0 50 100 150 200 250 0
500 1000 1500 2000 2500 3000
Gray levels
N
u
m
b
e
r
o
f
p
ix
e
ls
m = 2 48 114
0 50 100 150 200 250 0
500 1000 1500 2000 2500 3000
Gray levels
N
u
m
b
e
r
o
f
p
ix
e
ls
m = 3 84 95 122
0 50 100 150 200 250 0
500 1000 1500 2000 2500 3000
Gray levels
N
u
m
b
e
r
o
f
p
ix
e
ls
m = 4 43 169 193 198
0 50 100 150 200 250 0
500 1000 1500 2000 2500 3000
Gray levels
N
u
m
b
e
r
o
f
p
ix
e
ls
m = 5 94 126 128
[image:4.595.84.255.333.392.2]Table 1. Segmented Mandrill image and its performance measures for m = 2
Mandrill (m = 2)
Trial 1 Trial 2 Trial 3 Trial 4 Trial 5 Trial 6 Trial 7
OT 100, 124 48,114 108, 134 121,129 97,120 49, 110 131,146 OF 1216.75 1219.05 1213.83 1211.40 1207.64 1217.34 1217.33
Iteration 28 25 33 22 34 47 19
PSNR 24.043 24.726 24.377 24.720 23.207 24.472 23.793
DSSIM 0.1740 0.1664 0.1763 0.1694 0.1803 0.1701 0.1795
Table 2. Segmented Mandrill image and its performance measures for m = 3
Mandrill (m = 3)
Trial 1 Trial 2 Trial 3 Trial 4 Trial 5 Trial 6 Trial 7
Optimal threshold
67, 115, 144
95, 156, 191
52, 76, 124
67, 124, 162
146, 159, 195
68, 73, 219
84, 95, 122
OF 1205.33 1197.52 1217.33 1213.85 1189.55 1163.22 1218.01
Iteration 73 50 44 39 58 82 67
PSNR 24.036 23.992 24.228 24.104 23.116 23.063 24.705
DSSIM 0.1643 0.1672 0.1692 0.1753 0.1683 0.1783 0.1619
Table 3. Segmented Mandrill image and its performance measures for m = 4 Mandrill
(m = 4)
Trial 1 Trial 2 Trial 3 Trial 4 Trial 5 Trial 6 Trial 7
Optimal threshold
100, 148, 156, 158
73, 128, 138, 211
112, 126, 131, 133
111, 113, 114, 154
43, 169, 193, 198
38, 109, 127, 182
98, 112, 121, 157
OF 1218.16 1217.34 1218.58 1210.52 1218.93 1218.72 1218.76
Iteration 114 79 92 63 87 105 102
PSNR 25.185 25.221 24.974 24.953 25.745 25.072 24.982
DSSIM 0.1602 0.1587 0.1615 0.1631 0.1570 0.1595 0.1618
Table 4. Segmented Mandrill image and its performance measures for m = 5 Mandrill
(m = 5)
Trial 1 Trial 2 Trial 3 Trial 4 Trial 5 Trial 6 Trial 7
Optimal threshold
15, 127, 154, 164,
166
94, 126, 128, 140,
172
103, 125, 139, 154,
166
16, 71, 120, 125,
129
100,108, 126, 133,
177
119,122, 124, 129,
152
57, 118, 124, 130,
133
OF 1219.05 1219.07 1218.73 1218.72 1215.83 1219.07 1218.93
Iteration 57 82 121 76 95 108 79
PSNR 25.017 25.807 25.788 25.591 25.771 25.783 25.633
DSSIM 0.1603 0.1552 0.1591 0.1595 0.1599 0.1586 0.1581
Table 5. Performance measure for PSO and BFO algorithm
m PSO BFO
OF Iteration St.D PSNR DSSIM OF Iteration St.D PSNR DSSIM
2 1207.3
1
27 0.0015 22.042 0.1759 1218.0
3
38 0.0019 22.027 0.1635
3 1221.4
4
48 0.0712 23.916 0.1634 1220.6
1
64 0.0037 23.054 0.1648
4 1229.5
3
51 0.0805 24.060 0.1681 1227.8
2
122 0.0523 24.368 0.1626
5 1227.0
8
74 0.0814 23.521 0.1595 1231.1
8
146 0.0495 24.503 0.1617
Table 6. Test images, histogram, and segmented images
Image Histogram Multi threshold Images
Bridge
Living room
Crane
Bee
Table 7. Performance measure for PSO, BFO, and BA for test images
Image m Objective function Iterations PSNR DSSIM
PSO BFO BA PSO BFO BA PSO BFO BA PSO BFO BA
Bridge
2 2062.0 2063.4 2063.9 93 121 47 15.28 16.03 16.11 0.3173 0.2014 0.1863 3 2068.3 2071.1 2072.7 88 125 53 15.72 16.16 16.82 0.2018 0.1973 0.1735 4 2081.8 2082.4 2079.3 102 135 94 18.27 19.02 19.11 0.1835 0.1903 0.1722 5 2076.1
0
2088.8 2091.2 113 149 108 19.35 20.66 20.81 0.1789 0.1825 0.1681
Living room
2 1246.4 1248.1 1246.8 39 85 32 16.36 16.29 16.37 0.1972 0.1925 0.1832 3 1248.3 1247.0 1248.5 84 97 77 16.92 17.03 17.31 0.1770 0.1732 0.1628 4 1259.1 1255.8 1256.3 107 132 89 18.24 19.05 19.16 0.1701 0.1711 0.1620 5 1256.5 1258.4 1259.1 118 149 102 19.36 19.72 20.04 0.1601 0.1612 0.1603
Crane
2 403.57 404.06 404.62 22 48 29 12.29 13.20 13.92 0.1826 0.1831 0.1725 3 408.23 410.06 409.84 57 61 55 15.83 17.28 17.99 0.1723 0.1755 0.1708 4 410.72 411.02 412.28 85 109 73 16.29 16.64 18.00 0.1682 0.1671 0.1655 5 409.96 410.50 411.27 103 120 94 18.43 18.92 18.99 0.1631 0.1664 0.1633
Bee
2 1925.6 1924.9 1925.8 36 71 19 17.01 18.53 18.92 0.1771 0.1802 0.1751 3 1929.1 1930.9 1929.5 61 83 49 19.23 19.03 19.67 0.1700 0.1752 0.1679 4 1932.7 1931.6 1933.1 65 102 51 22.34 23.91 29.94 0.1681 0.1705 0.1624
0 50 100 150 200 250 0
2000 4000 6000 8000 10000
Gray levels
N
u
m
b
e
r
o
f
P
ix
e
ls
m = 2 m = 3
m = 4 m = 5
0 50 100 150 200 250 0
1000 2000 3000 4000
Gray levels
N
u
m
b
e
r
o
f
P
ix
e
ls
m = 2 m = 3
m = 4 m = 5
0 50 100 150 200 250 0
2000 4000 6000 8000 10000 12000
Gray levels
N
u
m
b
e
r
o
f
P
ix
e
ls
m = 2 m = 3
m = 4 m = 5
0 50 100 150 200 250 0
5000 10000 15000
Gray levels
N
u
m
b
e
r
o
f
P
ix
e
ls
m = 2 m = 3
Table 8. Optimal bi-level and multi level threshold values
m PSO BFO BA
B
ridge
2 32,141 43,150 38,146 3 38,86,147 52,116,193 44,120,195 4 33,86,142,205 47,74,138,210 36,81,144,211 5 40,64,138,162,206 47,93,117,182,206 38,85,131,176,212
L
ivi
n
g
room
2 71, 148 81,147 68,151 3 48,132,183 62,128,183 53,116,192 4 56,87,130,164 44,73,141,172 52,96,120,189 5 49,81,106,148,182 50,74,108,142,190 46,83,137,150,184
C
ra
ne
2 58,148 52,141 56,144 3 42,74,130 51,92,138 38,94,126 4 33,72,97,126 28,69,83,130 26,58,92,110 5 30,51,82,97,138 36,80,101,132,144 28,74,96,120,138
Bee
[image:7.595.47.286.115.643.2]2 72,193 68,194 70,195 3 54,95,188 62,115,168 58,130,184 4 51,83,152,174 66,92,141,192 60,88,133,182 5 54,101,156,171,188 63,82,112,154,169 54,92,110,144,171
Fig 5: Convergence of search for Bridge image
Fig 6. Convergence of search for Living room image
Fig 7. Convergence of search for Crane image
Fig 8. Convergence of search for Bee image
6. CONCLUSION
In this study, gray scale histogram based optimal bi-level and multi-level image thresholding problem is discussed using PSO, BFO, and Bat algorithm. Maximization of Otsu’s between class variance function is chosen as the objective function. In order to evaluate the performance of considered heuristic algorithms, five gray scale test images are examined. When the assigned threshold level is two (m = 2), the number of iteration taken by the algorithm is small and the iteration value increases with the increase in threshold levels. From this
study, the observation is that, BA offers better performance compared to PSO and BFO algorithms considered in this study.
7. REFERENCES
[1] Lee, S.U., Chung S.Y. and Park, R.H. 1990. A comparative performance study techniques for segmentation. computer vision, graphics and image processing, 52(2), 171 – 190.
[2] Pal, N.R. and Pal, S.K. 1993. A review on image segmentation techniques. Pattern Recognition, 26 (9), 1277 – 1294.
[3] Agrawal, S., Panda, R., Bhuyan, S. and Panigrahi, B.K. 2013. Tsallis entropy based optimal multilevel thresholding using cuckoo search algorithm. Swarm and Evolutionary Computation, 11, 16–30.
[4] Sezgin, M. and Sankar, B. 2004. Survey over image thresholding techniques and quantitative performance evaluation. Journal of Electronic Imaging, 13(1), 146 – 165.
[5] Akay, B. 2013. A study on particle swarm optimization and artificial bee colony algorithms for multilevel thresholding. Applied Soft Computing, 13(6), 3066– 3091.
[6] Sathya, P.D. and Kayalvizhi, R. 2012. Comparison of intelligent techniques for multilevel thresholding problem. International Journal of Signal and Imaging Systems Engineering, 5(1), 43-57.
[7] Raja, N.S.M., Kavitha, N. and Ramakrishnan, S. 2012. Analysis of vasculature in human retinal images using particle swarm optimization based Tsallis multi-level thresholding and similarity measures. In B.K. Panigrahi et al. (Eds.): SEMCCO 2012, LNCS 7677, 380-387. [8] Manikantan, K., Arun, B.V. and Yaradoni, D.K.S. 2012.
Optimal multilevel thresholds based on Tsallis entropy method using golden ratio particle swarm optimization for improved image Segmentation. Procedia Engineering, 30, 364 – 371.
[9] Sathya, P.D. and Kayalvizhi, R. 2010. Optimum Multilevel Image Thresholding Based on Tsallis Entropy Method with Bacterial Foraging Algorithm. International Journal of Computer Science Issues, 7(5), 336-343. [10]Sathya, P.D. and Kayalvizhi, R. 2011. Modified
bacterial foraging algorithm based multilevel thresholding for image segmentation. Engineering Applications of Artificial Intelligence, 24, 595–615. [11]Sarkar, S. and Das, S. 2013. Multilevel image
thresholding based on 2D histogram and maximum Tsallis entropy – A Differential Evolution Approach. IEEE T. on Image Processing, 22(12), 4788-4797. [12]Sarkar, S., Das, S. and Chaudhuri, S. S. 2012. Multilevel
image thresholding based on Tsallis entropy and differential evolution. In B.K. Panigrahi et al. (Eds.): SEMCCO 2012, LNCS 7677: 17-24.
[13]Horng, M-H. 2011. Multilevel thresholding selection based on the artificial bee colony algorithm for image
50 100 150 200 250 1850
1900 1950 2000 2050 2100
No. of iterations
J
m
a
x
PSO BFO BA
25 50 75 100 125 150 0
500 1000 1500
No. of iterations
J
m
a
x
PSO BFO BA
25 50 75 100 125 0
100 200 300 400 500
No. of iterations
J
m
a
x
PSO BFO BA
30 60 90 120 150 180 0
500 1000 1500 2000
No. of iterations
J
m
a
x
segmentation. Expert Systems with Applications, 38(11), 13785–13791.
[14]Panda, R., Agrawal, S. and Bhuyan, S. 2013. Edge magnitude based multilevel thresholding using Cuckoo search technique. Expert Systems with Applications, 40(18): 7617–7628.
[15]Yang, X-S. (2010). A new metaheuristic bat-inspired algorithm. In: Nature Inspired Cooperative Strategies for Optimization (NICSO 2010) (Eds. Cruz C., Gonzalez J., Krasnogor N., and Terraza G.), Springer, SCI 284, pp 65-74.
[16]Yang, X-S. (2008). Nature-inspired Metaheuristic Algorithms. Luniver Press.
[17]Xin-She Yang and Amir H. Gandomi. 2012. Bat Algorithm: A Novel Approach for Global Engineering Optimization. Engineering Computations, 29 (5), 464— 483.
[18]Otsu, N. A. 1979. Threshold selection method from Gray-Level Histograms. IEEE Transaction on Systems, Man and Cybernetics, 9(1), 62-66.
[19]Hamed Shah–Hosseini. 2012. Intelligent water drops algorithm for automatic multilevel thresholding of grey– level images using a modified Otsu's criterion, International Journal of Modelling, Identification and Control, 15 (4), 241-249.
[20]Alyaseri, S. and Aljanaby, A. 2014. Population based Heuristic Approaches for Grid Job Scheduling.International Journal of Computer Applications91(5), 45-50.
[21]Ouarda, A.and Bouamar, M. 2014. A Comparison of Evolutionary Algorithms: PSO, DE and GA for Fuzzy C-Partition. International Journal of Computer Applications91(10), 32-38.
[22]Vijayvargiya, G., Silakari, S. and Pandey, R. 2014. A Novel Medical Image Compression Technique based on Structure Reference Selection using Integer Wavelet Transform Function and PSO Algorithm.International Journal of Computer Applications91(11), 9-13.
[23]Ruba Talal. 2014. Comparative Study between the (BA) Algorithm and (PSO) Algorithm to Train (RBF) Network at Data Classification. International Journal of Computer Applications 92(5), 16-22.
[24]Kennedy, J. and Eberhart, R. C. 1995. Particle swarm optimization. In Proceedings of IEEE international conference on neural networks : 1942-1948.
[25]Rajinikanth,V. and Latha, K. 2012. Setpoint weighted PID controller tuning for unstable system using heuristic algorithm. Archives of Control Sciences, 22 (LVIII), 481–505.
[26]Rajinikanth, V. and Latha, K. 2012a. Controller parameter optimization for nonlinear systems using enhanced bacteria foraging algorithm. Applied Computational Intelligence and Soft Computing, Article ID 214264, 12 pages.
[27]Kotteeswaran, R. and Sivakumar, L. 2013. Optimal Partial-Retuning of Decentralised PI Controller of Coal Gasifier Using Bat Algorithm. In B.K. Panigrahi et al. (Eds.): SEMCCO 2013, Part I, LNCS 8297, 750–761. [28]Kotteeswaran, R. and Sivakumar, L. 2013. A Novel Bat
Algorithm Based Re-tuning of PI Controller of Coal Gasifier for Optimum Response. In R. Prasath and T. Kathirvalavakumar (Eds.): MIKE 2013, LNAI 8284, 506-517.
[29]Ghamisi, P., Couceiro, M. S., Benediktsson, J. A. and Ferreira, N. M. F. 2012. An efficient method for segmentation of images based on fractional calculus and natural selection. Expert Syst. Appl., 39 (16), 12407– 12417.