Implementation of Decision Support System (DSS)
through the Integration of Commercial Remote Sensing
(CRS), Model-View-Controller (MVC) Architecture and
Object-Relational Mapping (ORM)
Scott O’Connor
University of Massachusetts Dartmouth
North Dartmouth, MA
Ramprasad
Balasubramanian
University of Massachusetts Dartmouth
North Dartmouth, MA
ABSTRACT
In order to aid in the processes of data collection, interpolation, analysis, and predictive model development the integration of commercial remote sensing and spatial information technologies (CRS&SI) with object oriented modeling (OOM) using the model view controller architecture (MVC) has been applied. A Decision Support System (DSS) application that uses CRS&SI for collecting atmospheric, subsurface, and predicted weather data, is used to compare, interpolate, measure, predict, and determines the depth of frost and thaw penetration into the subsurface of roadways across New England, This process is used in order to guide State Departments of Transportation (DOT) in determining when to impose Seasonal Load Restrictions (SLR). Seasonal load restrictions limit the travel of heavy trucks on certain roads such that state DOT’s can limit the damage to the roadway surface. The implemented DSS consists of a web based front end graphical user interface (GUI) that leverages popular web based technologies, programming interfaces, data collection scripts, data evaluation scripts, data interpolation scripts, predictive modeling, and a centralized database. The database was developed for storing newly collected, historic, and predicted data. This paper includes the description of the general purpose and use of the system and a discussion regarding the architecture, individual components, interactions, and a description of the sequence of events for data collection, processing, prediction, and interpolation.
General Terms
Commercial Remote Sensing and spatial information technologies (CRS&SI), Model View Controller Architecture (MVC), Object-Relational Mapping (ORM)
Keywords
commercial remote sensing, decision support system, seasonal load restrictions, frost-thaw predictive model, and satellite data collection, model view controller, object relational mapping
1.
INTRODUCTION
A research team from the University of Massachusetts Dartmouth (UMassD) in collaboration with the United States Department of Agriculture (USDA) Forest Service (FS), the Maine Department of Transportation (MaineDOT), and the New Hampshire Department of Transportation (NHDOT) were sponsored by the United States Department of Transportation Research and Innovative Technology Administration (USDOT’s RITA) in the development of this Decision Support System (DSS). The purpose of the
developed system is primarily for remote sensing and monitoring of roadway surfaces such that state DOTs can more efficiently impose restriction on types of traffic, particularly heavy vehicles, based on roadway conditions during spring thaw and recovery periods. Regions that are majorly affected by these seasonal restrictions include New England and other northern regions throughout the country, including Minnesota [1,2], Washington [13], New Hampshire, and Maine. [5,6]
In this system, records of sensed atmospheric data, predicted atmospheric data, and subsurface data are collected. Calculations are executed for data interpolations, calculations, and prediction algorithms for support within the system. The collected raw data and processed data that has been output on the decision support system is stored for use in helping DOTs determine whether or not roadways should be considered for seasonal load restrictions (SLR).
The decision of imposition is based on the calculated and stored data which is used to determine the optimal date for closing travel on the roadway for a period of time for heavy vehicle traffic. Determining the optimal time is critical since a closure of roadway can be effective at preventing costly surface damage as well as minimizing closure’s effect on interstate commerce. The described system helps by accelerating time between the discovery of vulnerabilities on the roadway and the posting of roadway closures through the use of commercial remote sensing. The DSS also helps in the prevention of false impositions of SLRs and minimizes inconveniences to commercial truck drivers and minimizes fuel costs for the commercial vehicle industry, which are often required to reroute deliveries upon receiving SLR notifications.
At the present time most jurisdictions make use of manual techniques for collecting subsurface data collected at individual roadside locations, and through regionally available atmospheric data. This manual process of data collection is tedious and delayed due to large distances between processing centers and collection sites. [9,10,11,12] This is one of the causes for over-estimation of when SLR should be imposed, adding to inconvenience and cost for longer periods of time. This research project eliminates manual data collection replacing it with a multi-part system using
(1) commercial remote sensing and spatial information (CRS&SI) technologies utilizing satellite networks for data transfer and information staging,
(3) object oriented modeling of the data
(4) multiple background processes for fetching and processing staged data, and
(5) a user friendly web application for end users of the Decision Support System.
In order to begin drafting and designing the developed system, research extended into topics including CRS&SI for data collection at various global sites, ORM for modeling of data and manipulations of data within the system, and the use of a lightweight MVC web based application interacting with objects generated using the ORM library.
Commercial remote sensing and spatial information (CRS&SI) technologies are used to remotely sense, detect, monitor, and reports various measurements in the monitored environments. This detection and monitoring can be used for analysis, interpolation, and applied to studies and projects. US DOT RITA website categorizes the application of CRS&SI to include any remote sensing technology utilized in the process of data collection including from non-contact above-ground platforms. These platforms include, in this case, satellites, and cellular networks. US DOT has historically identified and supported the use of remote sensing technologies that can be used for aiding the safe and efficient transport of persons or freight using the national transportation infrastructure. The fore mentioned system which has been proposed and developed addresses both of these common uses of CRS&SI.
Object-Relational Mapping is a software development technique that utilizes the relationships that exist inherently within a relational database structure whereas the database structure can be loaded into relational objects which can then be accessed through the current programming language. The developed system employs a large, modular, relational database to house objects that are manipulated by the system. [22, 24].
The ORM software which was chosen for use in this project is titled php.activerecord, which the project website claims to be inspired by the Ruby on Rails implementation. This library was used to map the relational database tables directly to objects within the web application backend.
Model-View-Controller (MVC) architecture is a software pattern which lends itself to the separation of concerns between the three named components (models, views, and controller). This separation of concerns allows for easily readable, easily maintainable, and organized structure of information and code. [25,26,27]
Models in MVC architecture represent data or knowledge. A model can be familiarized as being very similar to an object or multiple objects in a traditional Object Oriented design.
Models in MVC Architecture represent data or knowledge. A model can be familiarized as being very similar to an object or multiple objects in a traditional Object Oriented design. Models deal with the manipulations of data and objects within the software. [25,26,27]
Controllers deal exclusively with the interactions between the model and the view (what the user sees). A Controller acts as a middle man between the Model performing data operations, and the view presenting outputs to the user. An example of the role of a controller would be the collection of inputs from the view. [25,26,27]
MVC architecture has become very popular for web
MVC has not been officially set in stone. With this, multiple programming packages, languages, and frameworks have interpreted the separation of concerns in slightly different manners, with some introducing new elements such as the ViewModel which is essentially just another Model that is created to deal with interactions between the Model and View exclusively. This has been termed as MVVC architecture. (Model-View-ViewModel-Controller)
The web application backend uses CodeIgniter, a lightweight MVC framework with the php.activerecord ORM library for selecting data, and displaying data, and performing simple business logic on select data.
By pairing CRS&SI technologies with popular software development tools and techniques, a comprehensive and complete system for addressing the goals of a decision support system can be developed.
2.
GOALS
The four goals of the implemented DSS are aligned with that of many DSS’s in terms of structure, operation, and outcome when applied to the domain of SLR determinations.
(1) The DSS should be built such that it has the means of taking a series of inputs and input channels for analysis.
(2) The application of the DSS should be build such that the analysis of user knowledge and expertise through scripts, prediction algorithms can generate a series of outputs.
(3) The generated series of outputs can be interpreted in some form of usable fashion in order to make an informed decision.
(4) Through the means of the previous goals, the overall implementation is used to improve efficiency of an otherwise tedious task, speed up the time to decision from time of input, strengthen the organization of data, and promote future discovery, learning, and communication within the given domain.
3.
PREVIOUS SYSTEM
Previously, load restrictions have been imposed on a fixed basis based on a wide date range, or have been imposed after simple visual inspection during a roadside visit. Studies show that more refined imposition and removal of load restrictions can help limit damage to roadway surfaces. [9,10,11,12] Instances where data collection, processing, and interpolation have occurred have historically been disjoint and performed manually, sometimes days or weeks after visiting the roadside site. This delay leads to inaccurate restriction time frames, sometimes ranging in weeks. Studies in Minnesota have suggested that differences in roadway surfaces, especially gravel based surfaces might require longer restriction periods, up to 3 weeks [3], while others studies from Canada suggest delays up to 5 weeks are more appropriate. Sometimes, weather conditions are prohibitive such that roadside visitation is near impossible during heavy blizzard-like or other weather conditions. Commercial remote sensing technologies are of great use for cases such as these, they can limit time required, and perform in most suboptimal conditions for travel.
sensing, as concluded in technical roadway reports [5,6,7,8] and published studies [9,10,11,12] These studies also outline the manual collection, and the a manual interpolation of the data that currently occurs, as well as a manual comparison of the sensed values. These tasks must occur on the collected data from the non-networked devices. This completion of this process is extremely tedious and it requires a lot of time and effort to just collect the data. Processing the data and predictive modeling are two other hurdles that must be addressed.
Predictive models have existed in various capacities for predicting frost and thaw penetration based upon freezing atmospheric temperature, and comparison of the output from these predictive algorithms has been another taxing process. Original predictive models were developed at the University of Washington [13] and Waterloo, Canada [14] and have been used throughout the nation.
When integrating all of the data collection, interpolation, and predictive modeling, in a manual fashion, the reuse of data is not really addressed. This is because of the cumbersome processes of storing, processing, and comparing data without automated computing processes. Processing the data alone is also very time-consuming since it is not automated. [9,10,11,12] Due to these circumstances it could take days, weeks, or months depending on the location or amount of data collected to determine the depth of frost and thaw penetration under a roadway. Consequently, seasonal load restrictions have typically been placed based on a fixed date or in some cases a quick visual determination. This is not an optimal solution for the roadway or for the heavy trucking industry. Solutions such as this can either underestimate the imposed restrictions time period, causing more roadway damage or overestimate the restricted time period, costing more in fuel consumption for the trucking industry. Obviously, there is a trade off in both estimates having some type of economic impacts and negatively affecting the state either way. Appropriate timing of restrictions certainly optimizes the solution of road closures to best suit the balance of all of these factors [21]. These are strong reasons for the development of a DSS to aide in the collection, processing, interpolation, and interpretation of data.
4.
METHODOLOGY
General methodologies used in the construction of the system built are composed of several distinct parts as previously outlined in the proposal and preliminary publications [21,22,23,24]. These parts include the integration of services, miscellaneous devices, creation of databases, configuration of appropriate server software and packages, custom data polling scripts, custom interpolation scripts, and a custom secure web application interface. Background graphical chart generation scripts have been replaced with an instant graph generation package, Google Charts, for on-the-fly graph generation. A generic and scalable database storage solution for the collection of various system objects has been implemented for real world modeling and ease of implementation with the chosen ORM. These objects include a collection of states, establishments, evaluation sites, data loggers, sensors, and readings.
Data collection requirements were refined and narrowed into three distinct channels of data. The first channel of data to be collected by the system included historical data, which must
be imported from vast flat file archives into a universal database structure for the system.
The second collection data source identified was aggregated internet data which could arrive from multiple pre-existing sources. These sources include the consumption of both proprietary data sources and retrieval methods as wells as commercially available weather APIs and/or the use of previously collected data from other University research data centers. For example, one of the major sources of data collection, especially for historic site data and ongoing data collection was Plymouth State University of New Hampshire. Plymouth State University has data for many years and continued collection of data from weather stations and subsurface sensors stored in simple CSV files and made them available through a simple HTTP file web listing.
The primary targeted data source for the collection of data supported by the system includes CRS&SI collection of data through satellite transmissions, which has been setup through third party providers in order to receive the data via the web. This transmitted data eventually ends up as a CSV from additional third party vendors, which is ultimately consumed and parsed for input to the system. Unfortunately, the arrangement of data in all CSV’s are proprietary to the source and specific fields may be added or omitted per vendor device, which adds complexity to the system.
5.
HARDWARE
Hardware used for end point data collection for input into the system include various multi-purposed sensors integrated into data logger hardware equipped with data transmission software packages. The CRS&SI technologies were compiled by a team of researchers at the University of Massachusetts Dartmouth, project consultants, as well as the vendor services. These devices were installed at three locations in New England, carefully identified and selected by DOT researchers. One was in New Hampshire (Warren Flats) and the other two were in Maine (Mariaville and Madison). Sensors that were integrated with the data loggers and transmitters include temperature, moisture, depths, wind, and rain sensors. Sensors deployed and in use include both atmospheric sensors as well as subsurface sensors. The data transmission devices were configured to transmit data to a server of the satellite service provider (via Iridium) and/or cloud service provider (DataGarrison) where data is made available at a subscribed interval from a hosted online server. The next step for the system is to maintain and store the available records in the local storage solution for processing (UMass Dartmouth Data Center). Further hardware was needed to address these concerns. To address these concerns, a series of servers for housing data and the development process were setup. Multiple web and database servers for production and testing of development and for data collection, maintenance, integration, and testing were established.
6.
INTEGRATION
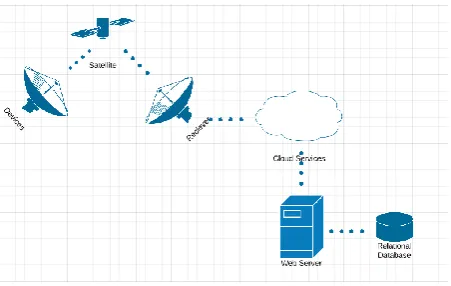
Fig 1: From left to right, devices interact with iridium satellites to transmit data to satellite receivers such that
that are consumed and hosted by cloud services and vendor services. Scripts hosted on the webserver interact
with cloud services to populate the relational database.
It is important to note that since third party vendor services are in use that the collection of satellite and data logging services typically operate in a configured fashion. Due to a combination of limited storage, battery life, and transmissions costs and rates, each data logger stores a finite number of readings locally and uses satellite communication to push data from the devices to a temporary storage solution with a third party provider, Data Garrison. This basic functionality is already available upon purchase of equipment from the provider with configuration. The frequency of data availability differs between providers and between configurations. This can add slight complexity to the domain on which the system operates.
Since the data initially collected by third parties is temporary and the desired data should be stored permanently on production servers, this called for the creation of auto-population scripts. These scripts will aid in the transfer and storage of data from vendor servers to production database server. The collection scripts operate independently to populate the database with the latest available data from each site every hour. Also, other custom scripts are run against the database’s latest values nightly such that they can execute the prediction calculations of the frost-thaw index.
Fig 2: SLRI and Prediction scripts run by pulling data from the database, processing the data and placing it back
into the database, while data collection and auto population scripts add and update database records for
sensed data.
Generated calculated values are stored by the system in order to perform future predictions. With these calculated values, plotting queries can be run against the stored data to output up to date visual representations of frost-thaw graphs. Graphical representations are then made available through a web application for end users to use for decision support, interpretations, and recommendations when imposing
seasonal load restrictions.
7.
DATABASE DESIGN
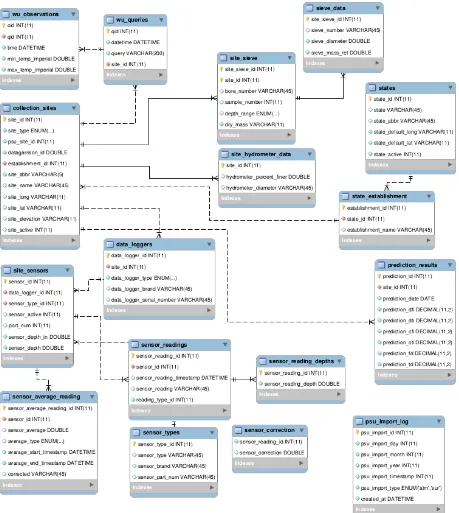
Since the database houses significant records of data relating to different objects within the system, the database was designed in such a fashion that it is both modular and scalable for future expansions. The ability to support storage for past, present, and future collected data collected using various formats initially were harvested and stored in the database which was created to reflect the domain on which the system operates. Tables were designed after domain objects some of these objects include states, establishments, sites, data loggers, sensors, sensor types, ports, readings, and reading types must all be accounted for when collecting and storing data in the database. MySQL was chosen as the database software to be used for storing the collected data records. The database was designed using MySQL Workbench and maintained using PHPMyAdmin. Database tables were all related by unique index identifiers, and database integrity was maintained by employing the use of foreign key relations across all database tables and records. Since the use of ORM software was previously anticipated, fields for tables within the database closely resemble the attributes of system objects used so that ORM mapping is direct and unambiguous.
[image:4.595.53.281.539.699.2]Fig 3: Many tables in the database represent entities (objects), as shown in this partial view of the preliminary ER diagram. Some entities include states, establishments, sites, data loggers, sensors, sensor readings, and sensor types while other tables
8.
DATA COLLECTION SCRIPTS
Scripts are executed on the server side where they operate in order to collect data to be stored in the database. Historic data and remote collection data scripts are two examples of scripts which are run on a nightly and hourly basis performing the collection of data for import into the DSS’s database structure. The collection of data using these types of scripts is important to feed other system scripts that are used for extracting the collected data from the database and processing the data for storage in related tables.
One of the downsides to data collection in the current state is that the data is distributed and stored at the various locations, different vendors, and made available through different means of retrieval. Ultimately this means that there are multiple separate formats in which some of the same types of data are stored. An example of this would be data which we collect from a vendor (DataGarrison) who supplies us with information through a CSV file versus another vendor (Onset) who supplies us access through a web API, or even a CSV with a different column layout. Due to this complexity issue and the inability to customize vendor’s delivery means, multiple scripts had to be written for each data collection source to input the data into the system in a uniform fashion.
Aside from data collection scripts, other scripts required to meet user requirements include auto population scripts will harvest the data from the provided satellite service and preexisting services, and to collect and store in the appropriate fitting database tables. Auto-population and auto execution of data collection has been set to occur at a set interval via a CRON job on production server based on the rate of availability of data from various source types and remote providers.
Two other very important scripts which are crucial for the operation of the DSS include the SLRI script and the prediction script. The SLRI script looks at collected values, verifies they are within an acceptable range, accounting for outliers, and interpolates the collected data after applying adjustments to the data.
The predictive model script is a proprietary algorithm developed by Dr. Heather Miller at the Civil Engineering department at UMass Dartmouth which generates a series of predicted variables as well as predictions of frost-thaw plot, which can be validated by the actual sensed frost-thaw plot generated by the sensed data. Programming languages may vary per script, some of the languages used on the current collection scripts include Perl, Python, PHP, and BASH shell scripting languages.
Many scripts perform sequences of data parsing from downloaded flat files, or interacting with web APIs to gather values. Scripts execute hundreds or even thousands of SQL SELECT, INSERT, and UPDATE queries which are used to select data existing in the database for update or to INSERT non-existent data into the database. Many scripts connect to remote servers via HTTP protocol and use CURL, or WGET requests to receive, CSV, XML or JSON notation responses from interactions with remote web services prior to parsing the data and storing the data.
9.
WEB APPLICATION
A web application was developed using MVC architecture via the Code Igniter PHP framework and hosted in the University of Massachusetts Dartmouth Data Center. Users are able to securely register and view data and information associated with collection sites. An ORM php.activerecord was used for processing data requests that can be made using a custom data reporting tool for slicing data, querying and graphing/charting collected data using Google Charts technology.
The use of the MVC pattern facilitates quick implementation, ease of maintenance for future work, an easy extendibility of custom system components.
10.
COMPARABLE RESEARCH
Comparable cited research materials in regards to similar decision support systems, the life-cycle of DSS development, implementation choices, and flexibility options were crucial in the research that drove creation of the implemented system. Including management techniques in creating DSS and BI systems outlined and suggested in publications by Larisa Terpeluk [19] . Including strict adherence several PM/PI techniques relating to project life cycle, involvement of stake holders, and coordination of teams could be observed during the planning and development of the decision support system.
Since the implemented DSS exists in the public sector, similar research and DSS implementations have been reviewed regarding financial domain [15]. While the domain of research may be different as well as the implementation language chosen in this particular piece of research is different, conceptually the DSS implementation and goals run parallel. Just as the feasibility of DSS assisting in the decision process has been established for various other manual processes, this implementation has established the feasibility of a DSS being useful in SLR imposition and prediction.
The decisions regarding hardware, software, script implementation, database design, and object relational modeling approach for the DSS was a result of the analysis of the outlined in the publication by David C. Farwell regarding model based decision support systems [17] and available talent, and technologies. Flexibility, modularity, and a scalable nature in the decision support systems is a requirement for future expansion regarding the described implementation.
Other research studied that aims at performance improvements for integration using model based approaches, and Object Oriented Modeling plays a strong guide in the implementation of the described system [16,17] and can lend more use for future projects with regards to enhancements and modular additions.
11.
FUTURE WORK
With multiple hardware additions, software additions can be added as well through software extensions, script additions, and database additions. Since the initial design of the database was modeled to be modular and scalable in fashion, additional data related to various components interacting in the system can be introduced to the system to aide in future work.
One of the key future pieces of work we are exploring include the creation of a standard input schema of some type which can stand as an interface between various proprietary temporary data stores, and the DSS database backend.
Other future work may include having the system expanded to accept multiple prediction models and compare them against each other, or the addition of other state departments and use by multiple state DOTs, which would mean more collection sites, and certainly more scripts, driving the need for the mentioned standardized interface.
12.
ACKNOWLEDGEMENTS
Much appreciation should be attributed to all individuals who have dedicated many hours to the research of the domain in which the Decision Support System operates. Much of their research has been cited and has been used as a driving force in meeting requirements for the system. There would not have been a proposal or need to drive the development of this system had it not been for these individuals including Dale Peabody, Richard Berg, Robert Eaton, Frost Associates, researchers at Plymouth State University, Forest Service researchers, Maureen Kestler, and individuals in Minnesota whom have dedicated much time to the research of SLR and frost-thaw implications on roadways and travel along the side of individuals from the University of Massachusetts Dartmouth’s civil engineering department professor Dr. Heather Miller and graduate student Christopher Cabral.
Much technological help was given for support of the project and sourcing implementation requirements along the way. This has saved great time in the development process. Recognition should be given to the administrators of the production server hosted at University of Massachusetts Dartmouth including Holger Dippel, Michael Pacheco, Rich Pacheco as well as the administrator of development server and version control server administrator Paul Naylor.
Much acknowledgement should be given to research students who have worked greatly on the implementation and integration of hardware components and of several scripts employed in the use of the system including Zhaoyang Zhang, Navid Tadayon, Arron Larocque, and Mark Ide.
13.
REFERENCES
[1] Minnesota Dept. of Transportation, Policy, Safety & Strategic Initiatives Division Technical Memorandum No
09-09- MAT-02,
dotapp7.dot.state.mn.us/edms/download?docId=740964 (accessed March 2010), 2009.
[2] Ovik, J.M., J.A. Siekmeier, and D.A. Van Deusen, Improved Spring Load Restriction Guidelines Using Mechanistic Analysis, Technical Report, Minnesota Department of Transportation, 2000.
[3] Embacher, R., "Duration of Spring Thaw Recovery for Aggregate-Surfaced Roads," Transportation Research Record: Journal of the Transportation Research Board No 1967, pp. 27-35, Transportation Research Board of the National Academies, Washington D.C., 2006.
[4] Hanek, G., M. Truebe, and M.A. Kestler, Using Time Domain Reflectometry (TDR) and Radio Frequency (RF) Devices to Monitor Seasonal Moisture Variation in Forest Road Subgrade and Base Materials, U.S. Department of Agriculture, Forest Service, San Dimas Technology and Development Center, San Dimas, CA, 2001.
[5] Marquis, B., Mechanistic Approach to Determine Spring Load Restrictions in Maine, Technical Report No. 08-1, Maine Department of Transportation, Bangor, Maine, 2008.
[6] Eaton, R.A., M.A. Kestler, and A. Hall, Spring Thaw Predictor & Development of Real Time Spring Load Restrictions, First Two-Year Data Report, SP&R Research Project No. 14282K, New Hampshire Department of Transportation, Concord, NH, 2009.
[7] Eaton, R.A. and M.A. Kestler, Spring Thaw Predictor & Development of Real Time Spring Load Restrictions, Third Year Data Report, SP&R Research Project No. 14282K, New Hampshire Department of Transportation, Concord, NH, 2009.
[8] Eaton, R.A., M.A. Kestler, and A. Hall, Spring Thaw Prediction & Development of Real Time Spring Load Restrictions, Report currently in draft, April 2010.
[9] Eaton, R.A., A. Hanscom, M.A. Kestler, A. Hall, H.J. Miller, and R.L. Berg, "Spring Thaw Predictor and Development of Real Time Spring Load Restrictions," Proceedings of the American Society of Civil Engineers 14th International Conference on Cold Regions Engineering, Duluth, MN, August 30-September 2, 2009.
[10] Eaton, R.A., R.L. Berg, A. Hall, H.J. Miller, and M.A. Kestler, "Initial Analysis of the New Hampshire Spring Load Restriction Procedure," Proceedings of the American Society of Civil Engineers 14th International Conference on Cold Regions Engineering, Duluth, MN, August 30-September 2, 2009.
[11] Miller, H.J., M. Amatrudo, R.A. Eaton, A. Hall, and M.A. Kestler, "Field Evaluation of Reconstructed Roadways Incorporating Full Depth Reclamation," Paper No. 10-1791, Proceedings of the Transportation Research Board 89th Annual Meeting, Washington D.C., January 10-14, 2010.
[12] Kestler, M.A., Richard L. Berg, Bryan C. Steinert, Gordon Hanek, Mark Truebe, and Dana N. Humphrey, Determining When to Place and Remove Spring Load Restrictions on Low Volume Roads: Three Low-Cost Techniques. Low Volume Roads Conference, Austin, TX, Transportation Research Record 1989, pp 219-229, WA, DC. June 2007.
[13] Mahoney, J., R. Rutherford, and G. Hicks, Guidelines for Spring Highway Use Restrictions, Report No. WA-RD- 80.2, Washington State Department of Transportation, Olympia, WA, 1986.
[14] a z, S., S.L. Tighe, C.T. Haas, B. Mills, and M. Perchanok, “Development and Calibration of Frost and Thaw Depth Predictors for Use in Variable Load Restrictions Decision-Making on Flexible Low-Volume Roads”, Paper #08- 1083, Transportation Research Board 87th Annual Meeting, 2008.
sector administration: A case study in the treasury department, ministry of finance, Malaysia. Information Technology for Development 3:2, 111-133
[16] Adela Bara, Vlad Diaconita, Ion Lungu, and Manole Velicanu. 2009. Improving performance in integrated DSS with object oriented modeling. W. Trans. on Comp. 8, 4 (April 2009), 599-609.
[17] David C. Farwell, A Model Based Approach to Decision Support System Flexibility, Interfaces 1982 12:5, 79-86
[18] George M. Kasper, A Theory of Decision Support System Design for User Calibration, Information Systems Research 1996 7:2, 215-232
[19] Larissa Terpeluk Moss , Shaku Atre, Business Intelligence Roadmap: The Complete Project Lifecycle for Decision-Support Applications, Addison-Wesley Longman Publishing Co., Inc., Boston, MA, 2003
[20] Lungu I., Velicanu M., Bâra A., Diaconita V., Botha I. - Practices for designing and improving data extraction in a virtual data warehouses project, Proceedings of ICCCC 2008, International conference on computers, communications and control, Baile Felix, Oradea, Romania, 15-17 May 2008, pag 369-375, published in International Journal of Computers, Communications and Control, vol 3, 2008, ISSN 1841-9836.
[21] Miller, H. J., Cabral, C., Kestler, M. A., Berg, R. L. and Eaton, R. A., Comparative Analyses of Methods for Posting Spring Load Restrictions. Proceedings of the 10th International Symposium on Cold Regions Development, Anchorage, Alaska June 2-5, 2013.
[22] O’Connor, S., alasubramanian R., Zarrillo M., Miller H., Wang H., Modeling and Decision Support System to
Determine When to Impose Seasonal Load Restrictions (SLR). Proceedings of the International Workshop on Applied Modeling and Simulation, Rome, Italy, September 24-27, 2012.
[23] Miller, H. J., Cabral, C., Kestler, M. A., Berg, R. L. and Eaton, R. A., Calibration of a Freeze-Thaw Prediction Model for Spring Load Restriction Timing in Northern New England. Proceedings of the 15’th International Conference on Cold Regions Engineering, Quebec, Canada, August 19-22, 2012.
[24] Zarrillo M., Miller H., Balasubramanian R., Wang H., Berg, R., Eaton, R. and Kestler, M. Preliminary Development of a Real Time Seasonal Load Restriction System for Remote Sites. Proceedings of the 15’th International Conference on Cold Regions Engineering, Quebec, Canada, August 19-22, 2012.
[25] Utpatadevi, Ni LP Pravina, AAK Oka Sudana, and AA Kt Agung Cahyawan. "Implementation of MVC (Model-View-Controller) Architectural to Academic Management Information System with Android Platform Base." International Journal 57.
[26] A. Leff, J. T. Rayfield, Web-application development using the Model/View/Controller design pattern Enterprise Distributed Object Computing Conference, 2001. EDOC '01. Proceedings. Fifth IEEE International In Enterprise Distributed Object Computing Conference, 2001. EDOC '01. Proceedings. Fifth IEEE International (2001), pp. 118-127, doi:10.1109/edoc.2001.950428