An Effective Method for Multi-biometric Fusion using
Simulated Annealing
Minakshi Gogoi
Research ScholarDept. of Computer Science and Engineering Tezpur University
Dhruba Kr. Bhattacharyya
ProfessorDept. of Computer Science and Engineering Tezpur University
ABSTRACT
An appropriate combination of multiple biometric sensors in-creases the reliability of verification through biometrics. In this pa-per we propose an effective method of fusion of biometrics based on a dynamic selection of threshold point of fingerprint and iris biometrics towards identifier of an optimal set of rules for fu-sion. The effectiveness of the method has been established us-ing several benchmark databases usus-ing Simulated Annealus-ing ap-proach.The selection of a proper set of parameters for SA is a multi-objective decision making optimization problem. Initially the matching scores for individual biometric classifiers are computed. Next, a SA-based procedure is followed to simultaneously optimize the parameters and the fusion rules for fingerprint and iris biomet-rics. An experimental verification of the convergence nature of the simulated annealing method with the worst case behavior for op-timum rule selection is analyzed and a comparative result of the method with the Ant colony optimization technique is also given.
General Terms:
Multi-biometrics
Keywords:
GFAR, GFRR, CFA, Simulated Annealing, Convergence
1. INTRODUCTION
The single or unimodal biometric authentication system is affected by problems like noisy sensor data, intra-class variations, non-universality and distinctiveness [4]. Fusion of biometrics can al-leviate those problems of unimodal biometric system. In case of biometric system, fusion of evidences obtained from multi-ple biometric is a critical part. The key to successful multibiomet-ric system is an effective fusion scheme and may be consolidated at several levels like feature level fusion, matching score level fusion, rank level fusion and decision level fusion. Among all of the above fusion approaches as extensively studied in the literature [9], the decision level fusion is a relatively new understudied problem hav-ing a high potential for efficient consolidation of multiple unimodal biometric systems. The decision level fusion involves the selection of an optimal fusion rules and the selection of individual biomet-ric sensor point for their matching scores dynamically. Some of the classical approaches that employ an optimal fusion are:
determin-istic methods, probabildetermin-istic method and evolutionary computation methods like Ant Colony Optimization (ACO)[1], Swarm Intelli-gence (SI), Bacteria Foraging, Genetic Algorithm (GA) [11] etc.
1.1 Motivation
In the recent years the evolutionary computation find applications in many real life problems due to their specific advantages like the flexibility of the procedures, as well as the ability to self-adapt the search for optimum solutions on the fly. But all these methods are not free from limitations. Though in our experiments, it has been observed that ACO based distributed approach is effective in find-ing good solutions over several real life applications [9], however, sometimes it may not converge as it updates the pheromone based on its current best possible path [13]. In genetic algorithm an im-proper fitness function also may lead to convergence towards local optima [14]. Further operation on dynamic sets often leads to com-plex scenario, which is a major issue on the scalable datasets of multi-modal biometrics. Hence there is a need to explore simulated annealing(SA) approach for fusion of multi-modal biometrics as it has many advantages while comparing with its other counterpart. Simulated annealing is an annealing process in metallurgy which reduce defects by controlling cooling of materials. SA statistically guarantees to find an optimal solution and it has its ability and flex-ibility to approach global optimality [5].
In this paper, we propose an effective method for decision level fusion of biometrics using simulate annealing. Based on our exper-imental study [10] [9] it has been observed that Iris and Fingerprint biometrics shows better result in terms of accuracy, reliability and similarity, in comparison to other traits. The features of each in-dividual trait such as iris and fingerprint are extracted from their preprocessed images and then compared with the stored template to obtain the matching scores. We investigate the adaptive combi-nation of iris and fingerprint biometric on publicly available bench-mark datasets and the results have been found satisfactory.
2. BACKGROUND AND RELATED RESEARCH
Multibiometric systems have a number of benefits, such as, robust-ness against individual sensor, handling one or more noisy traits etc. Due to these inherent benefits, the increase in accuracy of ver-ification is the main focus of the majority of research in this area.
2.1 SA Basics
Simulated Annealing is a mathematical analogy to a cooling system which can be used to sample highly nonlinear multidimensional functions. In the early 1980s, the method of simulated annealing (SA) was introduced by Kirkpatrick and coworkers (1983), based on the ideas formulated in the early 1950s (Metropolis, 1953). This method simulates the annealing process in which a substance is heated above its melting temperature and then gradually cooled to produce the crystalline lattice which minimizes its energy prob-ability distribution. This crystalline lattice, composed of millions of atoms perfectly aligned, is a beautiful example of nature find-ing an optimal structure. However, quickly coolfind-ing or quenchfind-ing the liquid retards the crystal formation, and the substance becomes an amorphous mass with a higher than optimum energy state. The key to crystal formation is carefully controlling the rate of change of temperature. The algorithmic analog to this process be-gins with a random guess of the cost function variable values. Heat-ing means randomly modifyHeat-ing the variable values. Higher heat implies greater random fluctuations. The cost function returns the output,f, associated with a set of variables. If the output decreases, then the new variable set replaces the old variable set. If the output increases, then the output is accepted with probability that
P =exp(fold−fnew)/T > r
(1)
whereris a uniform random number andT is a variable analogous to temperature. Otherwise, the new variable set is rejected. Thus, even if a variable set leads to a worse cost, it can be accepted with a certain probability. The new variable set is found by taking a ran-dom step from the old variable.
The objective is to perform decision level fusion of iris and finger-print, at matching score level architecture using Simulated Anneal-ing optimization problem. The features of individual iris and fin-gerprint traits are extracted from their preprocessed images. These features of a query image are compared with those of stored tem-plate to obtain matching scores. The individual scores generated after matching are passed to the fusion module where optimal fu-sion rules and decifu-sion thresholds are chosen automatically using Simulated Annealing(SA) Technique. As the decisions made by the biometric sensors are binary based on their presence or absence, they need to be fused by some binary fusion rule. One of the tasks of decision level fusion is to select an optimal fusion rule that min-imizes the total errors of the system. The flow diagram of SA is shown in Figure
The parameters in SA areT (temperature) andS(energy function S) .
[image:2.595.326.530.68.354.2]The Pseudo code of the general SA is given below
Fig. 1. Flow diagram of Simulate Annealing
Algorithm 1Simulated Annealing algorithm
1: Select starting temperature and initial parameter values
2: Randomly select a new point in the neighborhood of the origi-nal
3: Compare the two points using the Metropolis criterion.
4: Repeat steps 2 and 3 until system reaches equilibrium state ie to repeat the proessNtimes for largeN
5: Decrease temperature and repeat the above steps, stop when system reaches frozen state.
2.2 Approaches of SA
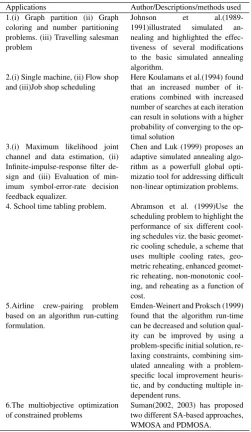
SA was started as a method or tool for solving single objective com-binatorial problems, these days it has been applied to solve single as well as multiple objective optimization problems in various fields. The problems may have continuous or discrete variables. SA has been greatly used in operational research problems. Application of SA does not restrict to optimization of nonlinear objective func-tion, these days it has been applied for many other purposes. Bell et al (1987) have used it to cluster tuples in databases. They have at-tempted to use SA in circuit board layout design and it suggests that it would be advantageously applied to clustering tuples in database in order to enhance responsiveness to queries. Some of the methods that SA find applications are listed below in Table 1.
2.3 Background of Iris and Fingerprint
Table 1.
Applications of Simulated Annealing
Applications Author/Descriptions/methods used 1.(i) Graph partition (ii) Graph
coloring and number partitioning problems. (iii) Travelling salesman problem
Johnson et al.(1989-1991)illustrated simulated an-nealing and highlighted the effec-tiveness of several modifications to the basic simulated annealing algorithm.
2.(i) Single machine, (ii) Flow shop and (iii)Job shop scheduling
Here Koulamans et al.(1994) found that an increased number of it-erations combined with increased number of searches at each iteration can result in solutions with a higher probability of converging to the op-timal solution
3.(i) Maximum likelihood joint channel and data estimation, (ii) Infinite-impulse-response filter de-sign and (iii) Evaluation of min-imum symbol-error-rate decision feedback equalizer.
Chen and Luk (1999) proposes an adaptive simulated annealing algo-rithm as a powerfull global opti-mizatio tool for addressing difficult non-linear optimization problems.
4. School time tabling problem. Abramson et al. (1999)Use the scheduling problem to highlight the performance of six different cool-ing schedules viz. the basic geomet-ric cooling schedule, a scheme that uses multiple cooling rates, geo-metric reheating, enhanced geomet-ric reheating, non-monotonic cool-ing, and reheating as a function of cost.
5.Airline crew-pairing problem based on an algorithm run-cutting formulation.
Emden-Weinert and Proksch (1999) found that the algorithm run-time can be decreased and solution qual-ity can be improved by using a problem-specific initial solution, re-laxing constraints, combining sim-ulated annealing with a problem-specific local improvement heuris-tic, and by conducting multiple in-dependent runs.
6.The multiobjective optimization of constrained problems
Suman(2002, 2003) has proposed two different SA-based approaches, WMOSA and PDMOSA.
extracted iris region is then normalised into a rectangular block with constant dimensions. Finally encoding is done by extracting the phase data from 1D Log-gabor filters and quantised to give the unique pattern of the iris into a bit-wise biometric template. The iris code comparison or matching is done to check if the two irises belong to the same person using Hamming Distance (HD) which is a fractional measure of the number of bits disagreeing between two binary patterns.
Fingerprint matching is done at two levels. At coarse level, finger-prints are classified into whorl, arch, tented arch, left loop, right loop and twin loop. Coarse level classification is good only for faster detection of the class type of a given input fingerprint. At finer level, matching is performed on the basis of the minutiae (i.e. ridge ending and branching points) information. Our fingerprint classification method based on minutiae score, computed using a minutiae matching technique by obtaining the scores of different
polar co-ordinates of the extracted minutiae with respect to refer-ence minutiae and by adjusting against some threshold value as in [8]. A minutiae score-based approach is used to analyze the pro-cess of fingerprint comparison for finer level matching and use it to produce a lower bound on the number of detectably distinct fin-gerprints. With the extracted minutiae features, a score is obtained between each pair of template and input minutiae based on their highest number of match minutiae pairs as reported in [7].
2.4 Need of multibiometric fusion
The unimodal biometric system may fail when the biometric data available is noisy or due to unavailability of biometric template. Multibiometric is a new sub-discipline within the domain of bio-metrics to establish identity. The problem of biometric verification is a great challenge in terms of expectations of high matching ac-curacy, efficient scalability and ease of usability in a variety of applications. Rose and Jain identify some of the challenges of an unimodal system that leads the motivations for multibiometric sys-tems [1] are: (i)Noise- Due to temporary inferences in the biometric trait thereby increasing the False Reject Rate (FRR) of the system, (ii)Intra-Class variations occur due to incorrect interaction of users with the sensor of unimodal system, (iii) Inter-Class similarities may occur in systems used by a large number of users, where there might be more mismatch of features by multiple users of different identity, (iv) Non-Universality problem arises when not all users in the population able to produce the same type of features, (v) Spoof or reply attack may occur due to an imposters attempt to mimic the traits like signature and voice which are behavioral in nature and physical traits like fingerprint by inscribing ridge-like struc-tures [2]. A multibiometric system can be accomplished by fusion of multiple traits of an individual, or multiple feature extraction, or matching algorithms operating on the same biometric and multi-modal fusion of different biometric traits.
3. PROPOSED METHOD
In our work, biometric thresholds are continuous. Here, a fusion rule takes an integer value which suffers slow convergence hence the need for binary Simulated Annealing algorithm, where FAR of each biometric is evolved instead of thresholds. The fusion rule is a binary number having a length of log2p bits, where p=22
N
, with a real value varying from 0≤f≤p−1. For binary search spaces, the binary decision model as described in [15]is being used. A binary decision model works better for moving through the decision fusion space.
This paper presents an effective framework for the adaptive combi-nation of multimodal fingerprint and iris biometric data. The pro-posed method is depicted in Figure 2. As shown in the figure, the method accepts the match scores from the individual sensors and uses a combination functionfto combine the scores, hence to de-cide the genuiness of an input instance.
The multimodal biometric data from fingerprint and Iris biometric are used to extract the correspondingFF andFI feature vectors. These feature vectors are employed to generate the matching scores
SF andSI from the corresponding templates acquired during the registration. The risk of attack on a biometric system can be vary-ing and therefore it is critical to provide multiple levels of security. The security requirement in Bayesian sense, is quantified with two parameters; the global cost (0, 1) of falsely accepting an imposter
perfor-Fig. 2. Block diagram of the proposed system using binary simulated an-nealing (BSA)
mance. The Bayesian costEto be minimized by the multimodal biometrics system is the weighted sum ofFARandFRR, which is given by
E=CF AFAR(η) +CF RFRR(η) where CF A+CF R= 2 (2) whereFAR(η) is the global or the combined false acceptance rate andFRR(η) is the combined false rejection rate at decision thresh-oldηfrom the multimodal biometric system. The task of multi-modal biometric system as shown in Figure 2 is to minimize the (global) costE, given by equation 2, by selecting (i) the appro-priate score level combination rule, (ii) its parameters and (iii) the decision threshold. The multidimensional search among the vari-ous combination rules and their weight parameters to optimize the global costEis achieved by the binary simulated annealing (BSA) optimization approach.
We discuss the basic steps of the proposed method as depicted in Figure 2.
3.1 Multibiometric database
A virtual multimodal database derived from the CASIA iris database [1] and FVC fingerprint database [2] is used to evalu-ate the performance of the said method. The multimodal database consists of 108 users obtained by randomly pairing the first 108 users in the FVC database with the users in the CASIA database .
3.2 Feature extraction on iris data
The most discriminating feature of iris pattern is the phase infor-mation. We extract the phase information by using 1D Log Gabor wavelets according to Daugman (2004) [6]. In this step, a 2D nor-malized pattern is broken into a number of 1D signals, and these signals are convolved with 1D Gabor wavelets. Each row of the 2D normalised pattern corresponds to a circular ring on the iris region. The angular direction corresponds to columns of the normalized pattern.
3.3 Feature extraction on fingerprint data
In this step, we extract two salient features, i.e.coreand reference points. Core point extraction is considered as one of the fundamen-tal step before classification since a reference center is required in order to correctly compare two fingerprints. An algorithm devel-oped by Hong et al.(1998) [12] is used to detect the core point but with a slight difference that maps all the block directions to the interval from -0.5 to 0.5 and then simply regards the value 0.5 corresponds to the core.
3.4 Matching
We use different matching approaches for each sensor output, which are discussed next.
(1) Iris: We match a pair of Iris image templates (derived based on its discriminating feature) bit-wise using the hamming dis-tance. Two templates are considered to have been generated from the same iris image if the Hamming distance is lower than a user defined threshold.
(2) Fingerprint: We match two fingerprint feature representations at two levels. At coarse level, fingerprints are classified into whorl, arch, tented arch, left loop, right loop and twin loop. At a finer level, it is compared to the subset of the database containing that type of fingerprints only. Here, we have used our SOM-MSOM technique [7] for coarse level classification. At finer level, matching is performed based on the minutiae (i.e., ridge ending and branching points) information.
3.5 Combination function,f
This function accepts match scores, i.e., SI and SF respectively , from iris and fingerprint module and computesf(Si
F,S i
I) using the rules and parameter provided by BSA submodule as depicted in Figure 2.
3.6 Decision box
This module takes the input from combination function,fand BSA to decide the class of a given input instance Xieither as genuine or imposter. It uses the decision threshold given by the BSA submod-ule to decide the class of Xi
4. PERFORMANCE EVALUATION
In this section we report performance evaluation of our method in light ofthreewell-known benchmark andonesynthetic dataset. The experiments were carried out on a workstation with Intel dual-core processor (1.86 GHz) with 1 GB of RAM. We used MATLAB 7.2 (R2006a) version in windows (64-bits) platform for the perfor-mance evaluation.
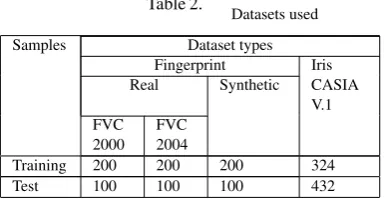
4.1 Datasets used
[image:4.595.62.284.70.188.2]We have usedfourdatasets out of whichtwobenchmark, andone synthetic dataset for fingerprint trait andonebenchmark dataset for iris trait. The detail about the datasets are given in Table 2. The fingerprint FVC2000 and FVC2004 are available in [2]. The syn-thetic dataset was created using tools [3], where each image size is of 300×300pixels. The iris dataset ia available in [1]. For the verification experiments, the datasets are divided into two parts training and test sets. The results are generated using K-folded er-rors validation method
Table 2.
Datasets used
Samples Dataset types Fingerprint Iris Real Synthetic CASIA
V.1 FVC
2000 FVC 2004
[image:4.595.341.534.587.686.2]4.2 Performance analysis
From the result of our experiment we have obtained different ROC curves for each biometric trait as shown in Figure 3 & 4.
[image:5.595.360.511.72.202.2]4.2.1 Iris biometric. For iris dataset, i.e. CASIA V.1, we obtain the matching scores for different iris images, the corresponding er-ror rates are generated using differnt threshold values. The ROC curve obtained is shown in Figure 3. The FAR and FRR values are reported in Table 3. It can be seen from the table as well as from the figure that result is satisfactory.
Table 3.
FAR/FRR values of CASIA V.1 dataset
Threshold FAR FRR 0.3200 0.0007 44.5988 0.3400 0.0007 33.5648 0.3600 0.0021 23.6883 0.3800 0.0100 16.8210 0.4000 0.0436 12.1142 0.4200 0.3358 8.7191
[image:5.595.115.232.201.276.2]The ROC curve for the CASIA V.1 Iris dataset is depicted in Figure 3.
Fig. 3. ROC curve of Iris biometric (CASIA) dataset.
4.2.2 Fingerprint biometric:. For fingerprint biometric we ob-tain three sets of results for FVC2000, FVC2004 and synthetic datasets. The average results are obtained as Table 4. The corre-sponding ROC curve for FVC dataset is shown in Figure 4. Like CASIA dataset, we obtain satisfactory prformance for FVC dataset as shown in Figure 4.
Table 4.
FAR/FRR valus on FVC dataset.
[image:5.595.334.492.234.362.2]Threshold FAR FRR 0.6500 3.6667 1.6667 0.6750 2.3333 2.3333 0.7000 1.6667 3.6667 0.7250 1.0000 6.6667 0.7500 0.6667 7.6667 0.7750 0.3333 9.6667
Fig. 4. ROC curve of fingerprint (FVC) dataset.
[image:5.595.95.251.326.462.2]Fig. 5. GFAR vs. GFRR curve for AND and OR rule of Iris and Fingerprint dataset. (Sources from [9])
Table 5.
Selection of rules against differentCF Aat
different threshold points, where ’I’, ’F’, ’A’ and ’O’ stands for Iris, Fingerprint, And rule and Or rule respectively.
CF A The Rule chosen by SA at different threshold Point1 Point2 Point3 Point4 I F A O I F A O I F A O I F A O
1.6 √ √ √ √
1.62 √ √ √ √
1.64 √ √ √ √
1.66 √ √ √ √
1.68 √ √ √ √
1.70 √ √ √ √
1.72 √ √ √ √
1.74 √ √ √ √
1.76 √ √ √ √
1.80 √ √ √ √
1.82 √ √ √ √
1.84 √ √ √ √
1.86 √ √ √ √
1.88 √ √ √ √
1.9 √ √ √ √
1.92 √ √ √ √
1.94 √ √ √ √
1.96 √ √ √ √
[image:5.595.317.551.440.673.2]4.2.3 Multimodal biometric fusion . In this work we provide the solutions for fusion of iris and fingerprint for the range of costs
1.6−2.0. We run the BSA 100 times for the same cost for each temperature ranging from high to low. In Table 5, we summarize the results showing a range of costs and the probable rules ie. whether I(Iris), F(Fingerprint), AND rule or OR rule is selected against dif-ferent threshold points . It seems to be obvious from table that the dynamic selection of threshold point is effective with regard to less randomness of the rules i.e. it is showing that at threshold point 4 for almost all values ofCF Athe rule selected is same. The result is that the sensor 1 (i.e., Iris) is dominant in the sensor suite of Fin-gerprint and Iris. The solutions consist of the rule and the sensor operating point defined by its false acceptance rate(FAR) and false rejection rate(FRR). From the error rates of the sensors and their distributions, the sensor threshold are computed. Due to sensor 1’s dominance, the system simply ignores the sensor 2’s (Fingerprint) decisions with higher range of costs and when the selected sensor threshold point is tight.
[image:6.595.325.535.71.271.2]4.2.4 Experimental verification of the convergence nature of SA. Simulated Annealing maintains a current assignment of values to variables randomly. If the assignment does not increase the number of conflicts, the algorithm accepts the assignment and there is a new current assignment. Otherwise, the assignment is accepted with some probability, depending on the temperature and how much worse it is than the current assignment. The current assignment is unchanged if the change is not accepted. The parameter T, temper-ature in SA is to control how many worsening steps are accepted. Table 6 shows the probability of accepting worsening steps at dif-ferent temperatures.
Table 6.
Probability of acceptence of rule at different temperatures,T
T Probability of acceptance
1.2- worse 3.5- worse 5.8- worse 6.5- worse 10 0.88 0.7 0.55 0.51 0.94 0.25 0.02 0.0017 0.0007 0.5 0.07 0.0006 0 0
0.3 0.02 0 0 0
0.25 0.0061 0 4.5562*e-011
1.7893*e-012 0.2 0.0018 0
1.3747*e-013
2.4527*e-015 0.17 0.0005
4.0362*e-010
4.1479*e-016
3.362*e-018
0.15 0.0001 1.1661*e-011
1.2515*e-018
4.6085*e-021 0.1
4.5400*e-005
3.3691*e-013
3.7761*e-021
6.3172*e-024
Our goal is to minimize the cost of the multimodal biometrics sys-tem that we have obtained using the Bayesian costEas in equa-tion (2). IfAis the current assignment of a value to each variable,
E(A)is the evaluation of assignmentAto be minimized. As sim-ulated annealing selects a neighbour at random by giving a new assignmentA0, ifE0(A) ≤E(A), it accepts the assignment and
A0becomes the new assignment. Otherwise, the assignment is only accepted randomly with probabilityexp(E(A)−E(A0))/T
.
The assignment is more likely to be accepted ifE(A0)is close to
E(A). At higher temperature, the exponent will be close to zero, and so the probability will be close 1. As the temperature ap-proaches zero, the probability apap-proaches zero and the exponent
Table 7.
Selection of rules against differentCF Aby
Simulated Annealing and Ant Colony optimization
CF A Probabilities of rule chosen by SA
Probabilities of rule chosen by ACO I F AND OR I F AND OR 1.70 0 0 100 0 0 0 0 100 1.72 0 0 100 0 0 0 0 100 1.74 0 0 100 0 0 0 0 100 1.76 0 0 100 0 0 0 0 100 1.8 0 0 100 0 0 0 0 100 1.82 0 0 100 0 0 0 0 100 1.84 0 0 100 0 0 0 0 100 1.86 0 0 100 0 0 0 0 100 1.88 0 0 0 100 94 0 0 6
1.9 0 0 0 100 95 0 0 5 1.92 0 0 0 100 100 0 0 0 1.94 0 0 0 100 100 0 0 0 1.96 0 0 0 100 100 0 0 0 1.98 0 0 0 100 100 0 0 0
approaches −∞. In the Table 6 k−worse means that E(A0)−
E(A) =k. i.e. when the temperature is 10(T=10), a change with k-worse=1.2 will be accepted with probabilitye−0.12approx 0.88,
a change that is 3.5 will be accepted with probabilitye−0.35approx
0.7. Similarly when the temperature is reduced to 0.5, i.e.T=0.5, accepting a change withk=1.2 will occur with probabilitye−1.2
ap-prox 0.07. If the temperature is 0.1, a change that is one worse will be accepted with probabilitye−10approx. In this temperature, it is
[image:6.595.57.303.389.557.2]essentially only performing steps that improve the value or leave it unchanged. With higher temperature, i.eT=10, the algorithm tends to accept steps that only worsen a small amount; it is not accept-ing a very large worsenaccept-ing steps. But as the temperature is slowly reduced the occurrences of the worsening steps are very less. With T=0.1, it is very rare that it chooses a worsening step.
Fig. 6. Snapshot of the GUI of our system
5. CONCLUSIONS AND FUTURE WORKS
[image:6.595.321.551.441.568.2]6. REFERENCES
[1] http://biometrics.idealtest.org. [2] http://bias.csr.unibo.it/fvc2004. [3] http://cubs.buffalo.edu: SFinge.
[4] A. A. Rose and A. K. Jain.Face Biometrics for Personal Iden-tification, chapter Fusion Techniques in Multibiometric Sys-tems, pages 185–212. Springer Berlin - Heidelberg, 2007. [5] M.H. Alrefaei and A. H. Diabat. A simulated annealing
tech-nique for multi-objective simulation optimization. Applied Mathematics and Computation, 215:3029–3035, 2009. [6] J. Daugman. How iris recognition works.IEEE Transactions
on Circuits and Systems for video technology.
[7] M. Gogoi and D. K. Bhattacharya. An effective fingerprint classification method using minutiae score matching. [8] M. Gogoi and D. K. Bhattacharya. Fingerprint
classifica-tion using minutiae score. In NCTMI’11 : proceeding of the National Conference on Trends in Machine Intelligence (NCTMI’11), 2011.
[9] M. Gogoi and D. K. Bhattacharya. Fusion of fingerprint and iris biometrics using binary ant colony optimization. In SocPros’13 : proceeding of the Third International Confer-ence on Soft Computing for Problem Solving (SocPros 2013), Dec 2013.
[10] M. Gogoi and D. K. Bhattacharya. Fusion of fingerprint and iris biometrics using binary particle swarm optimization. In NWNS’13 : proceeding of the National Workshop on Network Security (NWNS’13), 2013.
[11] L. R. Haupt and E.S. Haupt.
[12] L. Hong and A. Jain. Classification of fingerprint images. In IA ’99: proceeding of: 11th Scandinavian Conference on Im-age Analysis, Kangerlussuaq, Greenland, 1999, 1999. [13] K. Karu and A. K. Jain. Fingerprint classification.Pattern
Recognition.
[14] Binitha S and S Siva Sathya.