THE STUDY OF IMPACT THIRD HARMONICBY SALIENT
POLESYNCHRONOUS GENERATOR
S. S. Hajar,Raja Qhairul Shamsul Zamzuri Bin Raja Gemala Serie, H. M. Radzi, Nurul Akmal Md. Radzi, Shareen Adlina Shamsuddin,I. Shahida,N. H Haliah and Fatimah
Universiti Kuala Lumpur, Malaysian Institute of Marine Engineering Technology, Malaysia E-Mail: [email protected]
ABSTRACT
This research focuses on the study of impact third harmonic salient pole synchronous generator by using sinusoidal PWM (SPWM) technique. The methods used for this research was the analysis method of an SPWM of AC signal, analysis of a Voltage-source inverter with SPWM output and Fourier analysis of an SPWM. These methods were compared by discussing their ease of implementation, by analysing the output of the third harmonic of various output voltages and currents, and the third harmonic distortion (THD). The simulation results showed that the SPWM techniques had higher total harmonic distortion as compared to the SPWM coding technique.
Keywords: sinusoidal PWM, third harmonic distortion, matlab coding and simulink, voltage source inverter and fourier analysis.
INTRODUCTION
Harmonic in a power system existed since the discovery of the alternating current (AC) system back in the 1980s when the first alternator was first built [1],[4]. The imperfect sinusoidal voltage produced by AC generator or distorted voltage/current resulted from a non-linear load that contained various harmonic levels when analysed using Fourier series/transform.
A harmonic is a signal or wave with an integral (whole-number) multiple frequencies of some reference signal or wave in addition to the energy at a fundamental frequency [1], [2]. A signal will become a perfect sine wave when all of the energy is contained at the fundamental frequency. But, if only some of the energy is contained in the harmonics, the signal will not become a perfect sine wave because of some waveforms that contain large amounts of energy at harmonic frequencies. For example; square waves, saw tooth waves, and triangular waves. The third harmonic has caused some power quality problem in the neutrality of the distribution system [3]. The salient pole synchronous generator has been recognized as one of the third harmonic sources [5].
MATERIALS AND METHODS
The Pulse Width Modulation is a powerful technique to control analogue circuits that contain the power to be sent to a load. PWM is a way to encode analogue signal levels digitally, meanwhile, a duty cycle is defined as the ratio of (ton/T) where T is the period in seconds [2]. PWM techniques are aimed at providing a better controllable output voltage and reduction of harmonics [1]. This study, however, dealt with the comparison of third harmonic analyses performed by some of the PWM techniques using the FFT tool of Simulink in MATLAB and undertaking a few of them by inferring the best technique to be used. The main advantages of Simulink are flexible open source implementation working on .mdl and.slx Simulink models and strong mathematical base on some appealing structuring concept. The disadvantages are the tools was not initially meant and
designed for code generation and lack many desirable features of a programming language. The sinusoidal pulse-width modulation (SPWM) technique produces a sinusoidal waveform by filtering an output pulse as the waveform is of varying width [3]. A high-switching frequency leads to a better filtered sinusoidal output waveform. The desired output voltage is achieved by varying the frequency and amplitude of a reference or modulating voltage. The variations in the amplitude and frequency of the reference voltage change the pulse-width patterns of the output voltage but maintain the sinusoidal modulation. A low-frequency sinusoidal modulating signal, then, is compared with a high-frequency triangular signal called the carrier signal. The switching state changes when the sine waveform intersects the triangular waveform. The crossing positions are to determine the variable switching times between states as shown in Figure-1 below in a Matlab Simulink flow chart.
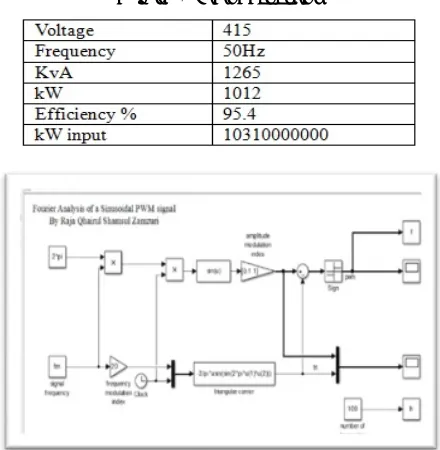
The switching signal generation model for SPWM in the simulation and coding are also shown in the figure. This research used the analysis of Sinusoidal PWM of an AC Signal, analysis of a voltage-source inverter with Sinusoidal PWM output and Fourier analysis of a Sinusoidal PWM signal. The fundamental frequency is 50Hz or 60Hz.The amplitude modulation index is 0-1. Figure 2 shows the circuit diagram of Simulink FFT tools for Fourier Analysis of SPWM. This circuit shows the connection of the parameters in order to find the total for the Third Harmonic Distortion. Table-1 shows the data from the laboratory.
[image:2.612.75.295.245.470.2]Table-1. Data of generator.
Figure-2. Simulink FFT tools fourier analysis of SPWM circuit diagram.
RESULT
The results of the three methods are analyzed and discussed in the graphs. The result analysis for SPWM of an AC signal, analysis of a voltage source inverter with SPWM output and Fourier analysis of an SPWM signal is shown in signal waveform, table, and graph.
Method 1: Analysis of SPWM of an AC signal (Coding)
Figure-3 shows the result of the command window of the SPWM evaluated coding analysis of an AC signal where it displays the beginning (alpha), the end (beta), and the width of each output pulse. It also shows the RMS value of the output voltage, the RMS value of the output voltage fundamental component, the RMS value of the load current, the RMS value of the supply current, the output voltage of Third Harmonic Distortion, the output current of Third Harmonic Distortion, the supply current of Third Harmonic Distortion and the power factor for this type of coding technique.
Figure-3. Result SPWM from coding simulation at command window.
[image:2.612.318.537.415.557.2]Figure-4 and 5 show the waveform of the output voltage, output current, supply current and harmonic order pulses of SPWM. In figure 4, the waveform shows the output voltage waveform Vin, the triangular carrier signal Vt, the modulating signal, and the output voltage waveform Vout. And, Figure5 shows the waveform pulses of an output voltage, output current, supply current and the third harmonic contents of the values.
Figure-4. Generation of the output voltage pulses SPWM.
[image:2.612.319.536.500.690.2]Table-2 shows the value of the input modulation index from 0.1 until 0.9 with a modulation index range from 0-1. The table also shows the output of the SPWM coding with the RMS value of the output Voltage, the RMS value of the output voltage fundamental component, the RMS value of the load current, the RMS value of the supply current, the output voltage of Third Harmonic Distortion, the output current of Third Harmonic Distortion, the supply current of Third Harmonic Distortion and the power factor for this type of coding technique. From the table, the average output voltage and current of Third Harmonic Distortion are shown.
Table-2. Table output of SPWM coding.
I. Method 2: Analysis of voltage source inverter with SPWM output (Coding)
Figure-6 shows the result of the command window of the evaluated coding of Voltage Source Inverter with SPWM output where it displays the beginning (alpha), the end (beta) and the width of each output pulse. It also shows the RMS value of the output Voltage, the RMS value of the output voltage fundamental component, the RMS value of the load current, the RMS value of the supply current, the average value of the supply current, the output voltage of Third Harmonic Distortion and the output current of Third Harmonic Distortion for this type of coding technique.
Figure-6. Result VSI SPWM from coding simulation at
Figure-7 and 8 show the waveform of the output voltage, output current, supply current and harmonic order pulses of SPWM. In Figure-4, the waveform shows the triangular carrier signal Vt, the modulating signal, and the output voltage waveform Vout. And, Figure-5 shows the waveform pulses of an output voltage, output current, supply current and the third harmonic contents of the values.
Figure-7. Generation of the output voltage pulses voltage source inverter.
Figure-8. Generation of the output voltage, output current, supply current and harmonic order pulses of voltage
source inverter.
Table-3. Table output of VSI SPWM coding.
II. Method 3: Fourier analysis of an SPWM signal (Simulink FFT Tools)
Figure-9 shows the output result in the command window from a running circuit diagram of Simulink FFT tools for fourier analysis of SPWM. The figure shows the function of an output voltage with the order of the third harmonic, the amplitude, the phase values, the RMS value of output voltage, and the output voltage of third harmonic distortion. The figure also shows the function of the output with the current order of the third harmonic, the amplitude, the phase values, the RMS value of output current, and the output current of third harmonic distortion.
Figure-9. Result fourier analysis from Simulink at command window.
Figure-10 and 11 shows the waveform of the output voltage, output current and harmonic order pulses of fourier analysis of SPWM. In Figure-10, the waveform shows the periodic signal of the output voltage and the third harmonic fourier components discrete signal. And, Figure-11 shows the waveform periodic signal of the output current and the third harmonic fourier components discrete signal.
Figure-10. Fourier analysis of SPWM signal waveform for THD Vo.
Figure-11. Fourier analysis of SPWM signal waveform for THD Io.
Table-4 shows the value of the input modulation index from 0.1 until 0.9 with a modulation index range from 0-1. This table also shows the output of the Fourier analysis of SPWM Simulink with the RMS value of the output voltage, the RMS value of the load current, the output voltage of third harmonic distortion and the output current of third harmonic distortion for this type of coding technique. From the table, the average of the output voltage and current of third harmonic distortion are shown.
III. Comparison of the Third Harmonic Distortion (THD) from the Three Methods
[image:5.612.319.541.151.269.2]Table-5 shows the average value of the voltage output from the analysis of spwm, analysis of voltage source inverter SPWM and Fourier analysis of SPWM. From the table, the comparisons of the output voltage third harmonic distortion from the three methods are shown. The result shows a higher value of output voltage third harmonic distortion from fourier analysis of SPWM Simulink technique.
Table-5. Table average THD of voltage output.
[image:5.612.78.292.241.328.2]Figure-12 shows the graph average third harmonic distortion of voltage output. The graph shows the fourier analysis SPWM Simulink technique with a higher percentage from all three methods.
Figure-12. Graph average THD of voltage output.
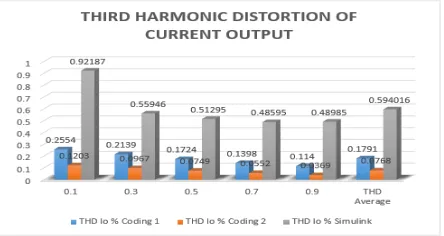
Table-6 shows the average value of the current output from the analysis of SPWM, analysis of voltage source inverter SPWM and fourier analysis of SPWM. From the table, the comparisons of the output current third harmonic distortion of the three methods are shown. The result shows a higher value of output current third harmonic distortion from fourier analysis of SPWM Simulink technique.
Table-6. Table average THD of current output.
Figure-13 shows the graph average third harmonic distortion of current output. The graph shows the fourier analysis SPWM Simulink technique with a higher percentage from all three methods.
Figure-13. Graph average THD of current output.
From the simulation Simulink and coding result, the analysis of SPWM of AC signal, analysis of a voltage-source inverter with SPWM output and fourier analysis of an SPWM signal are shown in the respective figure. The three methods of an output voltage and current waveforms are shown in the figure. THD measurement of the corresponding three methods output voltage and current are also shown in the figure with the amplitude modulation index from 0.1 until 0.9.The simulation of fourier analysis SPWM shows a higher percentage of the average THD Voltage output that is 4.66% as compared to coding SPWM and coding voltage-source inverter SPWM as shown in Figure-12. The simulation of fourier analysis SPWM shows a higher percentage of the average THD current output that is 0.594% as compared to coding SPWM and coding voltage-source inverter SPWM as shown in Figure-13. The simulation methods also show a better and accurate performance of the output and current waveform from any other methods.
CONCLUSIONS
[image:5.612.75.297.395.515.2]REFERENCES
[1] Phuong Hue Tran, MATLAB/Simulink
Implementation and Analysis of Three Pulse-Width-Modulation (PWM) Techniques, Master of Science in Electrical Engineering Boise State University, pp 80-110, 11 May 2012.
[2] Zulkifilie Bin Ibrahim, Md. Liton Hossain, Ismadi Bin Bugis, Nik Munaji Nik Mahadi, Ahmad Shukri Abu Hasim, Simulation Investigation of SPWM, THIPWM and SVPWM Techniques for Three Phase Voltage Source Inverter, Department of Power Electronics and Drive, Faculty of Electrical Engineering, Universiti Teknikal Malaysia Melaka, Melaka, Malaysia, pp 223-232 03 April 2014.
[3] Rajesh Kumar Ahuja , Amit Kumar, Analysis, Design and Control of Sinusoidal PWM Three Phase Voltage Source Inverter Feeding Balanced Loads at Different Carrier Frequencies Using MATLAB, Department of Electrical Engg, YMCAUST Faridabad, Haryana, India, pp 234-271, 05 May 2014.
[4] M. F. Abdullah, N. H. Hamid, Z. Baharudin, M. A. M. Ayob and M. A. F. M. Hamim. Electrical and Electronic Engineering Department, Universiti Teknologi Petronas. 2-5 December 2012, 689-694.