Psychology Dissertations Department of Psychology
5-10-2017
Social Attribution in Toddlers At Risk for Autism
Spectrum Disorder
Natasha Ludwig
Follow this and additional works at:http://scholarworks.gsu.edu/psych_diss
This Dissertation is brought to you for free and open access by the Department of Psychology at ScholarWorks @ Georgia State University. It has been accepted for inclusion in Psychology Dissertations by an authorized administrator of ScholarWorks @ Georgia State University. For more information, please [email protected].
Recommended Citation
SOCIAL ATTRIBUTION IN TODDLERS AT RISK FOR AUTISM SPECTRUM DISORDER
by
NATASHA N. LUDWIG
Under the Direction of Diana Robins, PhD & Rebecca Williamson, PhD
ABSTRACT
examining the utility of this measure in reliably identifying ASD in a sample of at risk toddlers with a broad range of verbal and cognitive abilities.
SOCIAL ATTRIBUTION IN TODDLERS AT RISK FOR AUTISM SPECTRUM DISORDER
by
NATASHA N. LUDWIG
A Dissertation Submitted in Partial Fulfillment of the Requirements for the Degree of Doctor of Philosophy
in the College of Arts and Sciences Georgia State University
Copyright by Natasha Nerissa Ludwig
SOCIAL ATTRIBUTION IN TODDLERS AT RISK FOR AUTISM SPECTRUM DISORDER
by
NATASHA N. LUDWIG
Committee Co-Chairs: Diana Robins & Rebecca Williamson
Committee: Lauren B. Adamson Sarah Brosnan
Warren Jones
Electronic Version Approved:
DEDICATION
ACKNOWLEDGEMENTS
I would like to acknowledge my dissertation committee for all of their support in the development and implementation of this project. I would also like to acknowledge the Developmental Neuropsychology Laboratory and the Developmental Laboratory at Georgia State University for helping to make this study possible. Specifically, I would like to thank Riane Ramsey, Shaina Aifuwa, Lashae Nichols, and Katie Suma for their help in data collection. I would also like to acknowledge all of the children and families who participated in this study and the funding sources including the Autism Speaks Weatherstone Predoctoral Fellowship, the Eunice Kennedy Shriver National Institute for Child Health and Human Development grants
TABLE OF CONTENTS
ACKNOWLEDGEMENTS ... V
LIST OF TABLES ... XI
LIST OF FIGURES ... XII
LIST OF ABBREVIATIONS ... XIII
1 INTRODUCTION ... 1
1.1 Theory of Mind (ToM) and mentalizing... 2
1.2 Social-perceptual ToM ... 3
1.3 Motion ... 5
1.4 Social attribution ... 6
1.5 The neural underpinnings of social attribution ... 8
1.6 Early social attribution ... 9
1.7 Social evaluation ... 12
1.7.1 Habituation paradigms for toddlers. ... 14
1.8 Social attribution in ASD ... 15
1.9 Social evaluation in ASD ... 18
1.10 Neural evidence of disrupted social attribution in ASD ... 19
1.13 Touchscreen technology as an experimental paradigm in the study of ASD 21
1.14 Present study... 24
1.15 Specific aims ... 25
1.15.1 Aim 1 ... 25
1.15.2 Aim 2 ... 27
1.15.3 Aim 3 ... 27
1.15.4 Aim 4 ... 28
2 METHODS ... 29
2.1 Participants... 29
2.1.1 Recruitment ... 29
2.1.2 Inclusionary/exclusionary criteria ... 29
2.1.3 Sample ... 30
2.2 Experimental procedures ... 32
2.3 Experimental measures of social attribution ... 33
2.3.1 Puppet Attribution Task (PAT) ... 33
2.3.2 Touchscreen Attribution Task (TAT) ... 38
2.3.3 Reliability of looking time data ... 42
2.4.1 The Modified Checklist for Autism in Toddlers Revised (M-CHAT-R) and
Follow-Up (M-CHAT-R FU) ... 43
2.4.2 Autism Diagnostic Observation Schedule, Toddler Module (ADOS-2) ... 44
2.4.3 Mullen Scales of Early Learning (MSEL) ... 45
2.4.4 Screen Media Questionnaire (SMQ) ... 46
2.4.5 Data analysis ... 47
2.4.6 A note about whether to include NVIQ as a covariate in analyses ... 50
3 RESULTS ... 51
3.1 Sample characteristics... 51
3.1.1 Age ... 52
3.1.2 NVIQ ... 53
3.1.3 M-CHAT-R/F and ADOS-2 ... 54
3.1.4 SMQ-MD & SMQ-MDTP ... 55
3.2 Compliance and participant-specific task variables ... 56
3.3 Results of primary aims ... 58
3.3.1 Aim 1 results: Habituation ... 58
3.3.2 Aim 2 results: PAT... 60
3.3.3 Aim 2a... 62
3.3.5 Aim 2c. ... 65
3.3.6 Aim 2d... 65
3.3.7 Aim 2e. ... 66
3.3.8 Aim 2f. ... 66
3.3.9 Aim 3 results: TAT ... 66
3.3.10 Aim 3a. ... 67
3.3.11 Aim 3b. ... 70
3.3.12 Aim 3c. ... 70
3.3.13 Aim 3d. ... 70
3.3.14 Aim 3e. ... 70
3.3.15 Aim 3f. ... 71
3.4 Aim 4: Exploratory analyses ... 71
3.4.1 Aim 4a... 71
3.4.2 Aim 4b... 72
4 DISCUSSION ... 72
4.1 Habituation... 73
4.2 Social attribution ... 76
4.2.1 Why were previous findings from TD samples not replicated? ... 77
4.3 Social evaluation ... 87
4.4 Limitations ... 93
5 CONCLUSION ... 94
6 REFERENCES ... 95
7 APPENDICES ... 108
7.1 Appendix A ... 108
LIST OF TABLES
Table 1. Characteristics of Toddlers Lost to Follow Up ... 31 Table 2. Characteristics of Toddlers Included in the Final Sample ... 51 Table 3. Non-Compliance Rates on PAT and TAT Looking Time Test and Choice Test in the Final Sample ... 57 Table 4. Seat and Training Characteristics in the Final Sample ... 57 Table 5. Habituation Characteristics for the PAT and TAT in the Final Sample ... 58 Table 6. Performance on the Looking Time Test and Choice Tests for PAT and TAT in the Final Sample ... 61 Table 7. Looking Time Characteristics for PAT Looking Time Test Trials by Trial Number and First Hinderer and Helper Trial for the Final Sample ... 64 Table 8. Looking Time Characteristics for TAT Looking Time Test Trials by Trial Number and First Hinderer and Helper Trial for the Final Sample ... 69 Table 9. Methodological Similarities and Differences in Previous Studies Examining Social
LIST OF FIGURES
Figure 1. Static picture of a PAT Habituation Phase scene. ... 34
Figure 2. Static picture of a PAT Looking Time Test scene. ... 37
Figure 3. Static picture of a TAT Habituation Phase scene. ... 39
Figure 4. Static picture of a TAT Looking Time Test scene. ... 41
Figure 5. Static picture of the TAT Choice Test scene... 42
Figure 6. Mean looking time per habituation trial during the PAT and TAT. ... 60
Figure 7. Percentage of toddlers choosing the Hinderer and Helper during the PAT and TAT Choice Test. ... 66
LIST OF ABBREVIATIONS
1 INTRODUCTION
Autism spectrum disorder (ASD) can be reliably diagnosed in preverbal toddlers, and early diagnosis is becoming more common since the development of early autism screening practices. However, the positive predictive value (PPV) of widely used screening tools remains low, which leads to a high number of false positive cases requiring further evaluation. Recent data suggest that 50-60% of children considered at risk for ASD based on the Modified Checklist for Autism in Toddlers, Revised (M-CHAT-R; Robins, Fein, & Barton, 2009) are diagnosed with an ASD upon further evaluation, and that most of the remaining children are diagnosed with another developmental delay (Robins et al., 2014). Given the expertise required for the differential diagnosis of ASD from other developmental delays in young children and the limited access to specialists due to long waitlists and dearth of specialists in certain regions of the US and the world, there is a pressing need to develop easily accessible and broadly applicable measures that will further streamline screening and diagnosis for at risk toddlers. Considering evidence that individuals with ASD demonstrate early deficits in social cognition, computerized measures of social cognitive functioning appropriate for toddlers with a broad range of cognitive and linguistic abilities may be a useful way to detect behavioral markers of ASD in toddlers and enhance ASD screening practices in pediatric primary care settings.
social attribution may be a promising early behavioral marker of ASD. Therefore, the purpose of this study is to explore the utility of a novel, nonverbal, computerized measure of social attribution in predicting a diagnosis of ASD in a diverse sample of toddlers considered at risk for ASD based on the M-CHAT-R.
1.1 Theory of Mind (ToM) and mentalizing
Each day we are faced with a diverse array of social cues from our environment that we must perceive, integrate, interpret, and act upon. This complex cognitive processing is called social cognition (Carrington & Baily, 2009) and is a fundamental aspect of successful social interaction. Mentalizing is one aspect of social cognition involving the ability to infer mental states in others. The term theory of mind (ToM) is also used to describe this capacity and was first coined by Premack and Woodruff in their seminal paper (1978) discussing the sophistication of social cognition in non-human primates. Premack and Woodruff described ToM as the ability to utilize social cues to attribute mental states to others, including beliefs, feelings, and desires. In typically developing humans, mentalizing is an automatic and adaptive process as it facilitates the successful navigation of our social environment, whereas impairments in ToM can contribute to significant impairments in social interactions characteristic of psychological disorders such as ASD and schizophrenia (Baron-Cohen, 2000;
Bora, Yucel, & Pantelis, 2009; Sprong et al., 2007; Yirmiya et al., 1998).
appreciate a false-belief. Therefore, much of the subsequent research exploring ToM has focused on the ability to understand a false-belief (Bloom & German, 2000; Tager-Flusberg & Sullivan, 2000; Wimmer & Perner, 1983). In fact, some refer to traditional false-belief tasks as the “litmus test” for ToM (Frith & Frith, 1999). However, inherent in Premack and Woodruff’s initial definition is the notion that ToM also involves the attribution of mental states other than beliefs (e.g., desires, emotions). Given that the dichotomous nature of traditional false-belief tasks implies that an individual either has or does not have ToM, and that children generally do not pass these tasks until four years (Wimmer & Perner, 1983), a new generation of experimental measures have been developed to examine whether there are various psychological components that underlie mental state attribution, and whether there is variability in the emergence and expression of these capacities. These new ways to quantify ToM have contributed to the development of a number of theoretical accounts about the underlying processes implicated in ToM. Considering the scientific evidence supporting these various perspectives, it is likely that ToM is a complex construct that requires integration of many psychological and neurobiological processes. A recent review of the past 30 years of research in ToM (Call & Tomasello, 2008) supports that the modern understanding of ToM has certainly broadened from an all-or-nothing phenomenon to a dimensional understanding.
1.2 Social-perceptual ToM
Tager-Flusberg and Sullivan’s (2000) influential account of ToM proposes the need for a
distinction between the traditional cognitive understanding of the mind as a representational
system and the processes that allow us to make immediate mental state attributions based on
into social-perceptual and social-cognitive aspects. While the social-cognitive component
encompasses the traditional interpretation of ToM, that is, the high-level cognitive processes
necessary to understand a false-belief, the social-perceptual component includes the
bottom-up processes that allow us to make more immediate mental state attributions about
intentionality, goals, desires, personality, and emotions based on physical features of the
stimuli such as facial expression, motion, and tone of voice.
From a developmental perspective, the social-perceptual component of ToM appears to
emerge earlier than the social-cognitive component. Although findings from studies utilizing
traditional false-belief tasks have shown that this capacity does not emerge until age four
(Wimmer & Perner, 1983), social-perceptual ToM capacities are evident in the first two years of
life. For example, children as young as three months look in the same direction as an adult’s
gaze (Hood, Willen, & Driver, 1998), and four-month-olds demonstrate distinct reactions to
different facial expressions elicited by others during peek-a-boo play (Montague &
Walker-Andrews, 2001). With regard to understanding intent, infants as young as five months infer that
a person’s reach is intentional (Woodward, 1998), and between nine and 12 months, babies understand others’ intent to reference an object with a use of a pointing gesture (Woodward &
Guajardo, 2002). By one year, babies utilize both negative emotional sounds and direction of
gaze together to infer negative feelings about an object (Moses et al., 2001), and by fourteen
months can utilize facial expression and gaze cues together to infer goals (Phillips, Wellman, &
Spelke, 2002). Additionally, 12-month-olds infer intentions of inanimate objects that appear
animate based on their interactive movements alone, suggesting the importance of movement
Neuroimaging evidence supports that the social-cognitive and social-perceptual components of ToM are distinct (Sax, Carey, & Kanwisher, 2004; Tager-Flusberg, 2000). For example, Gobbini and colleagues (2007) conducted an fMRI study to explore the neural involvement during a traditional false-belief task and a social-perceptual task, and discovered that the neural mechanisms involved in these ToM tasks are distinct. The false-belief task involved areas of the anterior paracingulate cortex, the posterior cingulate cortex/precuneus, and the temporo-parietal junction, which are brain areas often associated with false-belief
tasks (Sax et al., 2004). However, the motion-based mentalizing task involved superior temporal
sulcus, including a locus in the posterior superior temporal sulcus, as well as the frontal
operculum and inferior parietal lobule, and the fusiform gyrus, which are areas commonly
associated with facial perception and action understanding.
1.3 Motion
One physical feature important for social-perceptual mentalizing is human motion. Motion cues help us distinguish whether a moving object is animate or not (Tremoulet & Feldman, 2000) and can help us infer aspects of identity such as age, sex, and physiological state (Blake & Shifrar, 2007). Motion cues can also be socially relevant, that is, facilitate attribution of mental states such as goals, motivations, intentions, and emotions to others (Atkinson et al.; 2004; Schlottmann & Ray, 2009).
typically developing individuals automaticallyattribute emotion, motivations, and intentions to these stimuli.
Attention to social motion cues emerges very early in infancy (Fox & McDaniel 1982; Neri, Marrone, & Burr, 1998). As early as days after birth, typically developing children prefer to look at biological motion over non-biological motion, which supports the importance of experience with motion in early social development (Blake & Shiffrar, 2007; Simion, Regolin, & Bluf, 2008). In fact, it is thought that preference for biological motion is a developmental precursor to mental state attribution (Frith & Frith, 1999). Therefore, the use of tasks tapping the ability to use motion cues to make mental state attributions may have potential as a way to identify early deficits in social-perceptual mentalizing abilities.
1.4 Social attribution
Social attribution is a specific kind of motion-based mentalizing, occurring in the context of anthropomorphization, or the attribution of human features including mental states to geometric shapes based on their movements alone. This process has shown to be immediate and automatic, and is thus considered an aspect of social-perceptual mentalizing.
fact, typically developing individuals find it difficult to describe the movement of the shapes without using human terms, which suggests that the cognitive process implicated in our attempts to make sense of the specific movement stimuli is highly automatic. Interestingly, Heider and Simmel found that there was little variability in participant’s verbal descriptions of
what they saw: All but one participant (n = 34) described the shapes using social vs. physical terms, and participants attributed similar mental states to the figures including intentions, emotions, and personality traits. Of the 33 participants who described the scenes in social terms, 31 participants described the shapes as humans (i.e., they anthropomorphized the shapes), whereas the other two described them as birds. More recent studies have replicated Heider and Simmel’s findings using adaptations of the original task in typically developing adults
(Abell, Happe, & Frith, 2000; Klein et al., 2009; Klin, 2000). Additionally, research has shown that descriptions of social attribution scenes are similar across cultures (Rime et al., 1985), which suggests that motion cues are a universal aspect of social perception.
kinematic features of dynamic visual displays that mediate mental state attribution. Some have found that aspects of motion including temporal contingency with regard to changes in direction (Bassilli, 1976), the relationship between trajectories and velocities (Dittrich & Lea, 1994), the directness of movement towards each other, timing of closeness and the orientation of shapes towards each other (Gao, McCarthy, & Scholl, 2010; Gao, Newman, & Scholl, 2009; Gao & Scholl, 2011) all seem to elicit social interpretations. The Heider and Simmel stimuli are perceptually basic, yet humans quickly and efficiently make mental state attributions. Scholl and Tremoulet (2000) draw parallels between the way in which our visual system automatically works to recover gaps in perceptual stimuli to perceive physical properties and make sense of physical phenomena (e.g., perceiving a two-dimensional shape as three-dimensional based on shadowing), and the way in which we immediately make social interpretations about ambiguous stimuli based on motion cues in order to make sense of the scene.
1.5 The neural underpinnings of social attribution
Castelli and colleagues (2000) utilized PET to better understand functional activation
associated with social attribution. Results showed that social attribution movies, similar to
Heider and Simmel’s original scenes, selectively involve areas of the social brain (Frith, 2007)
including the medial prefrontal cortex, temporoparietal junction (i.e., superior temporal sulcus),
basal temporal regions (i.e., fusiform gyrus and temporal poles adjacent to the amygdala), and
extrastriate cortex (i.e., occipital gyrus). Schultz and colleagues (2003) also explored the
involvement of various brain regions in typically developing adults during an adapted version of Klin’s (2000) Social Attribution Task (SAT) using fMRI. Findings supported involvement of the
temporal sulci, and the lateral portion of the fusiform gyrus, the fusiform face area. The involvement of the fusiform face area was especially interesting since the shapes in the SAT do not have faces, yet this area is known for robust activation during facial perception. Schultz and colleagues suggest that social interactions typically involve facial processing, and when social movement cues are apparent without human form cues, it is likely that this area is automatically recruited for social processing.
Heberlin and Adolphs (2006) described a neuropsychological case study exploring social attribution skills in an adult with bilateral amygdala damage. The patient described the shapes in asocial physical ways, despite typical visual perception and language skills. These findings further support the importance of the amygdala in social attribution. Consistently, interactive movement perception is associated with the amygdala and temporal poles (Santos et al., 2010). Interestingly, a study conducted in typically developing adults showed that anthropomorphization, involves similar underlying brain structures as attributing mental states to humans (Cullen et al., 2013). This suggests that individuals who have deficits in anthropomorphization in the context of social attribution tasks are likely to have deficits in real-world social interactions when attributing mental states to humans is also necessary. These findings support the use of social attribution measures to detect social impairment.
1.6 Early social attribution
the behavior (i.e., that the individual wants to reach the goal). To explore whether babies have the capacity to attribute a mental state in the presence of goal-directed behavior, a series of studies were conducted using a modified social attribution task appropriate for nonverbal infants (Kuhlmeier, Wynn, & Bloom 2003). After watching brief computerized movies featuring geometric shapes helping or hindering another shape attempting to climb a hill, infants as young as 12 months make mental state attributions about the shapes’ attitudes as evidenced by preference towards looking at novel scenes depicting a coherent continuation of the social interaction (i.e., climber floated to the top of the screen to be near the helper shape) compared to incoherent scenes (i.e., climber floated to the top of the screen to be near the hinderer; Kuhlmeier et al., 2003). These data suggest that infants utilize the mental state attributions (i.e., a disposition) they make about the shapes to make sense of the shapes’ behavior. A follow-up experiment revealed that results could not be explained by a preference for positive associations between shapes (i.e., infants attributing a goal to the climber to get to the top of the hill and associating that when he reached the goal, the helper was near him, and when he didn’t reach the goal, the hinderer was near him), but were in fact due to attribution of a
disposition to the climber (Kuhlmeier et al., 2003). This was achieved by having the helper or hinderer move towards the climber during a novel test phase. Results from this follow up study showed that infants’ looking time during these test trials did not differ and thus preference for
the climber moving towards the helper indicated infants’ attribution of a disposition to the climber.
colleagues’ (2003) social attribution paradigm; 10-month-old infants evidenced surprise (i.e., longer looking time) when they witnessed the climber shape move towards the hindering shape instead of the helping shape. Notably, although Kuhlmeier and colleges (2003) and Hamlin and colleagues used a similar paradigm across studies it must be highlighted that infants actually looked longer to the expected event in Kuhlmeier study (i.e., the climber approaching the helper) and in contrast, looked longer towards the surprising event in the Hamlin study (i.e., the climber approaching the hinderer). Primary differences across these two studies include that the Kuhlmeier paradigm was computerized and used a test task featuring the climber shape floating in the air up toward the hinderer or helper, whereas the Hamlin paradigm was a puppet show with a more naturalistic test task featuring the climber shape moving towards the hinderer or helper positioned on the ground to the right or left. Nonetheless, there was a difference in looking time towards both events indicating that the infants engaged in social attribution.
complex measure than reacting based on a violation of expectation (Hood, Cole-Davies, & Dias, 2003). Babies directed significantly more anticipatory gaze toward the expected rather than the unexpected event, suggesting that they use the shapes’ mental state to predict their behavior.
Taken together, these studies support that children as young as 10 months anthropomorphize ambiguous shapes and make predictions about the shape’s social behavior based on movement cues alone.
1.7 Social evaluation
Some studies have used nonverbal social attribution paradigms to explore a related aspect of social cognition involving young children’s ability to make social evaluations about
ambiguous visual stimuli based on motion cues. Whereas social attribution is the process of attributing mental states to others, social evaluation involves making judgments about another (e.g., if they are nice and helpful, or mean and harmful) based on observation of the other’s
retrieving the ball.
Using the social attribution paradigm, Hamlin, Wynn, and Bloom (2007, 2010) explored whether babies take into account individuals’ actions towards others in making their own social
evaluations about the individual. This would be adaptive for early survival as it would help babies identify those who may be harmful vs. those who may be helpful to them. Hamlin and colleagues (2007) found that children six and 10 months old prefer to play with the helping shapes over the hindering shapes after viewing the social attribution puppet paradigm. Follow-up experiments suggest that this preference is based on both avoidance of hindering shapes and seeking out of helping shapes.
1.7.1 Habituation paradigms for toddlers.
Habituation is characterized as a progressive decreased response to presentations of a stimulus over time. Habituation is an adaptive learning response in an effort to maximize processing of unlearned vs. learned stimuli in the environment. This response is capitalized upon in infant habituation studies utilizing looking-time, as habituation is measured by decreased looking time towards a repeated stimulus. Visual habituation studies in infants have shown that habituation rates predict later outcomes such as intelligence (Bornstein & Sigman, 1986; Colombo, 1993; McCall & Carriger, 1993).
In the reviewed studies examining social attribution/evaluation in infant samples (i.e., Hamlin et al., 2007, 2010; Kuhlmeier et al., 2003) a habituation paradigm was utilized to present children with the social scenes. However, minimal habituation characteristics were reported (i.e., how many met habituation criterion within the maximum number of trials, mean number of trials to reach habituation criterion, mean looking times during habituation, number were excluded due to fussiness during habituation) so it is unclear how typically developing infants habituate to these particular scenes.
habituation-based paradigm in toddlers; however further research is required to understand its feasibility.
1.8 Social attribution in ASD
As reviewed, social attribution seems fundamental to human cognition, and weaknesses in this area may have cascading effects on social functioning. This has led theorists to propose that problems in this domain might contribute to the social deficits observed in individuals with ASD. In particular, the social communication deficits in ASD could be the result of a core deficit in social cognitive processing, which includes social attribution.
Many studies, by using traditional false-belief tasks, support the claim that individuals with ASD demonstrate specific deficits in mentalizing compared to typically developing children and children with other delays (Baron-Cohen, Leslie, & Frith, 1985); however other studies have shown that some individuals with ASD, especially those who are higher functioning, succeed in these tasks despite impairment in real-world social functioning (Bauminger & Kasari, 1999; Bowler, 1992; Peterson, Slaughter, & Paynter, 2007, Senju et al., 2009; Shamay-Tsoory, 2008). Research suggests that those with high functioning ASD who succeed on false-belief tasks may be using compensatory strategies, which are not available or useful in real-world social situations. For example, individuals with Asperger’s disorder did not use mental state
Sullivan, 1994; Yirmiya et al., 1998). Additionally, traditional false-belief tasks are typically presented in an explicit problem-solving format, which is not representative of real-world social situations where individuals must spontaneously attend to, identify, interpret, and utilize ambiguous social information.
Also important is the dichotomous nature of ToM tasks, which likely contributes to the low test-retest reliability of these measures (Klin, 2000) and implies that ToM is an all-or-none phenomenon, which is likely not the case (Yirmiya et al., 1998). Taken together, these data suggest that traditional false-belief tasks may not capture the full range of ToM, and may contribute to the inconsistent findings across the autism spectrum.
Although individuals with mild forms of ASD may succeed in solving social-cognitive tasks such as measures of false-belief, they tend to show deficits during social-perceptual ToM tasks, which is likely due to reduced opportunities for use of more cognitive compensatory mechanisms (Cohen, Joliffe, Mortimore, and Robertson, 1997; Klin, 2000; Klin, Baron-Cohen et al., 1997; Tager-Flusberg and Sullivan, 2000). Additionally, because social-perceptual mentalizing skills emerge earlier than the social-cognitive components, social-perceptual tasks
have potential to detect deficits earlier. Taken together, social-perceptual mentalizing tasks
may be more valid measures of ToM in individuals across the autism spectrum throughout the
lifespan.
adaptation of the traditional Heider and Simmel (1944) stimuli included minor adaptations to make the stimuli appropriate for individuals with developmental disabilities as well as the development of a coding scheme that could capture the variability in social attribution responses. The task reduces the possibility of verbal scaffolding by limiting the explicit nature of the instructions and task demands because participants are required to spontaneously search for social meaning in the ambiguous displays based on motion cues alone. Typically developing individuals automatically anthropomorphize the shapes and attribute mental states to them as is evident by their verbal descriptions of the scenes (Klin, 2000).
Klin also recruited a sample of adolescents and adult participants with autistic disorder and Asperger’s disorder who had previously passed a traditional false-belief task, despite
real-world social impairments. Individuals in both ASD groups described the movies in significantly less social ways compared to a typically developing sample. Specifically, individuals with ASD described fewer of the social elements of the scenes, provided more information unrelated to the social plot, attributed fewer personality traits to the shapes, and did not use mental state attribution terms as frequently in their descriptions compared to controls. Importantly, these deficits were not associated with verbal IQ or metalinguistic skills.
evidence suggests that performance on forced-choice social attribution measures correlates with impairments in social interaction as measured by the Autism Diagnostic Observation Schedule (Boraston et al., 2006). Findings also extend to young children with autism. For example, four to six- year-olds with autism take longer to learn to discriminate animate from inanimate geometric shapes based on movements alone, compared to children with developmental delays and typically developing children (Rutherford, Pennington, & Rogers, 2006), and children with autism as young as five are able to detect differences between mechanical vs. intentional movements of the shapes, but they make less reference to coordinated actions between shapes in their verbal descriptions, compared to typically developing children (Bowler & Thommen, 2000).
1.9 Social evaluation in ASD
1.10 Neural evidence of disrupted social attribution in ASD
Evidence from neuroimaging studies also support reduced social attribution in individuals with ASD. Several neuroimaging studies have revealed that individuals with ASD demonstrate unique patterns of activation during social attribution tasks compared to typical controls; whereas typical controls demonstrate selective activation in brain areas associated with mentalizing (including the medial prefrontal cortex, superior temporal region, fusiform gyrus and temporal poles) while engaged in tasks of social attribution, individuals with ASD show reduced activations in these areas of the social brain (Castelli et al., 2000; Castelli et al., 2002; Ludwig et al., in prep; Schultz, et al., 2003).
1.11 A note about the social cognition and social motivation hypotheses of ASD
very young children with ASD also show a preference for nonsocial physically contingent movement vs. socially relevant biological motion (Klin et al., 2009) and dynamic geometric images vs. social images (Pierce et al., 2011). Chevallier and colleagues (2012) suggest that deficits in social motivation precede deficits in social cognition; however, the authors also
highlight that ToM has not adequately been studied in infants who later develop ASD. Although
the current study does not aim to support or refute either of these hypotheses, it does aim to examine the utility of a measure of social attribution in toddlers, which may be appropriate for use in infant studies of mentalizing in the future.
1.12 Habituation paradigms in ASD, non-ASD delays, and typical development
Although there are few studies examining visual habituation characteristics in typically developing toddlers, there have been some studies examining visual habituation in toddlers with and without delays. Specifically, a recent study by Vivanti and colleague’s (2017) examined
toddlers’ habituation to novel vs. repeated non-social stimuli (i.e., geometric shapes) presented simultaneously on a screen. Notably, toddlers with ASD required more trials to habituate to the repetitive stimuli compared to typically developing and toddlers with Williams’ syndrome;
however, the percentage of toddlers who did not reach habituation during the maximum number of presentations were not reported. Furthermore, toddlers with ASD also demonstrated reduced looking towards both the novel and repetitive stimuli compared to typically developing toddlers and those with William’s Syndrome suggesting a decreased
maximum number of trials to reach habituation. Results indicated that toddlers with ASD with high symptom severity took longer to habituate to social vs. non-social stimuli and took longer to habituate to social stimuli compared to toddlers with ASD with low severity of symptoms, toddlers with non-ASD delays, and typically developing toddlers. Notably, this toddler study also presented novel and habituated stimuli to toddlers after habituation and found no novelty preference (i.e., increased looking time towards the new stimuli) in the typically developing group or the ASD group. This lack of novelty preference in the TD group suggests that the habituation paradigm and/or the novelty outcome procedure does not work the same way in toddlers as it does for infants. Taken together, it appears that toddlers with ASD may demonstrate differential habituation compared to typically developing toddlers and toddlers with non-ASD delays, but it is questionable whether visual habituation paradigms in toddlers with and without delays function the same way as they do in infant studies.
1.13 Touchscreen technology as an experimental paradigm in the study of ASD
Given that access to clinicians specializing in early diagnosis of ASD is limited, there is a pressing need to develop easily accessible and valid measures that can be administered in a variety of contexts and with children with a broad range of abilities in order to further streamline screening and diagnosis of ASD in toddlers. Considering this, the development of computerized methods that capture behavior in toddlers may be a useful technology in meeting this need.
augmented communication systems for use in children with autism and have shown successful in helping children with autism build language (Samnath et al., 2012). However, given that touchscreen computers are relatively new, research on the use of touchscreen technology in experimental paradigms conducted in young children with disabilities is limited despite research demonstrating the feasibility of touchscreen devices in experimental and clinical settings (Stephenson & Limbrick, 2015). A recent review of literature examining use of touchscreen in individuals with disabilities showed that most studies were related to use of
touchscreens for speech generation, prompting, and leisure activities and stresses the lack of
literature examining touchscreen use in young samples (Stephenson & Limbrick, 2015).
Brukilacchio, & Tager-Flusberg, 2016). Specifically, assessments of receptive language included
traditional standardized direct assessment methods, parent report methods, and two
experimental assessment tasks, one using eye tracking and another using a touch screen.
Notably a number of children were able to demonstrate receptive language skills on the
touchscreen task even though they were unable to demonstrate knowledge on the direct
standardized assessment, which included many of the same words. This demonstrates that
touchscreen methods may be a useful way to assess individuals with a broad language of
language abilities who may not otherwise be able to be assessed using traditional methods.
With regard to feasibility, the eye-tracking task was associated with greater amount of
unreliable data compared to the touchscreen task. Taken together, these data suggest that touchscreen paradigms may be a useful way to study individuals with ASD and may have potential for clinical application.
& Clavert, 2000) found that children with ASD learned more words from the computer instruction over teacher instruction and children with ASD paid more attention to and were more motivated by the computer intervention. Additionally, one study shows that while individuals with ASD demonstrate deficits on traditional cognitive tasks, these deficits are not shown on computerized versions of the same task (Landry & Al-Taie, 2016). Taken together these findings suggest that screen media may be highly engaging and may even scaffold learning or performance in individuals with ASD.
1.14 Present study
technology in clinical tool development and in the study of child development more broadly. This study also aims to explore habituation specific characteristics that may inform the utility of habituation paradigms such as the PAT and TAT in toddler populations and further build upon the very small body of literature examining potential differences in habituation characteristics that may differentiate toddlers with ASD from toddlers with non-ASD delays and typical development.
Although implementation of this paradigm may not be feasible as a clinical tool to facilitate screening given the reliance on gaze monitoring, which requires expertise, this study seeks to provide the basic science necessary to inform the development of more implementable designs using social attribution measures and touchscreen technology. Additionally, this study will also provide data about use of a new way to explore social cognition in preverbal infants/toddlers and individuals with ASD through the utilization of new touchscreen interfaces.
1.15 Specific aims
1.15.1 Aim 1
as well as clinical tool development. With regard to the current study, examining habituation characteristics is necessary in informing the integrity of findings. Specifically, if children did not habituate to the scenes, this puts into question whether subsequent performance on measures of social attribution are valid. Furthermore, examining habituation characteristics by diagnosis will inform whether group differences in performance on measures of social attribution are accounted for by differential habituation rather than differences in social attribution. Beyond this, examination of habituation characteristics may also inform the broader body of research examining habituation differences in children with ASD and non-ASD delays compared to typically developing children and whether these differences may be a useful behavioral marker in early identification.
PAT, but would demonstrate increased engagement on the TAT compared to the TD and DD groups.
1.15.2 Aim 2
Aim 2 examines performance on measures of social attribution and social evaluation during the PAT. Specifically, Aim 2 serves to determine whether performance on the PAT would differentiate ASD from non-ASD delays, in a sample of at-risk toddlers, and typical development. It was hypothesized that children without ASD (i.e., DD and TD) would demonstrate evidence of social attribution, as demonstrated by increased looking towards an unexpected event compared to an expected event (i.e., PAT Looking Time Test), and evidence of social evaluation, as demonstrated by preference for choosing a helping over hindering character (i.e., PAT Choice Test), whereas children with ASD would demonstrate reduced evidence of social attribution and social evaluation on these measures. Additionally, it was predicted that performance on these measures would predict a diagnosis of ASD and ASD symptom severity.
1.15.3 Aim 3
character (i.e., TAT Choice Test), whereas children with ASD would demonstrate reduced evidence of social attribution and social evaluation on these measures. Additionally, it was predicted that performance on these measures would predict a diagnosis of ASD and ASD symptom severity.
1.15.4 Aim 4
groups.
2 METHODS
2.1 Participants
2.1.1 Recruitment
All toddlers in the ASD and DD groups were recruited through ongoing studies of the Modified Checklist for Autism in Toddlers, Revised plus Follow-Up (M-CHAT-R/F; Robins, Fein, & Barton, 2009) at Georgia State University (GSU), funded by NICHD and Autism Speaks. Recruitment of toddlers in the TD sample was accomplished through the M-CHAT-R/F studies, another study of longitudinal development at GSU funded by NICHD, or word of mouth. All toddlers included in the TD sample received the M-CHAT-R/F either through participation in another study at GSU or through participation in the current study and did not show risk for ASD on this measure.
2.1.2 Inclusionary/exclusionary criteria
All toddlers recruited in this study were between the age of 15 and 36 months English speaking, and parent/guardian consent for participation was obtained. Toddlers with severely impaired sensory or motor functioning that would interfere with experimental procedures were excluded.
study to detect ASD cases missed by M-CHAT-R/F), and received a comprehensive diagnostic evaluation at GSU through the M-CHAT-R/F studies. Toddlers were excluded from the sample if they did not receive a DSM-5 diagnosis after evaluation based on a positive M-CHAT-R/F screen.
For the TD group, history of developmental delays, neurological problems, or psychological diagnoses was exclusionary. All toddlers in the TD group did not show risk for ASD on the M-CHAT-R/F.
2.1.3 Sample
This study recruited 116 toddlers from February 2015 through March 2017. The experimental measures of social attribution (i.e., PAT and TAT) were piloted on the first 12 participants. Because the task design was changed after the pilot phase, data collected from the first 12 participants were excluded from analyses. Of the 104 remaining participants, 14 were considered at risk for autism based on the M-CHAT-R/F and were referred for comprehensive diagnostic evaluation through the M-CHAT-R/F studies but did not receive a DSM-5 diagnosis upon evaluation. They were excluded from analyses. Four additional children were erroneously recruited despite meeting exclusionary criteria (i.e., deafness (n = 1), outside age range (n = 1), high ADOS-2 score despite GDD diagnosis (n = 1), study staff concerned about development for a child in the TD group (n = 1) and were also excluded. An experimental error occurred during nine administrations (e.g., computer malfunction, sound malfunction, administration error) and data collected from these children were excluded.
did not tolerate the task during Habituation Phase and were considered “fuss outs.” One child in the TD group fussed out during the PAT (first session then lost to follow up) and two children during the TAT (one child in the TD group during the first session and was lost to follow up, one child in the DD group during the second session and PAT was completed). Only toddlers who successfully completed (i.e., defined as full habituation data collected) both experimental measures of social attribution (i.e., PAT and TAT) were included in the final sample.
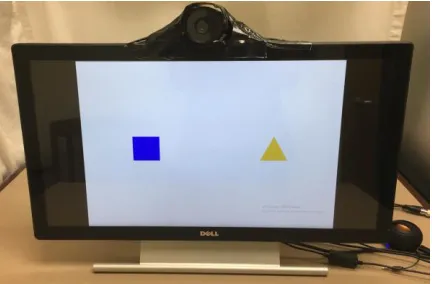
Table 1. Characteristics of Toddlers Lost to Follow Up
Variable
Total (n = 16)
ASD (n = 2)
DD (n = 6)
TD (n = 8) Age at Session 1 (months)
Mean 21.87 20.08 22.01 22.2
Range 18-28 20 19-28 18-27
Standard Deviation 3.13 0.44 3.57 3.29
Sex
Male (%) 13 (76.5) 2 (100.0) 4 (66.7) 7 (87.5)
Female (%) 3 (17.6) 0 (0.0) 2 (33.3) 1 (12.5)
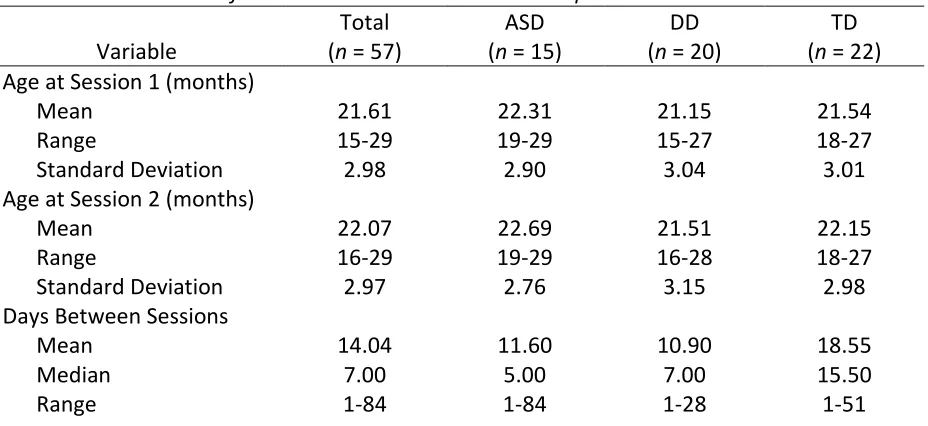
Fifty-seven toddlers (nmale=34) between the ages of 15 and 29 months of age at the time
of Session 1 (m=21.61, SD=2.96) completed the PAT and the TAT and were included in the final sample (i.e., nASD=15, nDD=20, nTD=22). All toddlers in the ASD and DD groups screened positive
2.2 Experimental procedures
All toddlers in the ASD or DD groups were invited for a comprehensive diagnostic evaluation through the M-CHAT-R/F (Robins, Fein, & Barton, 2009) studies at GSU. The comprehensive evaluation included a caregiver reported history, cognitive/developmental testing (i.e., Mullen Scales of Early Learning; MSEL; Mullen, 1995), assessment of adaptive functioning (i.e., Vineland Adaptive Behavior Scales, Second Edition; Sparrow, Cicchetti, & Balla, 2005), and ASD specific diagnostic assessments based on direct observation (i.e., Autism Diagnostic Observation Schedule, Second Edition; ADOS-2; Lord et al., 2012), and parent report of behavior (i.e., Toddler ASD Symptom Interview; TASI; Barton et al., 2012). Final diagnoses were made based on clinical judgment based on DSM-5 criteria. For children in the ASD and DD groups, clinical data from participation in the M-CHAT-R/F studies were shared to categorize toddlers into diagnostic group. Specifically, toddlers diagnosed with ASD were included in the ASD group and toddlers diagnosed with Global Developmental Delay (GDD) or Language Delay (LD) were included in the DD group. Furthermore, MSEL data was used to characterize the sample and M-CHAT-R/F and ADOS-2 scores were used to explore whether performance on these measures relates to performance on experimental measures of social attribution in the current study.
Participation in the current study occurred during two sessions on separate days. Mean number of days between Session 1 and 2 was 14.04 (SD = 14.60; median = 7.00). Notably, time between sessions was greater than one month for only four participants (nASD = 1, nTD = 3).
additional questionnaires as part of other studies) to parents. Session 2 involved administration of the PAT or TAT (whichever was not administered during Session 1), de-briefing, and compensation for full study completion (i.e., $20). Toddlers in the TD group who did not receive the M-CHAT-R/F (i.e., toddlers recruited through word of mouth) or the MSEL (i.e., toddlers recruited through word of mouth or though M-CHAT-R/F studies) through other studies at GSU were also administered the M-CHAT-R/FU and/or the MSEL Visual Reception scale as part of study participation during Session 1.
Most toddlers were recruited after their participation in another study at GSU. If the family agreed to participate, Session 1 of the current study was run that day. Toddlers in the ASD and DD groups typically returned to GSU to complete their participation in the other study, and Session 2 of the current study was typically added to that session. A smaller group of toddlers in the ASD group and TD group returned to GSU to complete Session 2 of the current study only. Toddlers in the TD group who were recruited through another study at GSU typically returned to GSU to complete Session 2 of the current study only. For toddlers in the TD recruited through word of mouth (n = 1), both sessions were scheduled independently of participation in any other study at GSU.
2.3 Experimental measures of social attribution
2.3.1 Puppet Attribution Task (PAT)
both test phases are intended to demonstrate whether children understood the social context of the scenes presented during the Habituation Phase and are considered primary measures of social attribution in the current study.
2.3.1.1 PAT Habituation Phase
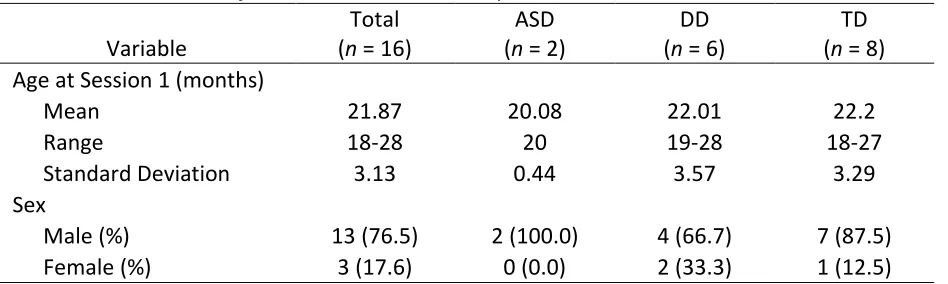
[image:51.612.73.290.433.576.2]Toddlers were habituated to helping and hindering social puppet scenes featuring a green hill and three colored shape puppets (circle, square, and triangle) displayed on a puppet stage. See Figure 1 for a static picture of a PAT Habituation scene. Notably, research has shown that typically developing children less than 12 months old require googly eyes on the shapes to demonstrate success in similar tasks (Hamlin et al., 2007; Kuhlmeier et al., 2003); however, because the presence of eyes provides increased scaffolding for mental state attribution, there were no eyes on the shapes in order to study the purest form of social attribution for the purposes of this study.
Figure 1. Static picture of a PAT Habituation Phase scene.
sat either on their parent/guardian’s lap or in a highchair with their parent standing next to
them (based on parent preference). Parents were instructed not to interfere with their child’s behavior during the task, but could say “Wow!” or “Cool!” to express interest with the
experimental environment. Parents were explicitly instructed not to instruct their child to “Look!” at anything during the task. Toddlers were seated 3.5 feet away from the puppet stage.
Each Habituation trial consisted of a scene presentation phase followed by a looking time phase. An experimenter, who was out of sight, controlled the climber, helper, and hinderer shapes. At the start of each habituation trial, the curtain was removed to reveal the puppet stage with the climber shape at the bottom of the hill, which began the scene presentation phase. In all scene presentations, the climber shape attempted to climb up the hill, but fell back down twice. In the helping trials, the helper shape came on the stage after the climber fell twice and pushed the climber up the hill and then the climber wiggled (i.e., in “celebration”). In the hindering trials, the hindering shape came on the scene after the climber
fell twice and pushed the climber down the hill during the climber’s third attempt up the hill.
The number of touches, the speed of touches, and the duration of touches between the helper or hinderer and the climber were the same to minimize differences across conditions. Each scene presentation lasted approximately 10 seconds.
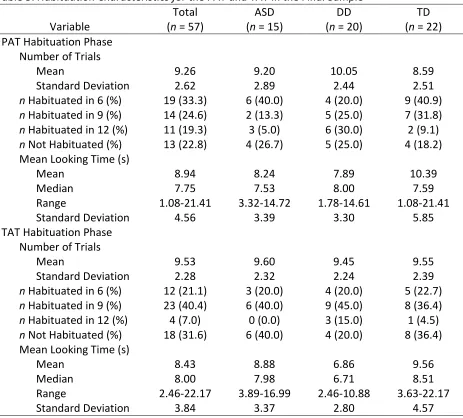
habituation trial. Each looking time phase ended when the toddler looked away continuously for 3 seconds or after 30 seconds of looking had elapsed. For children who did not look towards the scene within 10 seconds of initiation of the looking time phase, the looking time phase was ended. The curtain closed to occlude the display after each Habituation trial. Habituation trials alternated between helping and hindering (counterbalanced with constraint for first trial) until the habituation criterion was reached: sum of the looking time during three consecutive looking time phase trials is less than half of the sum of the looking time on the first three looking time phase trials (max: 12 trials). Toddlers were subsequently presented two tests to measure social attribution; the PAT Looking Time Test and the PAT Choice Test. Notably, the Looking Time Test always preceded the Choice Test.
2.3.1.2 PAT Looking Time Test Phase
Figure 2. Static picture of a PAT Looking Time Test scene.
Toddlers were presented with six alternating helping and hindering Looking Time Test trials to measure evidence of social attribution (counterbalanced with constraint for first trial). Each Looking Time Test trial included a scene presentation phase and a looking time phase. At the start of each Looking Time Test trial, the curtain was removed to show the scene, which began the scene presentation phase. In the helping test trials, the climber wiggled then moved towards the helping shape, whereas in the hindering test trials, the climber wiggled then moved towards the hindering shape. Each scene presentation lasted approximately three seconds in duration.
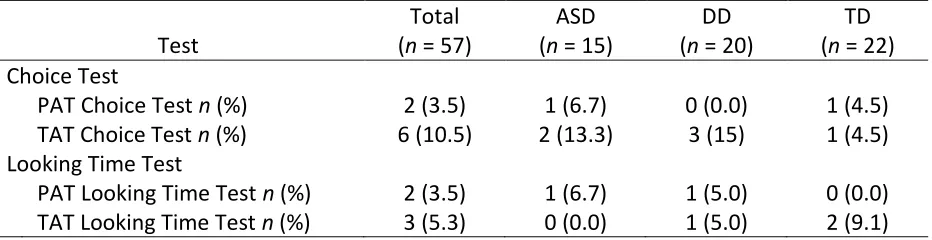
occlude the display after each Looking Time Test trial. Compliance with the Looking Time Test was defined as looking towards at least one helping and one hindering test scene during the Looking Time Test.
2.3.1.3 PAT Choice Test Phase
During the PAT Choice Test, parents were instructed to close their eyes for the task duration such as not to influence the child’s behavior during this test. Toddlers were presented both the helping and hindering puppet shapes, which were placed on the table in front of them 17 inches apart (side counterbalanced with constraint). Toddlers were immediately instructed to “Touch a shape.” Their choice was defined as the shape they touched first. Notably, the
curtain occluded the puppet display such that the toddler could not reference the scene in making their choice. In the case that the child touched both shapes at the same time, their hands were removed from the shapes and they were instructed to “Touch one.” This was
attempted until the child clearly touched one shape before the other. Compliance with the Choice Test was defined as the child clearly touching one shape before the other. If a child refused to touch one shape after several prompts, they were considered non-compliant with the Choice Test.
2.3.2 Touchscreen Attribution Task (TAT)
presented during the Habituation Phase and are considered primary measures of social attribution in the current study.
2.3.2.1 TAT Habituation Phase
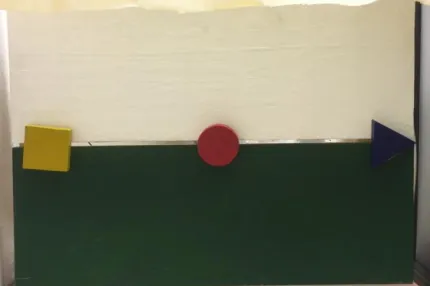
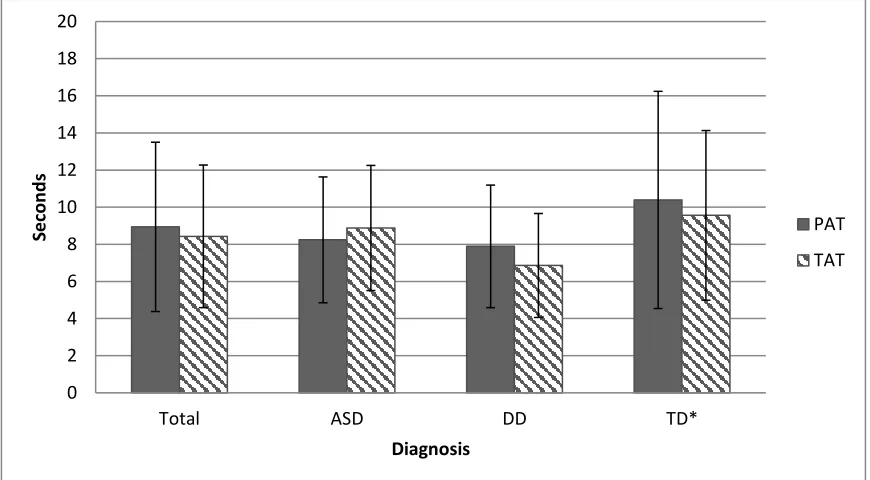
[image:56.612.73.289.550.692.2]Toddlers were habituated to helping and hindering social cartoons featuring a green hill and three colored shape characters (circle, square, and triangle) displayed on a touchscreen computer monitor. See Figure 3 for a static screen shot of a TAT Habituation Phase cartoon. Toddlers were seated 24 inches away from a touchscreen computer monitor (20’’x13’’). All Habituation trial stimuli (i.e., all scene proportions, colors, shape movements) and procedures were identical to the Habituation trials in the PAT with the exception of presentation modality (i.e., computer touchscreen instead of a puppet stage). Furthermore, instead of a curtain opening and closing between Habituation trials, a cross hair was displayed for two seconds along with the sound of spoons “clinking” between TAT Habituation trials. The total looking time toward the cartoon during the looking time phase was also computed for each Habituation trial during the TAT. Toddlers were then presented two tests to measure social attribution; the TAT Looking Time Test and the TAT Choice Test. Notably, the Looking Time Test always preceded the Choice Test.
2.3.2.2 TAT Looking Time Test Phase
Figure 4.Static picture of a TAT Looking Time Test scene.
2.3.2.3 TAT Choice Test Phase
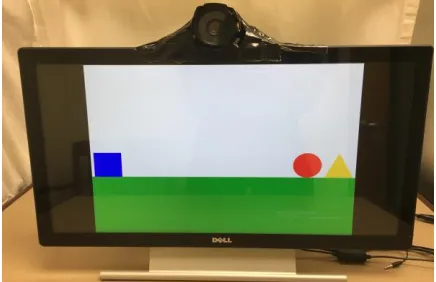
The TAT Choice Test was designed to be the computerized equivalent of the PAT Choice Test. During the Choice Test, the touchscreen was pulled closer to the child such that it was positioned within arm’s reach for the child and centered directly in front of them. The TAT Choice Test consisted of two phases, a training phase and a choice phase. The training phase was designed to familiarize the child with the touchscreen. In the training phase, the climber shape (i.e., red circle) was displayed in the center of the screen and an audio recording was played saying, “Touch the shape.” The experimenter then modeled touching the shape, which
initiated a 10 second cartoon clip of the climber shape moving around the screen paired with a musical tune. The climber then appeared again in the center of the screen and an audio recording was played saying, “You touch the shape” which was meant to encourage the child to
experimenter provided hand-over-hand support for the child to touch the shape (whether the child required hand-over-hand guidance during training was recorded).
The choice phase began immediately after the training phase. The choice phase included presentation of the helping and hindering shapes presented equidistant from each other on the right and left side of the screen and the computer simultaneously played an audio recording saying, “You touch a shape.” The child’s choice was recorded as the shape they
touched first, which initiated a 10 second cartoon clip of the shape they touched moving around the screen paired with a musical tune. Unlike the PAT, there were no cases where the child attempted to touch both shapes at the same time. If a child refused to touch one shape after several prompts, they were considered “non-compliant” with the task and no choice was
[image:59.612.73.289.402.544.2]recorded.
Figure 5. Static picture of the TAT Choice Test scene.
2.3.3 Reliability of looking time data
Habituation Phase was .972 with a 95% confidence interval of .960 to .980 (F(125, 125) = 35.336, p < .001, and for the Looking Time Test Phase was .944 with a 95% confidence interval of .915 to .963 (F(89, 89) = 17.824, p < .001. For the TAT, the average measure ICC for the Habituation Phase was .925 with a 95% confidence interval of .895 to .946 (F(137, 137) = 13.283, p < .001 and for the Looking Time Test Phase was .856 with a confidence interval of .780-.906 (F(85, 85) = 6.968, p < .001.
2.4 Additional measures
2.4.1 The Modified Checklist for Autism in Toddlers Revised CHAT-R) and Follow-Up
(M-CHAT-R FU)
Follow-Up Total Score. Children with a M-CHAT-R Follow-Up Total Score between 2 and 7 are considered a screen positive (i.e., at risk for ASD) and are referred for a comprehensive diagnostic evaluation. Initial psychometric properties of the M-CHAT-R/F were reported in a sample of 16,115 low-risk toddlers (Robins et al., 2014). Consistency across the M-CHAT-R and Follow-up was adequate (Cronbach’s alpha = 0.79). Sensitivity and specificity were estimated to be 0.854 and 0.993, respectively, and positive predictive value (PPV) was reported to be 0.475. Notably, PPV for any developmental delay or concern was 0.946.
M-CHAT-R/F Final Total Score (FTS) was used for the purposes of the current study. For children who did not screen positive on the M-CHAT-R (i.e., M-CHAT-R Total Score of 2 or less), the M-CHAT-R/F FTS was the M-CHAT-R Total Score. For children who screened positive on the M-CHAT-R, the M-CHAT-R/F FTS is the M-CHAT-R Follow-Up Total Score.
2.4.2 Autism Diagnostic Observation Schedule, Toddler Module (ADOS-2)
the SA and RRB domain domains. The Toddler Module provides two algorithms: One for children between 12 and 20 months/children aged 21 to 30 months with limited words (All Younger/Older With Few to No Words) and the other for children within the ages of 12 to 30 months and some words (Older With Some Words). The ADOS-2, Toddler Module classifies individuals into one of three categories; Little-to-No Concern, Mild-to-Moderate concern, and Moderate-to-Severe concern. Interrater reliability and test-retest reliability on the ADOS-2 Toddler Module ranged from .84 to .99 and .60 to .95, respectively, for the SA and RRB domain scores and total scores (intraclass correlations). Sensitivity ranged from 83% to 91% and specificity ranged from 86-94% for the SA and RRB domain scores and total scores. Interrater agreement in broad diagnostic classification ranged from 87% to 97%.
The ADOS-2 includes a Calibrated Severity Score (CSS) that can be used as a measure of symptom severity (Gotham, Pickles, & Lord, 2009). Scores range from 1-10, with higher scores representing greater severity. Total CSS on the ADOS-2 was used as a measure of ASD severity in the current study.
2.4.3 Mullen Scales of Early Learning (MSEL)
adequate concurrent validity with the Bayley Scales of Infant Development Mental Development Index (r = .70; Bayley, 1969).
Standardized scores on measures such as the MSEL tend to be insensitive to variability in lower functioning toddler populations due to floor effects (Carter et al., 2007). For example, toddlers with developmental delays often bottom-out on the MSEL with a T-score of 20. In order to capture variability in item performance in developmentally delayed samples, previous studies have utilized age-equivalent (AE) scores instead of standard scores in analyses (Carter et al., 2007; Hartley & Sikora, 2009). Furthermore, given the variability in the onset of language in toddlers, a nonverbal reasoning measure, such as the MSEL Visual Reception scale score, is often used as an estimate of IQ in this age group (Carter et al., 2007; Hartley & Sikora, 2009). Therefore, a nonverbal Intelligence Quotient (NVIQ) score was computed for each subject by dividing the MSEL Visual Reception AE, by chronological age, and multiplying this number by 100. This NVIQ score was used as an estimate of IQ in this study.
2.4.4 Screen Media Questionnaire (SMQ)
developed to explore the potential impact of experience with screen media and performance on the TAT. The SMQ is a novel measure and psychometric properties are currently unavailable.
An SMQ Average Total Minutes Per Day (SMQ-MD) was computed for study analyses. The SMQ-MD was computed by multiplying the reported average number of minutes of total screen media use per weekday by five and multiplying the reported average number of minutes of total screen media use per weekend day by two and summing these totals then dividing by seven to yield the average reported minutes of screen media use per day. A similar approach was taken to compute average use of tablet and smart phone per day (SMQ Average Total Minutes Per Day for Tablet and Smart Phone; SMQ-MDTP) given that these technologies are most similar to the TAT paradigm.
2.4.5 Data analysis
2.4.5.1 Statistical analyses
Means, standard deviations and ranges or frequencies and percent of sample were computed for all variables of interest. Correlations between sample characteristics and all outcome variables of interest were examined in the whole sample. Pearson’s correlation was used for continuous dependent variables and point-biserial correlation was used for dichotomous variables.
Aim 1. Aim 1 explored whether toddlers demonstrated habituation to helping and
was met during the Habituation Phase. Two 3x2 chi-square analyses were also conducted including diagnostic group (i.e. ASD, DD and TD) and whether habituation criterion was met during the Habituation Phase. (1b) To examine whether there were differences in the number of trials required for habituation by task and diagnosis, a mixed factorial ANOVA was conducted with diagnostic group as the between subjects factor and mean number of trials presented before the habituation criterion was reached on the PAT and the TAT as the repeated factor. Notably, for the purposes of calculating means and standard deviations, toddlers who did reach habituation criterion were assigned the maximum trial count of 12. (1c) To examine whether there were differences in engagement during habituation by task and diagnosis, a mixed factorial ANOVA was conducted with diagnostic group as the between subjects factor and mean looking time per habituation trial as on the PAT and TAT as the repeated factor.
Aim 2. Aim 2 explored performance on the PAT social attribution and social evaluation