Outlier Detection and Removal Algorithm in K-Means
and Hierarchical Clustering
Anwesha Barai (Deb), Lopamudra Dey
*Department of Computer Science & Engineering, Heritage Institute of Technology, Kolkata, India
Copyright©2017 by authors, all rights reserved. Authors agree that this article remains permanently open access under the terms of the Creative Commons Attribution License 4.0 International License
Abstract
An outlier in a pattern is dissimilar with rest of the pattern in a dataset. Outlier detection is an important issue in data mining. It has been used to detect and remove anomalous objects from data. Outliers occur due to mechanical faults, changes in system behavior, fraudulent behavior, and human errors. This paper describes the methodology or detecting and removing outlier in K-Means and Hierarchical clustering. First apply clustering algorithm K-Means and Hierarchical clustering on a data set then find outliers from the each resulting clustering. In K-Means clustering outliers are found by distance based approach and cluster based approach. In case of hierarchical clustering, by using dendrogram outliers are found. The goal of the project is to detect the outlier and remove the outliers to make the clustering more reliable.Keywords
Outlier, Clustering, K-means, Hierarchical, Accuracy, Cophenetic Correlation Coefficient1. Introduction
Clustering is a process of detecting the similar object in some sense and make a cluster (group). This is very useful technique in data mining. The objects in same cluster are similar than the other objects. The main principal of clustering is to maximize the intra-cluster distance and minimize inter-cluster distance.
Outlier is very important research work in data mining field. Outlier occurs due to many reasons like human error, mechanical fault, changes in system behaviour, experimental error etc. An outlier is a pattern which is dissimilar with respect to the rest of the patterns in the dataset. Due to that outlier accuracy of clustering is minimized. In this project is to remove those outliers and maximize the accuracy of clustering. Here, we work on two types of clustering technique, K-means clustering and hierarchical clustering. In K-means outliers are detect and remove by two way
A. Distance based approach B. Cluster based approach
In distance based approach calculate the Euclidian distances of the object. Find out the threshold value for the
dataset. If threshold value is greater than the distance than this object is consider as outlier.
In cluster based approach find out smallest cluster and consider those objects in smallest cluster as outlier, it acts as a data reduction. Accuracy is improved after removing the outlier.
For hierarchical clustering outlier are found from dendrogram, find out the objects which are in those cluster and consider those as outlier. Here cophenet value is increased after removing outlier.
2. Related Work
There are two major clustering techniques:
Partitioning and Hierarchical: The partitioning clustering method seeks division of data objects into non- overlapping subsets such that each data object is in exactly one subset. In Hierarchical clustering a set of nested clusters organized as a hierarchical tree [11]. These two major clustering algorithms are described below.
2.1. K-Means Clustering Algorithm
K- Mean is most popular clustering algorithm. The main objective is to partitioning n objects into k number clusters, so that the inter cluster similarity is minimum and intra-cluster similarity is maximum [1].
Input:
K: no. of cluster
D: dataset containing n objects Method:
1. Arbitrarily choose k objects in D as the initial cluster centre.
2. Calculate the distance between each data point and cluster centers.
3. Assign the data point to the cluster centre whose distance from the cluster centre is the minimum of all the cluster centres.
4. When all the objects are placed recalculate the centroid k position.
Output: A set of k cluster.
2.2. Hierarchical Clustering Algorithm
A hierarchical method creates a hierarchical decomposition of the given set of data objects. Here tree of clusters called as dendrogram is built. It is the connectivity based clustering algorithms. The hierarchical algorithms build clusters gradually [11, 12].
There are two types of hierarchical clustering techniques: Agglomerative (which joins clusters in a hierarchical manner) and Divisive (which splits clusters hierarchically).
We work with Agglomerative process. The steps for Agglomerative process is discuss below
Assume each object to a separate cluster.
Calculate all pair-wise distances between clusters (Euclidian distance)
Now construct a distance matrix using the distance values.
Pair of clusters with the shortest distance.
Remove the pair from the matrix and merge them. Evaluate all distances from this new cluster to all
other clusters, and update the matrix.
Repeat until the distance matrix is reduced to a single element.
Cophenetic Correlation Coefficient: If the cluster is good then the linking of objects in the cluster tree should have a strong correlation with the distances between objects in the distance vector. The cophenent function compares these two sets of values and computes their correlation. This value is called the cophenetic correlation coefficient. The value is more accurate if it is nearer to 1.
3. Proposed Algorithm For Outlier
Removal in K-Means:
Outlier detection is very important issue in data mining. In my paper I proposed two method of detecting and removing of outlier in K-Means clustering.
A. Distance Based Algorithm:
In this approach we tend to find the outlier in three phases. Initially run k-means clustering algorithm to find k cluster. Calculate accuracy and silhouette index of K-means clustering.
1st phase: At first we have to find threshold value. For this calculate pairwise distance for whole dataset. Given an mx by n data matrix X, which is treated as mx (1 by n) row vectors x1, x2... xmx, and my-by-n data matrix Y, which is treated as
my (1-by-n) row vectors y1, y2...ymy, the various distances
between the vector xs and yt are defined as follows:
Euclidean distance
d2st= (xs−yt) (xs−yt) ′
Take maximum and minimum value of pairwise distance for all observation.
Threshold value = (maximum distance + minimum
distance) ÷ 2
2nd phase: Calculate Euclidian distance of all data in the dataset.
If distance> Threshold value this data is considered as outlier.
If distance ≤ Threshold value this data is not outlier. 3rd phase: In last phase after find out all outlier for particular dataset remove all of those data. Run K-means algorithm and recalculate accuracy. This time the accuracy and silhouette index must be improved.
B. Cluster Based Approach:
This method is quite easy. Run K-means clustering algorithm which divided the data into k number of cluster and calculate accuracy and silhouette index. Then It involve two phase only.
1st phase: At first we have to find which cluster is small. Here, we consider smallest cluster as outlier. It is assumed that they are very small in number or they are forced to belong to a cluster or they are very different from other.
2nd phase: In 2nd phase remove the small cluster as outlier. Run K-means and again calculate accuracy and silhouette index.
4. Proposed Algorithm for Outlier
Removal in Hierarchical Clustering
For outlier detection in Hierarchical Clustering, it depends on dendrogram; here we have to find Cophenetic
Correlation Coefficient for particular dataset after running the algorithm. The steps are discussed below
Run Hierarchical clustering algorithm and find out dendrogram and Cophenetic Correlation
Coefficient.
From dendrogram we can visualize which cluster is outer from other cluster.
Find those data which belong to this cluster and consider those as outlier.
Remove those data from dataset and again run Hierarchical algorithm.
Find Cophenetic Correlation Coefficient and it will be increased.
5. Experimental Result
We use MATLAB tools for implementing our algorithms. We conducted all experiments on a Windows 10
Home Premium with Intel® Core™ i3 4030UCPU @ 1.90 GHz with 4.00 GB RAM. Experiments were conducted in Matlab 7.8.0 (R200ba) on various data sets. Data is collected from UCI machine learning repository that provided various types of datasets. This dataset can be used for clustering, classification and regression.
Data_User_Modeling dataset and Wholesale Customers dataset
A.Results for Data_User_Modeling dataset: Data_User_Modeling dataset which has 259 instances and 5 attributes. The results of distance based and cluster based outlier removal in K-means clustering for this dataset given below.
Results of Distance based outlier removal in K-means clustering algorithm
In this section, we will investigate the effectiveness of our proposed approach when applied on bench marked data sets: Data_User_Modeling dataset which has 259instances and 5 attributes and Wholesale Customers dataset which has 440 instances and 7 attributes.
Data_User_Modeling_dataset
Data_User_Modeling dataset has 259 instances and 5 attributes.
5.1. Distance based outlier removal algorithm in K-MEANS clustering
Here, Distance based outlier removal algorithm is used for noise detection. After noise detection 36 data are detected as noise and Silhouette is increased.
Table 1. Results of Distance based outlier removal algorithm in K-MEANS clustering
Maximum distance 0.4256
Minimum distance 1.7625
Threshold Value 1.09405
Accuracy before outlier removal 0.6719
Silhouette before outlier 0.4064
Accuracy after outlier removal 0.6860
Silhouette after outlier 0.4110
After applying particular algorithm all results are listed in above table.
5.2. Cluster based outlier removal algorithm in K-MEANS clustering
[image:3.596.312.554.101.192.2]As discussed above, in this approach we consider smallest cluster as outlier. In model dataset smallest cluster is 2.Then consider all data in 2 number cluster as outlier. Remove those data from dataset.
Table 2. Results of Cluster based outlier removal algorithm in K-MEANS clustering
Silhouette before outlier removal 0.4064 Accuracy before outlier removal 0.6719
Silhouette after outlier 0.4226
Accuracy after outlier removal 0.7394
This is the result after applying this algorithm and silhouette and accuracy is increased.
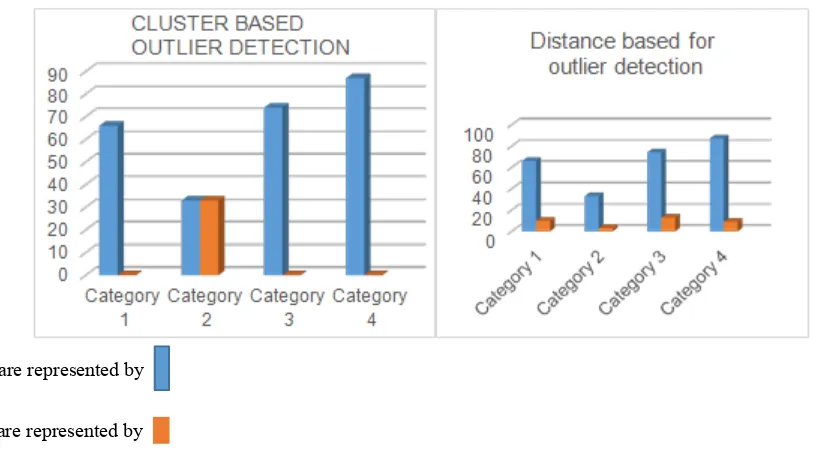
Cluster are represented by
Outlier are represented by
Figure 1. Graph representation of Cluster based and Distance based outlier removal algorithm in K-MEANS
Wholesale Customers data
[image:3.596.311.554.338.392.2] [image:3.596.94.501.450.675.2]5.3. Distance based outlier removal algorithm in K-MEANS clustering
Distance based outlier algorithm is applied on Wholesale customer dataset. In below table Accuracy and Silhouette is written before applying this algorithm and our aim is to increase Silhouette and accuracy. So, from the results mentioned in below table it is found that accuracy and Silhouette index is increased after applying our proposed method.
Table 3. Results of Distance based outlier removal algorithm in K-MEANS clustering
Maximum distance 0.7695
Minimum distance 0.0130
Threshold Value 0.39125
Accuracy before outlier removal 0.6938
Silhouette before outlier 0.6262
Accuracy after outlier removal 0.7058
Silhouette after outlier 0.6733
5.4 Cluster based outlier removal algorithm in K-MEANS clustering
In cluster based approach for this dataset take Region as cluster. So here is 3 clusters and smallest cluster is 2.So, consider cluster 2 has noisy data.
Table 4. Results of Cluster based outlier removal algorithm in K-MEAN Clustering
Silhouette before outlier removal 0.6492 Accuracy before outlier removal 0.5287
Silhouette after outlier 0.6649
Accuracy after outlier removal 0.5364
So, from above result it is found that Accuracy and Silhouette index is increased after outlier removal.
Cluster are represented by
Outlier are represented by
Figure 2. Graph representation of Cluster based and Distance based outlier removal algorithm in K-MEANS clustering in Wholesale customer dataset
5.5. Results of outlier removal in hierarchical clustering:
Dendrogram is a graphical presentation. By visualizing dendrogram find out which cluster is outlier and remove this. Here is the dendrogram before and after outlier removal.
[image:4.595.60.511.202.562.2]Figure 3. Graph representation of outlier removal in hierarchical clustering on Data_User_Modeling dataset
[image:5.595.64.526.435.672.2]From above dendrogram we can detect outliers are 26, 27, 28 number instances.
Table 5. Results of outlier removal in hierarchical clustering for Data_User_Modeling dataset
Cophenetic Correlation Coefficient before outlier removal 0.4214
Silhouette value before outlier removal 0.4114
Cophenetic Correlation Coefficient after outlier removal 0.4392
Silhouette value after outlier removal 0.4292
Silhouette index and Cophenetic Correlation Coefficient is increased after applying our proposed algorithm
.
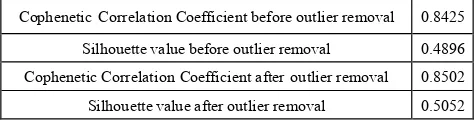
Wholesale Customers data: Wholesale Customers dataset which has 440 instances and 7 attributes. [image:5.595.346.524.483.657.2]Table 6. Results of outlier removal in hierarchical clustering for Wholesale Customers dataset
Cophenetic Correlation Coefficient before outlier removal 0.8425 Silhouette value before outlier removal 0.4896 Cophenetic Correlation Coefficient after outlier removal 0.8502 Silhouette value after outlier removal 0.5052
So, from above report we can give a conclusion that after outlier removal Cophenetic Correlation coefficient and silhouette index is increased.
6. Applications of Outlier Detection
Medical issue: Patient medical record contain all test result regarding health issue, lab result etc. So, outlier detection techniques can be used to detect abnormal patterns in health records and this contributing to better data and better knowledge in the process of decision making.[7] Fraud detection: Outlier detection help to detect any unusual behavior of credit card.[8]
Sports statistic: In many sports, various parameters are recorded for players in order to evaluate the players’ performances.
Detecting measurement error: Data derived from sensors e.g. given in scientific experiment may contain measurement errors.
Abnormal values could provide an indication of a measurement error. Removing such errors can be important in other data mining and data analysis tasks. One person‘s noise could be another person‘s signal [3].7. Conclusions
In this paper we presented outlier detection method in both K-Means and Hierarchical Clustering. To remove outlier is an important task. We proposed algorithms by which we can remove outliers. We work on benchmark dataset and after implementing our proposed algorithm it is proved that our proposed algorithm is more efficient than previous one. After removing the outliers’ accuracy are increased. The approach needs to be implemented on more complex datasets. Future work requires approach applicable for varying datasets.
REFERENCES
[1] Yadav, Jyoti, and Monika Sharma. "A Review of K-mean Algorithm." International Journal of Engineering Trends and Technology (IJETT)–Volume4 (2013).
[2] Pachgade, Ms SD, and Ms SS Dhande. "Outlier detection over data set using cluster-based and distance-based approach."
International Journal of Advanced Research in Computer Science and Software Engineering 2.6 (2012): 12-16. [3] Maimon, Oded, and LiorRokach, eds. Data mining and
knowledge discovery handbook. Vol. 2. New York: Springer, 2005.
[4] Loureiro, Antonio, Luis Torgo, and Carlos Soares. "Outlier detection using clustering methods: a data cleaning application." Proceedings of KDNet Symposium on Knowledge-based Systems for the Public Sector. Bonn, Germany. 2004.
[5] Gaspar, Juliano, et al. "A Systematic Review of Outliers Detection Techniques in Medical Data-Preliminary Study."
HEALTHINF. 2011.
[6] Hautamäki, Ville, et al. "Improving k-means by outlier removal." Image Analysis. Springer Berlin Heidelberg, 2005. 978-987.
[7] Morrison, Alistair, Greg Ross, and Matthew Chalmers. "Combining and comparing clustering and layout algorithms." (2003).
[8] Christy, A., G. Meera Gandhi, and S. Vaithyasubramanian. "Cluster Based Outlier Detection Algorithm for Healthcare Data." Procedia Computer Science 50 (2015): 209-215. [9] Jayakumar, G. D. S., and Bejoy John Thomas. "A new
procedure of clustering based on multivariate outlier detection." Journal of Data Science11.1 (2013): 69-84. [10] Christopher, T., and T. Divya. "A Study of Clustering Based
Algorithm for Outlier Detection in Data streams."
Proceedings of the UGC Sponsored National Conference on Advanced Networking and Applications. 2015.
[11] Dey, L. and Mukhopadhyay, A., 2009. Microarray gene expression data clustering using PSO based K-means algorithm. UACEE International Journal of Computer Science and its Applications, 1(1), pp.232-236.
[12] Dey, L. and Chakraborty, S., 2014. Canonical PSO Based-Means Clustering Approach for Real Datasets.
[image:6.595.59.296.107.169.2]