Georgia State University
ScholarWorks @ Georgia State University
Public Health Theses School of Public Health
Spring 5-13-2016
Pepper Mild Mottle Virus as an Indicator of Fecal
Pollution along an Urban Stretch of the
Chattahoochee River in Atlanta, GA, 2014
Darian Morgan
Follow this and additional works at:https://scholarworks.gsu.edu/iph_theses
This Thesis is brought to you for free and open access by the School of Public Health at ScholarWorks @ Georgia State University. It has been accepted for inclusion in Public Health Theses by an authorized administrator of ScholarWorks @ Georgia State University. For more information, please contact [email protected].
Recommended Citation
Morgan, Darian, "Pepper Mild Mottle Virus as an Indicator of Fecal Pollution along an Urban Stretch of the Chattahoochee River in Atlanta, GA, 2014." Thesis, Georgia State University, 2016.
Pepper Mild Mottle Virus as an Indicator of Fecal Pollution along an Urban Stretch of the Chattahoochee River in Atlanta, GA, 2014
By
Darian C Morgan
B.S., Tuskegee University, 2012
Thesis Submitted to the Graduate Faculty of Georgia State University in Partial Fulfillment of the Requirements for the Degree
MASTER OF PUBLIC HEALTH ATLANTA, GEORGIA
2
Abstract
The Chattahoochee River is an essential surface water source as it provides over 70 percent of Metro Atlanta’s drinking water, amounting to over 300 million gallons. In addition to serving as Metro Atlanta’s primary source of drinking water, the Chattahoochee River serves as a major point of discharge for industrial and municipal waste as well as urban runoff.
The primary goal of this study was to assess the presence of Pepper Mild Mottle Virus in the Chattahoochee River. During a five-month period in 2014, water samples were collected at fifteen sample sites and two outfall sites in the Chattahoochee River. PMMoV was tested for in 6 out of 17 samples. A one-way ANOVA analysis (p<0.05), of concentrations across sampling locations resulted in a p-value of 0.044. As a result, it can be determined that the location of the sampling sites does result in a statistically significant difference in the PMMoV values observed. Furthermore, a one-way ANOVA analysis (p<0.05), of concentrations across sampling dates resulted in a p-value of 0.063. Therefore, it is determined that the dates on which sampling took place did not result in a statistically significant difference in the PMMoV values observed across time. Furthermore, the MS2 virus was also detected in these samples. Through a paired t-test (p<0.05), between the sample concentrations with and without MS2 presence, it was determined that there was no statistical difference in concentration of PMMoV when MS2 is present since p=0.0740
The results indicate that PMMoV was present in the Chattahoochee River due to the detection of PMMoV in the samples collected. However, additional investigations, using a larger sample size, are needed to assess PMMoV as a viable indicator of fecal contamination of ambient surface waters and recreational waters.
3
Acknowledgements
First, I would like to thank God for giving me the faith, knowledge, and strength to complete this process.
Multiple gratitudes to all the faculty and staff of the Georgia State University’s School of Public Health that have contributed to my matriculation throughout the program. I would like to especially thank my committee members, Dr. Casanova and Dr. Stauber, for their contributions to this project and their encouragement and enlightenment on various topics of environmental health throughout this process as well as through my matriculation throughout the public health program.
Also thank you to my family, friends, and colleagues for their never ending love, support, and prayers during this process.
4
AUTHOR’S STATEMENT
In presenting this thesis as a partial fulfillment of the requirements for an advanced degree from Georgia State University, I agree that the Library of the University shall make it available for inspection and circulation in accordance with its regulations governing materials of this type. I agree that permission to quote from, to copy from, or to publish this thesis may be granted by the author or, in her absence, by the professor under whose direction it was written, or in his/her absence, by the Associate Dean, School of Public Health. Such quoting, copying, or publishing must be solely for scholarly purposes and will not involve potential financial gain. It is understood that any copying from or publication of this dissertation which involves potential financial gain will not be allowed without written permission of the author.
Darian Morgan
5
Table of Contents
Abstract………...2
Acknowledgements………...3
Author’s Statement...4
List of Tables………...6
List of Figures………...7
List of Maps………...8
Approval Page...9
Notice to Borrower’s Page...10
Chapter I- Introduction………...11
Background ...11
Purpose of the Study...15
Research Questions...16
Chapter II- Review of the Literature………...17
Chapter III- Methods………...29
Site Description………...29
Sample Collection………...30
Detection of PMMoV………...31
Statistical Analyses………...31
Chapter IV- Results………...22
Chapter V- Discussion………...38
Importance of Study………...38
Major Findings………......39
Strengths and Limitations………...42
Future Research...………....42
6
List of Tables
Table 1: Sampling Results from the Chattahoochee River by site and date, Atlanta Georgia,
2013...………...………...33
Table 2: One-Way ANOVA Analysis of selected Water quality variables from the Chattahoochee River by
site Atlanta, Georgia, 2013
...………….………...35
Table 3: One-Way ANOVA Analysis of selected Water quality variables from the Chattahoochee River by
Date, Atlanta, Georgia, 2013
...……….………...……...35
Table 4 MS2 Sampling Results for Chattahoochee River, Atlanta, Georgia 2014
...36
Table 5. Paired T-Test Analysis of selected Water Quality Variables from the Chattahoochee River by site,
Atlanta, GA, 2013...37
Table 6. Paired T-Test Analysis of selected Water Quality Variables from the Chattahoochee River by site,
7
List of Figures
Figure 1. Chattahoochee River Sampling Results PMMoV Concentration vs. Site
8
List of Maps
9
Approval Page
Approved:
Dr. Lisa Casanova
Committee Chair
Dr. Christine Stauber
Committee Member
10
Notice to Borrowers Page
All theses deposited in the Georgia State University Library must be used in accordance with the stipulations prescribed by the author in the preceding statement
The author of this thesis is: Darian C. Morgan
Student’s Name: Darian C. Morgan
Street Address: 6204 Peachtree Creek Circle
City, State, and Zip Code: Atlanta, Georgia 30341
The Chair of the committee for this thesis is: Dr. Lisa Casanova
Professor’s Name: Dr. Christine Stauber
Department:
Institute of Public Health
College:
School of Public Health
Georgia State University
P.O. Box 3995
Atlanta, Georgia 30302
Users of this thesis who are not regularly enrolled as students at Georgia State University are required to attest acceptance of the preceding stipulations by signing below. Libraries borrowing this thesis for the use of their patrons are required to see that each user records here the information requested.
NAME OF USER Address Date Type of Use
11
Chapter I
INTRODUCTION
1.1 Background
The Chattahoochee River originates from the Blue Ridge Mountains of Georgia and flows southward into Florida, forming a natural border between Georgia and Alabama. The Chattahoochee River is the most heavily used water resource in Georgia (EPD, 1997).Furthermore, the Chattahoochee River is an essential surface water source for the metro Atlanta area as it provides over 70 percent of the city's drinking water, amounting to over 300 million gallons (EPD, 1997). In addition to serving as Metro Atlanta's primary source of drinking water, the Chattahoochee River acts as a major point of discharge for industrial and municipal waste as well as urban runoff. Due to Metropolitan Atlanta's dependence on the Chattahoochee River as both a source of drinking water and a site for waste discharge, both monitoring and maintaining the integrity of the river's surface water is of vital importance.
12
2010. With a consistently increasing stream of new residents each year, the amount of sewage flowing into the city and surrounding areas sewage systems began to grow as well. Despite the increase in economic vitality as a result of the city's population growth, the need for environmental overhauls on the Atlanta sewage system has grown more urgent. In the late 1880s, sanitary sewers were built for residents of the city but as expected have started to break and crack. An improved system was designed and installed to carry storm water and household waste. However, that system has degraded due to population growth. The sanitary sewer system becomes overburdened, leading to sanitary sewer overflow (SSO) events. During these events, a mixture of groundwater, untreated sewage, and stormwater overflow can find its way into streams and creeks through dilapidated pipes and manholes. (History, 2010; Perkins, 2014; and Smith, 2015). According to Clean Water Atlanta, in 1998 Atlanta entered into a Consent Decree. The consent decree included a directive to evaluate and implement short and long-term plans for eliminating water quality violations for the city of Atlanta. Currently, the City of Atlanta is under two consent decrees resulting from lawsuits against the City filed by several constituents including the Upper Chattahoochee Riverkeeper and later joined by EPA and EPD. Today the city is under a combined sewer overflow (CSO) remediation plan. (History, 2010)
13
Clean Water Act, Safe Drinking Water Act, and the State Water Quality Control Act were enforced to protect the Chattahoochee River's water quality. This policy implemented the defining and monitoring of definitive water quality standards for the health of the public (EPD, 1997). The City of Atlanta and the Federal Government agreed to a monetary settlement and to take corrective action to bring the sewer system into compliance with the Clean Water Act and the Georgia Water Quality Control Act. A Consent Decree created the objective of eliminating future water quality violations from sanitary sewer overflows. This Consent Decree encompassed improving the cities' Water Reclamation Centers (WRCs), investigating sewer pipe conditions, as well as ending water quality violations resulting from CSOs. Specifically, one of the primary goals of the Consent Decree was to improve the current water quality conditions in the receiving waters downstream of the city, mainly the Chattahoochee River, by improving the water quality of the effluent discharging from the WRCs located around the city (Overview, 2010).
14
city's total separated area from 85% to about 90% while eliminating two CSO facilities. The FACD also calls for the construction of deep-rock tunnel storage and treatment systems that will capture and store combined stormwater. This stormwater will be treated at two CSO facilities, before being discharged into the Chattahoochee River. The city of Atlanta hopes the number of overflows is reduced from 60+ per year to only 4 per year at the four facilities that will remain after the changes have been implemented. Any remaining overflows will be screened, disinfected, and dechlorinated before being discharged to a receiving stream. These changes should allow for the water quality standards to be met.
15
impervious surfaces prevent rainfall from infiltrating the ground, resulting in increased stormwater runoff, flooding, and stream bank erosion. Due to the importance of the Chattahoochee River, effective methods for monitoring the quality of river water are needed.
1.2 Purpose of the Study
16
River is a designated local, state, and federal waterway of interest, along with being a recreational waterway, no studies have been conducted to assess the presence of PMMoV and evaluate its contribution to the water quality of the Chattahoochee River and other surface waters.
1.3 Research Questions:
Are there any spatial or temporal variations in concentration of PMMoV along the Chattahoochee River?
Is there any correlation between the presence of bacteriophage MS2 and PMMoV concentrations?
17
Chapter II
Review of Literature
2.1 Urbanization
The surface water of an area is essential to the life and vitality of its surrounding communities. Due to this fact, numerous studies have been conducted globally to examine the effects of urbanization on surface waters, and also to identify and develop trends that can be used in predicting contaminant concentration in that body of water. Water reaches human consumption through various pathways, usually beginning with collection from ground or surface water source, and then treated through several filtration methods at municipal treatment plants .After treatment, that water is supplied to the public for public consumption.
18
those who are responsible for making illegal discharges into the rivers. Without consistent monitoring, surface waters in high population density areas face a grim outlook. The Dianchi Lake Basin, located in Kunming City, China, is an area with a dense population and developed economy supported by an assortment of intensive human activities. With the predominantly high usage of water resources and minimal inflow of clean water, Dianchi Lake is presently facing a potential water crisis due to pollution. Several initiatives since 1986 focused on pollution control of the Dianchi Lake basin, however due to the heavy population burden and pollution loading these efforts have been unsuccessful. (Liu et al. 2015)
19
population benefit from the increased industrial opportunities. Industrial development provides such benefits as a potentially improved quality of life, transportation convenience through the building of highway infrastructure, new career opportunities, and access to resources that are not as easily attained by those living in rural communities (Sallis, 2009)
20
developed watersheds. (DiDonato et al., 2009; Perkins, 2014). This result displays the strong correlation for increased contamination among urban watersheds in comparison to other bodies of water due to impervious surfaces characteristic of urban environments. Impervious surface coverage has been considered a quantifiable land-use indicator that correlates closely with polluted runoff. (Arnold & Gibbons, 1996) Furthermore, due to the results of the study, there is also the potential to forecast indicator concentrations under land use change scenarios.
2.2 Weather Pattern Trends and Stormwater Runoff
21
sewer systems, are especially relevant due to them containing a mixture of contaminants such industrial wastewater, urban surface runoff, domestic wastewater and sewer deposits. Discharges from separate systems include mainly the runoff from urban surfaces, resulting in fewer pollutants (Suárez and Puertas 2005). This finding explains why CSOs receive the majority of the blame for damaging water quality in receiving waters.
22
role in cadmium loading but was a minor factor in contributing cadmium and iron. Automobiles were also found to be a source of heavy metals to the environment. The study found that emissions from the wear of brakes contained copper while tire wear contributed zinc. Oil leakage from automobiles added a minor amount of all the four metals. (Davis, 2001).
23
indicator bacteria, measurement methods, and population setting, Kostyla, 2015). A study of the Newport River Estuary yielded similar results. Despite seasonal variations, the data revealed a significant increase in fecal coliform concentrations after measured rainfall amounts of 2.54 cm (Coulliette & Noble, 2008).
24
correlation found between the flow rate and the levels of fecal coliforms in the water. Moreover, fecal concentrations were determined to be less under flowing conditions in comparison to fecal concentration levels under nonflowing conditions (Chase et. al., 2012)
25 2.3 Fecal Contamination:
26
(total coliforms (TCs)), fecal or thermotolerant coliforms, Escherichia coli, enterococci (fecal streptococci or intestinal enterococci) and bacteriophages.
Sources of fecal contamination can vary from location to location. Fecal contamination is a serious concern for managers of water resources, due to the easy accessibility of pathogens from the urban environment entering watersheds through various pathways. For examples, some of the pathways include the discharge of inadequately treated sewage or wastewater effluent, storm water runoff, CSOs, and SSOs (Arnone, 2007). Furthermore, the processes implemented at wastewater treatment facilities to remediate wastewater are not entirely capable of eliminating the pathogenic organisms found in wastewater, allowing for the discharging of microorganisms to into the surface water. Additionally, the discharge of any domestic sewage can lead to the contamination of groundwater, causing public health concern.
27
do not reflect the presence of pathogen contamination with complete certainty (Arnone, 2007),
28
29
CHAPTER III
METHODS
3.1 River Sample Site Description
Fifteen locations were designated as water sample collection sites along fourteen-miles of the Chattahoochee River with each collection site approximately one mile apart.
Map 1: Chattahoochee River Sample Sites
30 3.2 Sample Collection: Chattahoochee River
31 3.3 Detection of PMMoV
Detection of PMMoV was performed at the University of Arizona according to the method of Quantitative Polymerase Chain Reaction analysis using TaqMan-based qPCR assays for viruses were performed with a LightCycler® 480 Real-Time PCR Instrument II (Kitajima, 2014).
3.4 Statistical Analyses
32
CHAPTER IV
RESULTS
4.1 Chattahoochee River
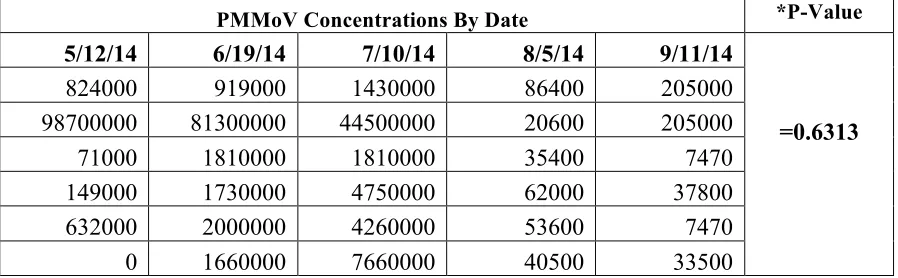
As shown in Table 1, the sampling results for the investigations varied across sampling sites and dates. A one-way ANOVA analysis (p<0.05), as shown in Table 2, of concentrations across sampling locations, resulted in a value of 0.044 This resulting p-value (p=0.044) was not higher than the test p-value of p<0.05. As a result, it can be determined that the location of the sampling sites does result in a statistically significant difference in the PMMoV values observed. Furthermore, a one-way ANOVA analysis (p<0.05), of concentrations across sampling dates, led to a p-value of 0.063 (Table 3). The resulting p-value of 0.06313 was higher than the test value of p<0.05 therefore, indicating that the dates on which sampling took place did not result in a statistically significant difference in the PMMoV values observed across time.
33
[image:34.612.85.487.252.443.2]surrounding the outfall and not directly from the outfall itself, possibly explaining the lower concentrations. It is notable that PMMoV was found both upstream and downstream of each outfall. The average PMMoV concentration was higher downstream of the outfall than upstream.
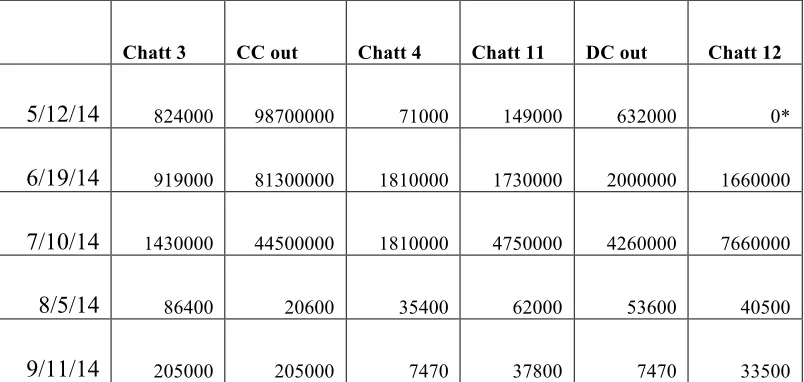
Table 1: PMMoV Sampling Results from the Chattahoochee River by Site and Date, Atlanta Georgia, 2013
Chatt 3 CC out Chatt 4 Chatt 11 DC out Chatt 12
5/12/14 824000 98700000 71000 149000 632000 0*
6/19/14 919000 81300000 1810000 1730000 2000000 1660000
7/10/14 1430000 44500000 1810000 4750000 4260000 7660000
8/5/14 86400 20600 35400 62000 53600 40500
9/11/14 205000 205000 7470 37800 7470 33500 *Concentration values in copies/L
34
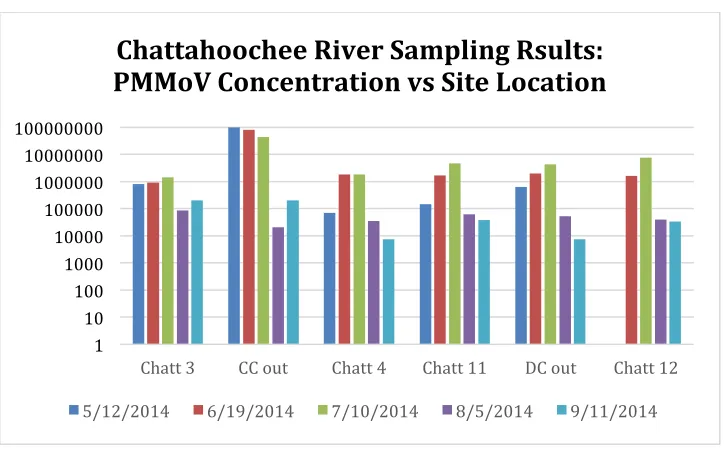
[image:35.612.90.454.205.430.2]Figure 1. Chattahoochee River Sampling Results PMMoV Concentration vs. Site Location
Table 2: One-Way ANOVA Analysis of selected Water quality variables from the Chattahoochee River by site Atlanta, Georgia, 2013
* level of significance reported as p<.05 *Concentration values in copies/L * Average concentrations per site
1 10 100 1000 10000 100000 1000000 10000000 100000000
Chatt 3 CC out Chatt 4 Chatt 11 DC out Chatt 12
Chattahoochee River Sampling Rsults:
PMMoV Concentration vs Site Location
5/12/2014 6/19/2014 7/10/2014 8/5/2014 9/11/2014
PMMoV Concentrations By Site
* P-Value
Chatt 3 CC out Chatt 4 Chatt 11 DC out Chatt 12
=0.0044
824000 98700000 71000 149000 632000 0
919000 81300000 1810000 1730000 2000000 1660000 1430000 44500000 1810000 4750000 4260000 7660000
86400 20600 35400 62000 53600 40500
205000 205000 7470 37800 7470 33500
[image:35.612.79.478.485.617.2]35
Table 3: One-Way ANOVA Analysis of selected Water quality variables from the Chattahoochee River by Date, Atlanta, Georgia, 2013
PMMoV Concentrations By Date *P-Value
5/12/14 6/19/14 7/10/14 8/5/14 9/11/14
=0.6313
824000 919000 1430000 86400 205000 98700000 81300000 44500000 20600 205000 71000 1810000 1810000 35400 7470 149000 1730000 4750000 62000 37800 632000 2000000 4260000 53600 7470 0 1660000 7660000 40500 33500
36
[image:37.612.81.514.279.413.2]Bacteriophage MS2 is a potential indicator of the presence of human viruses in water, As shown in Table 4, MS2 was found in 19 out of 30 sample collections from the aforementioned sites. No statistical significance could be drawn from just those results. However, via a paired t-test,(p<0.05), between the sample concentrations with and without MS2 presence, it was determined that there was no statistical difference in concentration of PMMoV when MS2 is present since p=0.0740.
Table 4 MS2 Sampling Results for Chattahoochee River, Atlanta, Georgia 2014
*Presence
MS2 by Site 5/12/14 6/19/14 7/10/14 8/5/14 9/11/14
*P-Value
Chatt #3 + - + + +
Chatt #4 + - + + + P=0.740
Chatt #11 + - - + +
Chatt#12 + - + + +
CC Out
(#16) - - - + +
DC Out
(#17) - - - + +
* t-test with level of significance reported as p<.05
* +/- = Presence of MS2 in Sample for Site
37
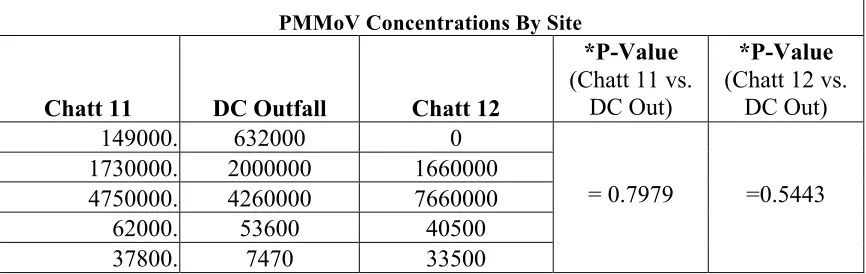
[image:38.612.90.523.280.423.2]determined that there were no statistically significant differences between the concentrations of PMMoV found upstream (Chatt 3) the Camp Creek Outfall or downstream (Chatt 4) the Camp Creek Outfall. Furthermore, through paired t-test (Table 6) it was determined that there were no statistically significant differences between the concentrations of PMMoV found upstream (Chatt 11) the Douglas County Outfall or downstream (Chatt 12) the Douglas County Outfall.
Table 5. Paired T-Test Analysis of selected Water Quality Variables from the Chattahoochee River by site, Atlanta, GA, 2013
PMMoV Concentrations By Site
Chatt 3 CC Outfall Chatt 4
*P-Value
(Chatt 3 vs. CC Out)
*P-Value
(Chatt 4 vs. CC Out) 824000. 98,700,000 71000
= 0.0928 =0.0931 919000. 81,300,000 1810000
1430000. 44,500,000 1810000 86400. 20600 35400 205000. 205000 747
*t-test with level of significance reported as p<.05 *Concentration values in copies/L
Table 6. Paired T-Test Analysis of selected Water Quality Variables from the Chattahoochee River by site, Atlanta, GA, 2013
PMMoV Concentrations By Site
Chatt 11 DC Outfall Chatt 12
*P-Value
(Chatt 11 vs. DC Out)
*P-Value
(Chatt 12 vs. DC Out) 149000. 632000 0
= 0.7979 =0.5443 1730000. 2000000 1660000
4750000. 4260000 7660000 62000. 53600 40500 37800. 7470 33500
[image:38.612.90.523.495.632.2]38
CHAPTER V
DISCUSSION
5.1 Importance of Study
39
since other viral indicators depend on the degree of infection in the population and the release of the virus into the wastewater system at any given time (Rosario, et al. 2009). Therefore there can be some variability and inconsistency when using a human enteric virus. There is a lack of published investigations on the use of the PMMoV as a viable indicator of fecal contamination in surface waters. This research also opens the opportunity for investigation into whether there is any correlation to the presence of MS2 and PMMoV in surface waters.
5.2 Major Findings
40
previously mentioned conducted in other areas around the region and country.. Further investigation would be needed to explain the high concentration at this specific sampling point on all sample dates, relative to all the other sampling points.
41
contamination could range from human recreational pollution to the antiquated sewer system used by the City of Atlanta for CSOs, which contaminate this waterway. There could be other possible non-point sources of pollution. However, since PMMoV is found in fecal contamination, the CSOs may be the leading factor in finding PMMoV upstream of the outfalls. PMMoV is considered very stable in the environment but more information on its persistence is needed,
42
5.3 Strengths and Limitations
Strengths
To date, there are no studies investigating the current water quality, the presence of PMMoV, and the correlation between the presence of MS2 and PMMoV in the Chattahoochee River.
Limitations
This research is comprised of a tiny sample size from the Chattahoochee River, making it difficult to make assumptions and apply them to a larger scale. PMMoV was only present in 6 of 17 samples taken from the Chattahoochee River from May to September. Sampling methods also varied due to several factors.
5.4 Future Research
43
REFERENCES
Arnold Jr, C. Gibbons, J. (1996): Impervious Surface Coverage: The Emergence of a Key Environmental Indicator, Journal of the American Planning Association, 62:2, 243-258
Arnone, R., & Walling, J. (2007). Waterborne pathogens in urban watersheds. Journal
of Water and Health, 5(1), 149-162.
Astrom, J., Pettersson, T. J., & Stenstrom, T. A. (2007). Identification and management of microbial contaminations in a surface drinking water source. J Water Health, , 67-79. doi: 10.2166/wh.2007.137
Balmforth, D. (1990). Aesthetic pollutant modeling. Paper presented at the Proc., Wastewater Planners Users Group Conf.
Bougeard, M., Le Saux, J.-C., Teillon, A., Belloir, J., Le Mennec, C., Thome, S., . . . Pommepuy, M. (2011). Combining modeling and monitoring to study fecal contamination in a small rural catchment. Journal of Water and Health, 9(3), 467-482.
Boyacioglu, H., & Boyacioglu, H. (2010). Detection of seasonal variations in surface water quality using discriminant analysis. Environmental monitoring and
assessment, 162(1-4), 15-20.
Carpenter, S. R., Caraco, N. F., Correll, D. L., Howarth, R. W., Sharpley, A. N., & Smith, V. H. (1998). NONPOINT POLLUTION OF SURFACE WATERS WITH PHOSPHORUS AND NITROGEN. Ecological Applications, 8(3), 559-568. doi: 10.1890/1051-0761(1998)008[0559:NPOSWW]2.0.CO;2
Chase, E., Hunting, J., Staley, C., & Harwood, V. J. (2012). Microbial source tracking to identify human and ruminant sources of faecal pollution in an ephemeral Florida river. J Appl Microbiol, 113(6), 1396-1406. doi: 10.1111/jam.12007
44
Davis, A. P., Shokouhian, M., & Ni, S. (2001). Loading estimates of lead, copper, cadmium, and zinc in urban runoff from specific sources. Chemosphere, 44(5), 997-1009. doi: http://dx.doi.org/10.1016/S0045-6535(00)00561-0
DiDonato, G. T., Stewart, J. R., Sanger, D. M., Robinson, B. J., Thompson, B. C., Holland, A.F., & Van Dolah, R. F. (2009). Effects of changing land use on the microbial water quality of tidal creeks. Mar Pollut Bull, 58(1), 97-106. doi: 10.1016/j.marpolbul.2008.08.019
Eriksson, E., Baun, A., Scholes, L., Ledin, A., Ahlman, S., Revitt, M., . . . Mikkelsen, P. S. (2007). Selected stormwater priority pollutants—a European perspective.
Science of The Total Environment, 383(1), 41-51.
EPA (1999). US, Georgia, and Atlanta Reach Settlement to Fix City’s Aging Sewer
System. Retrieved January 12, 2016
http://yosemite.epa.gov/opa/admpress.nsf/016bcfb1deb9fecd85256aca00 5d74df/1d9bf67474410410852567bd0073d60c!OpenDocument
EPD, Environmental Protection Division. (1997). Chattahoochee River Basin
Management Plan 1997. Retrieved January 12, 2016 from
http://www.gaepd.org/Documents/chatt.html.
Fletcher, T. D., Vietz, G., & Walsh, C. J. (2014). Protection of stream ecosystems from urban stormwater runoff: The multiple benefits of an ecohydrological approach.
Progress in Physical Geography, 38(5), 543.
Gasperi, J., Garnaud, S., Rocher, V., & Moilleron, R. (2008). Priority pollutants in wastewater and combined sewer overflow. Science of The Total Environment, 407(1), 263-272.
45
Haramoto, E., Kitajima, M., Kishida, N., Konno, Y., Katayama, H., Asami, M., & Akiba, M. (2013). Occurrence of pepper mild mottle virus in drinking water sources in Japan. Applied and environmental microbiology, 79(23), 7413-7418.
Hata, A., Katayama, H., Kojima, K., Sano, S., Kasuga, I., Kitajima, M., & Furumai, H. (2014). Effects of rainfall events on the occurrence and detection efficiency of viruses in river water impacted by combined sewer overflows. Science of The
Total Environment, 468–469, 757-763.
History. (2010). Retrieved January 12, 2016, from
http://www.cleanwateratlanta.org/overview/History.htm
Hörman, A., Rimhanen-Finne, R., Maunula, L., von Bonsdorff, C.-H., Torvela, N., Heikinheimo, A., & Hänninen, M.-L. (2004). Campylobacter spp., Giardia spp., Cryptosporidium spp., noroviruses, and indicator organisms in surface water in southwestern Finland, 2000-2001. Applied and environmental microbiology, 70(1), 87-95.
Kitajima, M., Iker, B. C., Pepper, I. L., & Gerba, C. P. (2014). Relative abundance and treatment reduction of viruses during wastewater treatment processes— Identification of potential viral indicators. Science of The Total Environment, 488, 290-296.
Kostyla, C., Bain, R., Cronk, R., & Bartram, J. (2015). Seasonal variation of fecal contamination in drinking water sources in developing countries: A systematic review. Science of The Total Environment, 514, 333-343.
Kundis Craig, R., & Roberts, A. M. (2015). When Will Governments Regulate Nonpoint Source Pollution? A Comparative Perspective. Boston College
Environmental Affairs Law Review, 42(1), 1-64.
46
Lee, N. M., & Welander, T. (1996). Reducing sludge production in aerobic wastewater treatment through manipulation of the ecosystem. water research, 30(8), 1781-1790.
Lee, J. H., & Bang, K. W. (2000). Ch4 Lee, N. M., & Welander, T. (1996). Reducing sludge production in aerobic wastewater treatment through manipulation of the ecosystem. water research, 30(8), 1781-1790. Characterization of urban stormwater runoff. water research, 34(6), 1773-1780.
Liu, W., Wang, S., Zhang, L., & Ni, Z. (2015). Water pollution characteristics of Dianchi Lake and the course of protection and pollution management.
Environmental Earth Sciences, 74(5), 3767-3780. doi:
10.1007/s12665-015-4152-x
Luther, K., & Fujioka, R. (2004). Usefulness of monitoring tropical streams for male-specific RNA coliphages. J Water Health, 2, 171-181.
McCarthy, D. T., Hathaway, J. M., Hunt, W. F., & Deletic, A. (2012). Intra-event variability of Escherichia coli and total suspended solids in urban stormwater runoff. water research, 46, 6661-6670.
Oişte, A. (2014). Groundwater quality assessment in urban environment.
International Journal of Environmental Science and Technology, 11(7),
2095-2102.
Overview. (2010). Retrieved January 12, 2016, from
http://www.cleanwateratlanta.org/consentdecree/overview.htm
Pauchard, A., Aguayo, M., Peña, E., & Urrutia, R. (2006). Multiple effects of urbanization on the biodiversity of developing countries: the case of a fast-growing metropolitan area (Concepción, Chile). Biological conservation, 127(3), 272-281.
47
Perlman, H. 2014 Chattahoochee River BacteriAlert Program. Retrieved January 12, 2016, from http://ga2.er.usgs.gov/bacteria/
Peters, N. E. (2009). Effects of urbanization on stream water quality in the city of Atlanta, Georgia, USA. Hydrological Processes, 23(20), 2860-2878.
Rajal, V. B., McSwain, B. S., Thompson, D. E., Leutenegger, C. M., Kildare, B. J., & Wuertz, S. (2007). Validation of hollow fiber ultrafiltration and real-time PCR using bacteriophage PP7 as surrogate for the quantification of viruses from water samples. water research, 41(7), 1411-1422.
Rosario, K., Symonds, E. M., Sinigalliano, C., Stewart, J., & Breitbart, M. (2009). Pepper mild mottle virus as an indicator of fecal pollution. Applied and
environmental microbiology, 75(22), 7261-7267.
Sallis, J. F. (2009). Measuring physical activity environments: a brief history.
American journal of preventive medicine, 36(4), S86-S92.
Sauer, E. P., VandeWalle, J. L., Bootsma, M. J., & McLellan, S. L. (2011). Detection of the human specific Bacteroides genetic marker provides evidence of widespread sewage contamination of stormwater in the urban environment. water research, 45(14), 4081-4091.
Saxena, G., Naresh Bharagava, R., Kaithwas, G., & Raj, A. (2015). Microbial indicators, pathogens and methods for their monitoring in water environment. Journal of
Water & Health, 13(2), 319-339. doi: 10.2166/wh.2014.275
Suárez, J., & Puertas, J. (2005). Determination of COD, BOD, and suspended solids loads during combined sewer overflow (CSO) events in some combined catchments in Spain. Ecological Engineering, 24, 199-217. doi: 10.1016/j.ecoleng.2004.11.005
48
Tayan Ç, M., & Toros, H. (1997). Urbanization effects on regional climate change in the case of four large cities of turkey. Climatic Change, 35(4), 501-524. doi: 10.1023/A:1005357915441
Thurston, H. W., Goddard, H. C., Szlag, D., & Lemberg, B. (2003). Controlling storm-water runoff with tradable allowances for impervious surfaces. Journal of Water
Resources Planning and Management.
Uttara, S., Bhuvandas, N., & Aggarwal, V. (2012). Impacts of Urbanization on environment. International Journal of Research in Engineering and Applied
Sciences, 2, 1637-1645.
Verhille, S. (2013). Understanding microbial indicators for drinking water assessment: interpretation of test results and public health significance. National
Collaborating Centre for Environmental Health.
Wang, W., Ju, T., Dong, W., Liu, X., Yang, C., Wang, Y., . . . Wang, H. (2015). Analysis of Nonpoint Source Pollution and Water Environmental Quality Variation Trends in the Nansi Lake Basin from 2002 to 2012. Journal of Chemistry, 2015.