Statistical approach to figure out linear relationships
among different quality parameters of various weft
knitted fabrics
S.M. Kamrul Hasan
*, Md Enamul kabir
***
Textile Engineering Department, Primeasia University **
Textile Engineering Department, Primeasia University
Abstract- Knit fabric manufacturers particularly those who are involved in producing weft knitted fabrics are continuously facing the problem of adjusting different quality parameters in producing a fabric of predefined structure. Predicting the yarn count, stitch length and appropriate machine gauge in order to produce fabric of certain GSM is of great importance in this regard. This study aims at emphasizing the importance of the linear relationship among those quality parameters and implementing statistical methods and techniques in order to develop a linear relationship among different quality parameters in making different weft knitted fabrics.
Index Terms-Co-efficient of Determination, GSM, Machine Gauge, Stitch Length, Weft knitting, Yarn Count
I. INTRODUCTION AND LITERATURE REVIEW
eginning in the 1980s and continuing into the twenty-first century, an inordinate amount of attention has been focused on quality improvement in textile industries in order to create an atmosphere that allows the production of high-quality products. Uses of statistical techniques have left no alternatives for the management personnel (from production floor to corporate level) of textile industries in making the organization eligible to fight and survive in the competitive world market. Ready Made Garment (RMG) sector in Bangladesh has played vital role in the countries economy over the last few decades [1]. Among different sections, Knit section have captured large portion of RMG sector [1].
Fabric is the main raw material of a garment. Shell fabric of a garment is generally classified into three categories namely knitted fabrics, woven fabrics and non-woven [2].Knitted fabrics are commercialized in terms of weight. So, Gram per Square Meter (GSM) is the most important quality parameter of knitted fabric [3]. There are other quality parameters of knitted fabric such as Yarn count, Gauge of the knitting machine and adjustment of Stitch length [3]. Yarn count greatly affects fabric quality [4]. Stitch length and machine gauge are also important quality parameters [5],[6].
Knit fabric manufacturers are supposed to produce fabric of certain GSM (Gram Per Square Meter). But it is really difficult for the manufacturing personnel to produce such fabric as GSM largely depends on yarn count, stitch length and machine gauge [7]. Most of the knit fabric manufacturer uses historic data for predicting those quality parameters, while others uses trial and error method in order to keep the GSM of the produced fabric close to the required value. There is no published research work that deals with the above issue. This study aims at developing linear relationship among those quality parameters. In doing so multiple regressions analysis is performed. If the value of co-efficient of determination (R square) obtained by regression analysis is close to +1 or -1, their will be strong relationship among those [8]. A zero value of co-efficient of determination indicates no relationships among the variables [8]. In most research problems where regression analysis is applied, more than one independent variable is needed in the regression model [8]. The complexity of most scientific mechanisms is such that in order to be able to predict an important response, a multiple regression model is needed [9]. When this model is linear in the coefficients, it is called a multiple linear regression model. Here, in this experiment I use machine gauge, yarn count and stitch length as independent variables and gram per square meter (GSM) as dependent variable.
II. METHODOLOGY
The experiment is carried out at knitting shed of Viyellatex Group. Following steps were followed in order to reach the goal of the experiment:
1) The trial is carried out on three different types of machines. Single jersey circular knitting machine, double jersey rib circular knitting machine and double jersey interlock circular knitting machine of different machine gauges are used for producing plain single jersey, 1x1 rib double jersey and plain interlock fabric respectively.
2) Among the four primary base structures of weft knitted fabric, three structures are being studied here in this experiment namely- Plain single jersey, 1x1 rib double jersey and Plain interlock double jersey fabric (figure 1).
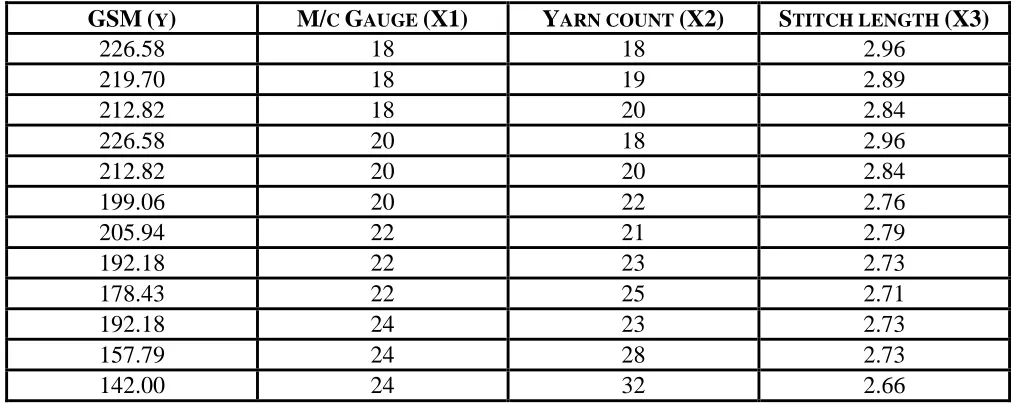
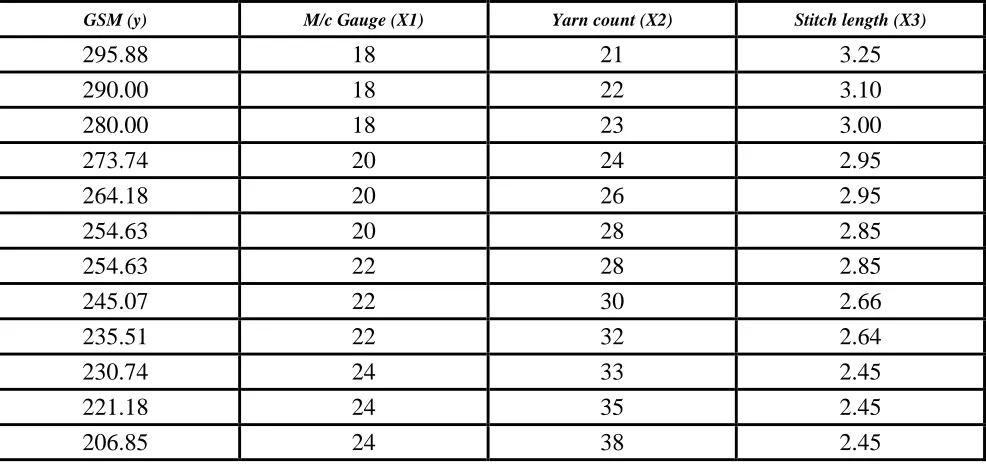
3) The grey GSM of those fabrics for different machine gauges (needle/inch), yarn counts (Ne) and stitch lengths (mm) are observed and being putted on the table I, table II and table III respectively.
4) Scatter diagrams are generated with the help of MS Excel for each of the three structures to identify linear relationship of each of the three quality parameters (discussed later part of the literature review section) with GSM.
5) In order to generate linear equation and the strength of their relationship, multiple regression analysis on MS Excel was carried out using those data achieved for each of the fabric structures separately.
III. RESULTS AND DISCUSSION
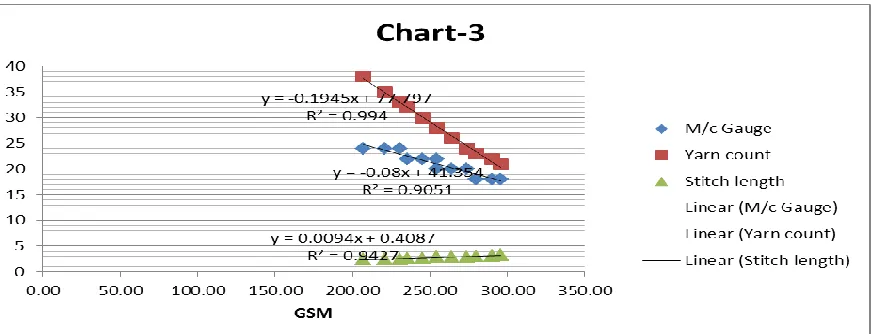
The scatter diagram generated from the data of table I, table II and table III clearly shows that there is a significant linear relationship of machine gauge, yarn count and stitch length on GSM for each of the three structures (figure 2), (figure 3), (figure 4). The summary output of multiple linear regression analysis generated through „Microsoft Excel‟ for three different fabric structures are displayed in (figure 5),(figure 6) and (figure 7) where level of Significance is 0.05 for each of the three cases. From above summery outputs of regression analysis, three values of R square for three different tables are found. The values are 0.994411916, 0.99240091 and 0.99497192 for plain single jersey, Rib double jersey and Interlock double jersey fabric respectively. These values strongly suggest that there is strong linear relationship among those quality parameters of each of the three structures. Three regression equations are developed through this analysis:
For plain fabric, y = 288.4951253 - (0.493075983)*(X1) - 5.737723241*(X2) + 17.0290201*(X3)
For 1x1 Rib fabric, y = 448.946938 - 2.7088664*(X1) - 6.3557930*(X2) + 0.42457136*(X3)
For Interlock Fabric, y = 351.782352 - 0.1305618*(X1) - 4.4973884*(X2) + 11.6971251*(X3)
Where, y=Gram per Square Meter X1=Machine Gauge X2= Yarn Count X3= Stitch Length
Again from the summery outputs, p-value of X2 variable i.e. yarn count is lowest than X1 and X3 variables. This strongly suggests that
yarn count has strongest influence on fabric GSM than the other two parameters.
[image:2.612.52.559.487.689.2]IV. TABLES AND FIGURES
Table I: Experiment data for Plain Single jersey fabric.
Table II: Experiment data for Fine 1x1 Rib fabric.
GSM
(
Y)
M/
CG
AUGE(X1)
Y
ARN COUNT(X2)
S
TITCH LENGTH(X3)
226.58
18
18
2.96
219.70
18
19
2.89
212.82
18
20
2.84
226.58
20
18
2.96
212.82
20
20
2.84
199.06
20
22
2.76
205.94
22
21
2.79
192.18
22
23
2.73
178.43
22
25
2.71
192.18
24
23
2.73
157.79
24
28
2.73
GSM
(
Y)
M/
CG
AUGE(X1)
Y
ARN COUNT(X2)
S
TITCH LENGTH(X3)
270.22
18
21
2.90
262.25
18
22
2.85
254.28
18
23
2.81
246.31
20
24
2.78
230.36
20
26
2.74
214.41
20
28
2.74
214.41
22
28
2.74
198.47
22
30
2.76
182.52
22
32
2.81
174.55
24
33
2.85
158.60
24
35
2.96
[image:3.612.62.555.304.536.2]151.72
24
38
2.85
Table III: Experiment data for Plain Interlock fabric.
GSM (y) M/c Gauge (X1) Yarn count (X2) Stitch length (X3)
295.88
18
21
3.25
290.00
18
22
3.10
280.00
18
23
3.00
273.74
20
24
2.95
264.18
20
26
2.95
254.63
20
28
2.85
254.63
22
28
2.85
245.07
22
30
2.66
235.51
22
32
2.64
230.74
24
33
2.45
221.18
24
35
2.45
Figure 1: Shows the linear structures of three different fabric structures that are being produced in this experiment: (a) Plain structure, (b) Rib structure, (c) Interlock structure [3].
Figure 2: Scatter diagram derived from Table I shows the linear relationships of yarn count, stitch length and machine gauge with GSM individually for plain single jersey fabric
Figure 3: Scatter diagram derived from Table II shows the linear relationships of yarn count, stitch length and machine gauge with GSM individually for fine 1x1 rib fabric.
[image:4.612.92.530.538.705.2]Figure 4: Scatter diagram derived from Table III shows the linear relationships of yarn count, stitch length and machine gauge with GSM individually for plain interlock fabric.
[image:5.612.64.551.347.645.2]SUMMARY OUTPUT OF TABLE-I
Regression Statistics
Multiple R 0.997202044
R Square 0.994411916
Adjusted R
Square 0.992316385
Standard
Error 2.334679254
Observations 12
ANOVA
df SS MS F Significance
F
Regression 3 7759.75213 2586.58 474.5393 2.4E-09
Residual 8 43.6058178 5.45073
Total 11 7803.35795
Coefficients Standard
Error t Stat P-value Lower 95%
Upper 95%
Lower 95.0%
Upper 95.0%
Intercept 288.4951253 51.1605361 5.63902 0.000488 170.519 406.472 170.5187 406.4715
X Variable 1
-0.493075983 0.54134864 -0.9108 0.389005 -1.7414 0.75528 -1.74143 0.755276
X Variable 2
-5.737723241 0.35636588 -16.101 2.22E-07 -6.5595 -4.9159 -6.5595 -4.91594
X Variable 3 17.0290201 14.9570224 1.13853 0.287843 -17.462 51.52 -17.4619 51.51998
Figure 6: Summary output of multiple regression analysis for Table II show the intercept and regression coefficients of yarn count, stitch length and machine gauge for Fine 1x1 Rib fabric.
[image:6.612.61.547.423.700.2]SUMMARY OUTPUT OF TABLE-3
Regression Statistics
Multiple R 0.99748279
R Square 0.99497192
Adjusted R Square
0.99308639
Standard Error 2.30886106
Observations 12
ANOVA
df SS MS F Significance
F
Regression 3 8439.064 2813.02 527.68827 1.5698E-09
Residual 8 42.64672 5.33084
Total 11 8481.711
Coefficients Standard Error
t Stat P-value Lower 95% Upper 95%
Lower 95.0%
Upper 95.0%
Intercept 351.782352 53.00202 6.63715 0.000163 229.559468 474.0052 229.5595 474.0052
X Variable 1 -0.1305618 1.073754 -0.1215 0.9062195 -2.6066429 2.345519 -2.60664 2.345519
X Variable 2 -4.4973884 0.526584 -8.5406 2.719E-05 -5.7116924 -3.28308 -5.71169 -3.28308
X Variable 3 11.6971251 11.37081 1.0287 0.3337169 -14.524007 37.91826 -14.5240 37.91826
Figure 7: Summary output of multiple regression analysis for Table III show the intercept and regression coefficients of yarn count, stitch length and machine gauge for Plain Interlock fabric.
SUMMARY OUTPUT OF TABLE-2
Regression Statistics
Multiple R 0.99619321
R Square 0.99240091
Adjusted R Square 0.98955125 Standard Error 4.15236601
Observations 12
ANOVA
df SS MS F Significance
F
Regression 3 18013.8644 6004.62147 348.25261 8.1813E-09
Residual 8 137.9371482 17.2421435
Total 11 18151.80155
Coefficients Standard Error
t Stat P-value Lower 95% Upper
95%
Lower 95.0%
Upper 95.0%
Intercept 448.946938 54.30142171 8.26768294 3.443E-05 323.727635 574.1662 323.72763 574.166241
X Variable 1 -2.7088664 1.696818547 -1.5964385 0.1490577 -6.6217371 1.204004 -6.621737 1.2040041
X Variable 2 -6.3557930 0.736176128 -8.6335223 2.513E-05 -8.0534182 -4.65817 -8.053418 -4.6581678
V. CONCLUSION
As time passes, Knitted garments are getting more and more popular throughout the whole world. This increasing demand of knitted garments is only due to comfort ability and comparatively lower price of knit fabrics. These two factors of knitted fabrics completely depend on the quality parameters that are already discussed in this paper. This study explains strong linear relationships among those quality parameters and also develops multiple linear regression equations for determining grey GSM of Plain, Rib and Interlock fabrics from given machine gauge, yarn count and stitch length. These equations give us freedom for choosing appropriate m/c gauge, yarn count and stitch length for producing fabric of certain GSM.
ACKNOWLEDGMENT
The Authors deeply acknowledge Viyellatex Group, khoirtoil, Gazipura, Tongi, Gazipur for providing the production facility to carry out the experiment.
REFERENCES
[1] M. Z. Haider, “Competitiveness of the Bangladesh Ready-made Garment Industry in Major International Markets,” Asia-Pacific Trade and Investment Review, Vol. 3, No. 1, pp.1-2, June 2007.
[2] A. R. Horrocks, S.C. Anand, “Hand book of Technical textiles,” Woodhead publishing Ltd, pp. 105, Oct 2000. [3] D. J. Spencer, “Knitting Technology”, third edition, Woodhead Publishing Ltd., April 2001.
[4] I. I., M. B., S. J., “Circular knitting: technology process structure yarn quality”, Second Edition, Meisenbach GmbH, Bambreg, Germany, 1957.
[5] G. S. R., L. M., S. N. S., and G. S. A., "Computer Vision-Aided Fabric Inspection System for On-Circular Knitting Machine" Textile Research Journal, 75(6), 492497, 2005.
[6] S. E., G. Y., A. M., Y. S. and P. C., “Detection and Classification of Defects in Knitted Fabric Structures”, Textile Research Journal, 76(4),295-300, 2006. [7] S. M. M. kabir, M. Zakaria, “Effect of Machine Parameters on Knit Fabric Specifications,” DUET Journal, Vol. 1, issue. 3, June 2012.
[8] D. A. lind, W. G. Marshal, S. A. Wathen, “Statistical Techniques in Business & economics”, twelfth edition, McGraw-Hill/Irwin, 2005.
[9] R. E. Walpole, R. H. Myers, S. L. Myers, K. Ye, “Probability & Statistics for Engineers & Scientists- eighth edition,” Pearson Education International, 2007.
AUTHORS
First Author – S.M. Kamrul Hasan, B.Sc in Textile Engineering (University of Dhaka, Bangladesh), currently is working as a senior
Lecturer at Primeasia University. Email address: [email protected]
Second Author – Md Enamul kabir, B.Sc in Textile Engineering (University of Dhaka, Bangladesh) currently is working as a
Lecturer at Primeasia University, email: [email protected]
![Figure 1: Shows the linear structures of three different fabric structures that are being produced in this experiment: (a) Plain structure, (b) Rib structure, (c) Interlock structure [3]](https://thumb-us.123doks.com/thumbv2/123dok_us/9106213.983989/4.612.92.530.538.705/structures-different-structures-experiment-structure-structure-interlock-structure.webp)