ISSN 2250-3153
Genetic Studies of Association and Path Coefficient
Analysis of Yield and its Component Traits in Pigeon Pea
(
Cajanus Cajan
L. Millsp.)
P.J.M.Rao , S.Malathi , D.V.V.Reddy and M.Upender
AICRP, Pigeonpea, ANGRAU, Regional Agricultural Research Station, Warangal 506 007 , Andhra Pradesh, India
Abstract- 50 pigeonpea genotypes were evaluated to study the nature and magnitude of relationship of important agronomic traits with seed yield along with their direct and indirect effects. Days to maturity, number of primary branches per plant, number of pods per plant, and harvest index had significant positive association with seed yield, also showed direct positive effect in determining yield in pigeonpea. Hence due emphasis should be given to number of pods per plant, number of primary branches and harvest index for improvement of seed yield in pigeonpea.
Index Terms- Correlation, path analysis, pigeonpea, yield , harvest index
I. INTRODUCTION
igeonpea is an important rainy season pulse crop of subsistence agriculture. Despite of research efforts the productivity of pigeonpea is very low. Yield is a complex trait controlled by polygenes and highly influenced by environment. Selection based on yield itself only is not effective. The information on nature and magnitude of correlation coefficient help the breeders to decide the traits to be given importance in selection and also the selection criteria for simultaneous improvement of various characters along with the seed yield. when more characters are involved in the association analysis it becomes difficult to ascertain which really contributes towards yield. Thus correlation analysis is not enough to give an exact picture of relative importance of direct and indirect influence of each of the component characters on seed yield. Path coefficient analysis is an important tool for plant breeders helps in partitioning the correlation coefficient into components of direct and indirect influences and provide better insight on character and their relationship with yield. The objective of this study was too estimate the association of yield contributing characters their direct contribution to yield and indirect effects through other characters on pigeonpea yields under rainfed situations.
II. MATERIAL AND METHODS
In the present study, investigation was carried on 40 genotypes/germplasm lines received from NBPGR, New Delhi and 10 locally maintained germplasm/advanced lines. The genotypes were evaluated in randomized complete block design with two replication during kharif 2010-11 at D’ block farm of Regional Agricultural Research Station, Warangal. Each experimental plot consisted of two rows of 4 meter length with
row to row and plant to plant spacing of 120 cm and 20 cm respectively. All the recommended agronomic practices were followed for optimum crop growth. Five competitive plants in each plot were selected randomly in each genotype per replication for recording observations on plant height (cm), number of primary branches per plant, number of pods per plant, pod length (cm), number of seeds per pod, 100 seed weight (g), seed yield per plant(g) and Harvest Index (%). Days to flowering and days to maturity were recorded on plot basis. The data were statistically analysed to estimate the genotypic correlation coefficients between seed yield and other yield component traits as well as among the components traits as per the method suggested by Falconer (1964) Path coefficient analysis was done for yield components to find out the direct and indirect effects of different characters on seed yield. (Dewey and Lu, 1959).
III. RESULTS AND DISCUSSION
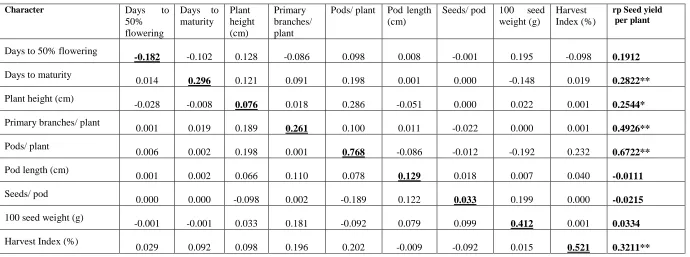
The analysis of variance indicated significant differences among genotypes for all the characters. The correlation coefficients between seed yield and yield attributing traits are presented in Table-1. In the present study days to maturity, primary branches per plant, number of pods per plant, harvest index and plant height showed highly significant positive correlation with seed yield per plant. Similar results were also reported by Vasantha Rao et al.(2010b), Badru (2010) and Sawargoankar (2011) for number of pods per plant; Badru (2010) for primary branches, Vasantha Rao (2010b) and Badru (2010) for days to maturity , plant height and harvest index. Days to flowering and test weight were also had positive but non significant association with seed yield. Anuradha et al (2007) also reported positive association of days to flowering with seed yield. Vasantha Rao et al. (2010b) reported non significant but positive association of test weight with seed yield. Days to flowering showed significant positive association with days to maturity, number of primary branches and number of pods per plant but negatively associated with pod length and number of seeds per pod. The association between days to flowering and days to maturity is significantly positive. Plant height exhibited significant and positive association with number of primary branches per plant, number of pods per plant and harvest index. Number of primary branches per plant recorded positive and significant association with number of pods per plant and negatively associated with test weight. Harvest index showed positive association with plant height, number of primary
ISSN 2250-3153
branches, number of pods per plant but significantly negatively associated with seed per pod. The association of number of pods with pod length , seeds per pod and test weight was negative revealing that plants with more number of pods produced smaller seeds . A significant and positive genotypic association among number of pods per plant, number of primary branches per plant, plant height, days to flowering and days to maturity and their positive association with seed yield indicated that these are major yield contributing traits in pigeonpea. Therefore, selection for any of these traits would offer the scope for simultaneous improvement of contributing characters in addition would be helpful in improving the yield potential in pigeonpea.
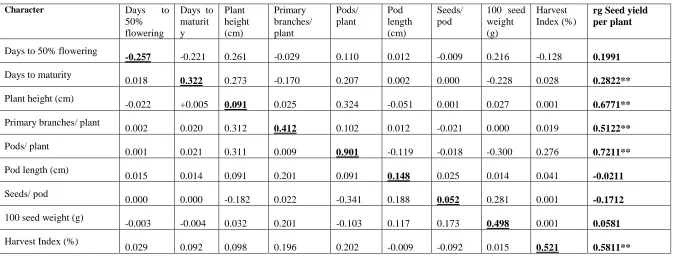
Path analysis results are presented in Table-2a & 2b. Genotypic path anlysis revealed that number of pods per plant had the high positive direct effect (0.901) on seed yield followed by harvest index (0.651), 100 seed weight (0.498), Primary branches (0.412) and days to maturity (0.322). Remaining traits recorded low direct effect on seed yield. Days to flowering recorded negative direct effect on seed yield but indirect effects through plant height, number of pods per plant and test weight are positive. Plant height and seed per pod had negligible positive direct effect on seed yield. The indirect effects of all the characters under study via number of pods were observed to be high. Similar results were reported by Vasantha Rao et al. (2010b), Badru (2010) for number of pods per plant and test weight and days to maturity. Vasantha Rao et al. (2010b) for harvest index. The component of residual effect was 0.402 indicating the adequacy and appropriateness of characters studied. However, there is scope for inclusion of some more traits of physiological and quality nature.
IV. CONCLUSION
The present study revealed that for obtaining higher seed in pigeonpea due emphasis should be given for higher number of pods per plant, more primary branches, more plant height and reasonable good test weight along with better harvest index, since all these characters are positively correlated with seed yield, also had high positive direct and indirect influence on seed yield. Based on these traits and cluster pattern 12 best genotypes were selected for future breeding programmes.
ACKNOWLEDGEMENT
The authors are highly grateful to the NBPGR for the financial assistance provided for the evaluation of germplasm
REFERENCES
[1] Anuradha, B., Koteswara Rao, Y., Rama Kumar, P.V and Srinivasa Rao, V. 2007. Correlation and path analyses for seed yield and yield contributing characters in pigeonpea
(Cajanus cajan (L.) Millsp.). The Andhra Agricultural Journal. 54
(1&2): 54: 9-12
[4] Falconer, D.S. 1964. An Introduction to Quantitative Genetics. Oliver and Boyd, London. 312-324.
[5] Sawargaonkar.S.L., Saxena K.B.Madrap,.I.A.Rathore,A. 2011Stability analysis of yield and related traits in pigeonpea hybrids Indian J, Genetics, 24(3):184-193
[6] Vasantha Rao, U., Govinda Rao, B., Panduranga Rao, C and Srinivasa Rao, V. 2010b. Character association and path coefficient analyses for yield and component traits in pigeonpea [Cajanus cajan (L.) Millsp.]. The Andhra
Agricultural Journal. 57(3): 298-300.
AUTHORS
First Author – P.J.M.Rao, AICRP, Pigeonpea, ANGRAU,
Regional Agricultural Research Station, Warangal 506 007 , Andhra Pradesh, India
Second Author – S.Malathi, AICRP, Pigeonpea, ANGRAU,
Regional Agricultural Research Station, Warangal 506 007 , Andhra Pradesh, India
Third Author – D.V.V.Reddy, ANGRAU, Regional
Agricultural Research Station, Warangal 506 007 , Andhra Pradesh, India
Fourth Author – M.Upender, AICRP, Pigeonpea, ANGRAU,
ISSN 2250-3153
Table 1: Phenotypic (above diagonal) and genotypic (below diagonal) correlations for 10 characters in 50 pigeonpea [Cajanus cajan (L.)
Millsp.] genotypes
** = Significance at 1% level, * = Significance at 5% level.
Character Days to
50% flowering
Days to maturity
Plant height (cm)
Primary branches/ plant
Pods / plant Pod length (cm)
Seeds/ pod 100- seed weight (g)
Harvest index (%)
Seed yield / plant (g)
Days to 50%
flowering - 0.6232** 0.314 0.4281** 0.4220** -0.3221** -0.4426** -0.1687 0.1699 0.1912
Days to maturity
0.7105** - 0.1814 -0.4162** 0.4021** -0.1525 -0.1812 -0.1134 0.1269 0.2822**
Plant height (cm)
0.0471 0.1136 - 0.4224** 0.5862** -0.0221 0.1012 0.1922 0.2261* 0.2544*
Primary branches/
plant 0.5611** -0.4615** 0.5016** - 0.6102** -0.0921 -0.0822 -0.3255** 0.1138 0.4926**
Pods/ plant
0.5261** 0.4811** 0.6052** 0.6651** - -0.3022** -0.2280** -0.3116** 0.2120* 0.6722**
Pod length (cm)
0.2620* 0.0513 0.2152* 0.1871 -0.5112** - 0.3431** 0.2814** -0.0221 -0.0111
Seeds/ pod
-0.5166** -0.2204* -0.1021 -0.1211 -0.4617** 0.4212** - 0.4156** -0.0022
-0.0211
100-seed weight (g)
-0.1115 -0.1276 0.2881** -0.4116** -0.4601** 0.5144** 0.5811** - -0.0121 0.0331
Harvest index (%)
0.1922 0.1586 0.2811** 0.3641** 0.3211** -01717 -0.2521* -0.0222 - 0.3211**
Seed Yield/ Plant (g)
0.1991 0.2752** 0.6771** 0.5122** 0.7211** -0.0221 -0.1712 0.0581 0.5811**
ISSN 2250-3153
Table 2a: Estimates of direct and indirect effects (genotypic) between yield and yield components in pigeonpea
** = Significance at 1% level, * = Significance at 5% level. Residual effect= 0.402
Diagonal values are direct effects, other values are indirect effects: rg= Genotypic correlation
Character Days to
50% flowering
Days to maturit y
Plant height (cm)
Primary branches/ plant
Pods/ plant
Pod length (cm)
Seeds/ pod
100 seed weight (g)
Harvest Index (%)
rg Seed yield per plant
Days to 50% flowering
-0.257 -0.221 0.261 -0.029 0.110 0.012 -0.009 0.216 -0.128 0.1991
Days to maturity
0.018 0.322 0.273 -0.170 0.207 0.002 0.000 -0.228 0.028 0.2822**
Plant height (cm)
-0.022 +0.005 0.091 0.025 0.324 -0.051 0.001 0.027 0.001 0.6771**
Primary branches/ plant
0.002 0.020 0.312 0.412 0.102 0.012 -0.021 0.000 0.019 0.5122**
Pods/ plant
0.001 0.021 0.311 0.009 0.901 -0.119 -0.018 -0.300 0.276 0.7211**
Pod length (cm)
0.015 0.014 0.091 0.201 0.091 0.148 0.025 0.014 0.041 -0.0211
Seeds/ pod
0.000 0.000 -0.182 0.022 -0.341 0.188 0.052 0.281 0.001 -0.1712
100 seed weight (g)
-0.003 -0.004 0.032 0.201 -0.103 0.117 0.173 0.498 0.001 0.0581
Harvest Index (%)
ISSN 2250-3153
Table 2b: Estimates of direct and indirect effects (phenotypic) between yield and yield components in pigeonpea
** = Significance at 1% level, * = Significance at 5% level. Residual effect= 0.482
Diagonal values are direct effects, other values are indirect effects: rp= Phenotypic correlation
Character Days to
50% flowering
Days to maturity
Plant height (cm)
Primary branches/ plant
Pods/ plant Pod length (cm)
Seeds/ pod 100 seed weight (g)
Harvest Index (%)
rp Seed yield per plant
Days to 50% flowering
-0.182 -0.102 0.128 -0.086 0.098 0.008 -0.001 0.195 -0.098 0.1912
Days to maturity
0.014 0.296 0.121 0.091 0.198 0.001 0.000 -0.148 0.019 0.2822**
Plant height (cm)
-0.028 -0.008 0.076 0.018 0.286 -0.051 0.000 0.022 0.001 0.2544*
Primary branches/ plant
0.001 0.019 0.189 0.261 0.100 0.011 -0.022 0.000 0.001 0.4926**
Pods/ plant
0.006 0.002 0.198 0.001 0.768 -0.086 -0.012 -0.192 0.232 0.6722**
Pod length (cm)
0.001 0.002 0.066 0.110 0.078 0.129 0.018 0.007 0.040 -0.0111
Seeds/ pod
0.000 0.000 -0.098 0.002 -0.189 0.122 0.033 0.199 0.000 -0.0215
100 seed weight (g)
-0.001 -0.001 0.033 0.181 -0.092 0.079 0.099 0.412 0.001 0.0334
Harvest Index (%)
![Table 1: Phenotypic (above diagonal) and genotypic (below diagonal) correlations for 10 characters in 50 pigeonpea [Cajanus cajan (L.) Millsp.] genotypes](https://thumb-us.123doks.com/thumbv2/123dok_us/9105030.983835/3.792.44.747.127.408/phenotypic-diagonal-genotypic-diagonal-correlations-characters-pigeonpea-genotypes.webp)