Copyright © 2017, Scholarly Research Journal for Interdisciplinary Studies
VALUE PATTERNS OF SCIENCE AND ARTS STUDENTS IN RELATION TO
THEIR SOCIO ECONOMIC STATUS AND TYPE OF SCHOOL
Mrs. Amandeep kaur
Assistant Prof. in Education, Khalsa college of Education , Amritsar.
Values give meaning and strength to a person’s character by occupying a center place in his life. Values are the bases on which the actions, reactions, emotions and judgments of an individual depend. The Study was designed to examine the Value patterns of Science and Arts students in relation to their Socio Economic Status and type of School. Participants were 200 adolescents of 10+2 grade of Science and Arts stream from Amritsar city. The findings of the study revealed that no significant differences exist in the six values of Science and Arts Students. There is no significant difference in value patterns of Science and Arts students belonging to High Socio Economics Status. Science and Arts Students belonging to low Socio Economic Status differ significantly on Aesthetic Values and Religious Values and no significant differences exist in the Value pattern of Science and Arts Senior Secondary School Students studying in Government and Private Schools.
INTRODUCTION
Man and values are inseparable. Good education is inconceivable if it fails to inculcate values
which are essential to good life and social well being. It is unfortunate that increase in
materialistic attitude has distanced men from path dharma or values. Values give meaning
and strength to a person’s character by occupying a center place in his life. Values reflect one’s personal attitude and judgment, decisions and choices, behavior and relationships,
dreams and visions. We imbibe these values from our parents who teach us and we practice
these values in our lives.
Values according to Indian philosophy
According to Indian philosophy, values have two functions.
1) Theoretical: reveals the existence of some object.
2) Practical: helps in fulfillment of a purpose in life.
Values, simply stated, are the determinants of man that influence his choices in life and that
decide his behavior. According to sociologists view, values are the result of social
environment. Values are greatly influenced by the factors like home environment, school
environment, religion and education and socio- economic status. Socio- economic status is a
Copyright © 2017, Scholarly Research Journal for Interdisciplinary Studies
level that indicates of both social and economic achievement of an individual and a group.
The facilities which are available to those who are of high SES are not available to those of
low SES. The children belonging to high SES are more satisfied as far as their needs are
concerned. Values influence all aspects of educational process, techniques policies and
procedures. Study of academic streams in school like science and arts is also responsible for
change in value patterns of students. Science students have different beliefs than those of arts
students because science is all about facts and proofs. Arts students have more aesthetic and
philosophical values. Education aims at to shape the personality of students. The thoughts
and value patterns which the students possess help in deciding the curriculum. Keeping in
view the needs and structure of the society, curriculum of different subject varies from school
to school. There are different types of school like private and government schools. So type of
school also influences the value pattern of students.
Gambo Adamu Aliyu (2016) conducted a study of socio- economic status in relation to
academic achievement of senior secondary students. This study revealed that individual with
low household’s income and of low subjective class had the highest probability of reporting
discrepant HRQOL and QOL scores, whereas individuals with high household income and
high subjective class had the lowest probability of Discrepant HRQOL and QOL scores.
Sharma (2014) studied value education: Need and Strategies. This study revealed that
education should be a means of getting in touch with our innate values like love happiness
and truth so that we become strong, balanced and constructive citizens.
RESEARCH OBJECTIVES
1. To compare the value patterns of Science and Arts senior secondary school students.
2. To compare the value patterns of science and arts senior secondary school students in
relation to their SES.
3. To compare the value patterns of senior secondary school students studying in different
types of schools.
RESEARCH HYPOTHESES
1. There is no significant difference in the value patterns of Science and Arts senior
secondary school students.
2. There is no significant difference in the value patterns of science and arts senior
Copyright © 2017, Scholarly Research Journal for Interdisciplinary Studies
3. There is no significant difference in the value patterns of senior secondary school students
studying in Private and Government schools.
DESIGN OF THE STUDY
Descriptive survey type research was adopted in order to carry out study as it intends to study
to value pattern of science and arts in relation to socio economic status and type of school.
POPULATION AND SAMPLE
The population of present study consisted of students (Science and Arts) studying in 10+2
grade. Purposive sampling technique was used for selection of the sample. A sample of 200
students both boys and girls from different schools of Amritsar city was selected.
RESEARCH TOOLS
Keeping in view the purpose of study, the following tools were selected and used for
collection of relevant data.
1) In order to assess the attitude of students towards different values, value test by R.K.
Ojha (1970) was used and modified by investigator.
2) To assess the Socio- Economic status of students, Socio Economic Status scale by
kuppuswamy (1982) was used.
3) Data was collected from students studying in private and government schools.
ANALYSIS OF DATA
The data was scrutinized, classified, tabulated and analyzed variable wise. As the data was
quantitative in nature so t-test was applied through descriptive statistics.
ANALYSIS AND INTERPRETATION
For testing I Hypothesis‘t’ test was applied to verify the significance difference between the
mean scores of science and arts senior secondary school students on different values.
Calculated‘t’ value for different value patterns is not significant at 0.05 level of significance
(Table 1). This shows that science and arts students do not differ significantly on theoretical,
economic, social, political, aesthetic and religious values.
Table 1 Mean scores, SD and‘t’ value for six values of science and Arts group (N=200)
Value patterns
Science Arts Science Arts
t-value
Level of
significance
Inference
Mean1
Mean
II
SD I SD II
Theoretical 40.95 39.55 5.30 4.84 1.94 0.05 Not
significant
Copyright © 2017, Scholarly Research Journal for Interdisciplinary Studies
significant
Aesthetic 39.07 38.02 5.16 5.88 0.87 0.05 Not
significant
Social 40.10 39.78 5.29 5.95 0.40 0.05 Not
significant
Political 39.99 38.61 5.63 6.56 1.59 0.05 Not
significant
Religious 39.26 39.30 5.47 5.84 0.33 0.05 Not
significant
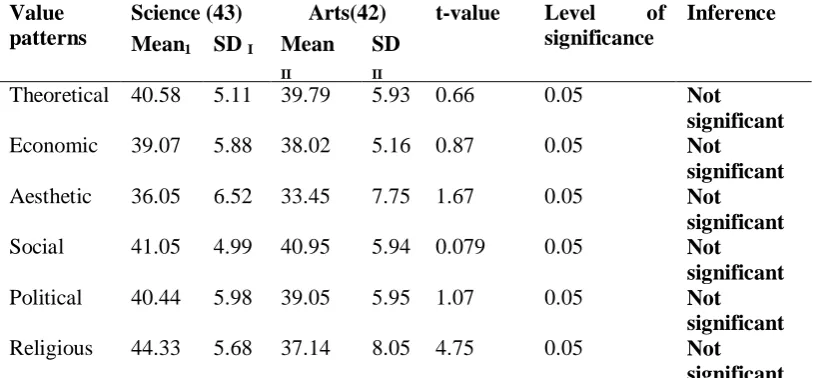
For testing II Hypotheses, the raw scores of Science and Arts students were pooled and
entered belonging to high SES and‘t’ test was applied. Calculated’ value for different value
patterns of science and arts students in relation to Socio- Economic Status is not significant at
0.05 level of significance (Table2). This shows that science and arts students belonging to
high Social Economic Status do not differ significantly on theoretical, economic, social,
political, aesthetic and religious values. But students belonging to low Socio Economic Status
[image:4.595.95.505.410.599.2]differ significantly on Aesthetic Values and religious values (Table 3).
Table 2 Mean scores, SD and‘t’ value for six values of science and Arts group of
High SES
Value patterns
Science (43) Arts(42) t-value Level of
significance
Inference
Mean1 SD I Mean
II
SD
II
Theoretical 40.58 5.11 39.79 5.93 0.66 0.05 Not
significant
Economic 39.07 5.88 38.02 5.16 0.87 0.05 Not
significant
Aesthetic 36.05 6.52 33.45 7.75 1.67 0.05 Not
significant
Social 41.05 4.99 40.95 5.94 0.079 0.05 Not
significant
Political 40.44 5.98 39.05 5.95 1.07 0.05 Not
significant
Religious 44.33 5.68 37.14 8.05 4.75 0.05 Not
significant
Table 3 Mean scores, SD and‘t’ value for six values of science and Arts group of
Low SES
Value patterns
Science (35) Arts(33)
t-value
Level of
significance
Inference
Mean1 SD
I
Mean
II
SD II
Theoretical 41.11 5.67 39.36 3.99 1.46 0.05 Not
significant
Economic 36.94 4.89 37.79 5.74 0.65 0.05 Not
significant
Copyright © 2017, Scholarly Research Journal for Interdisciplinary Studies
Social 39.26 5.98 39.30 5.45 0.33 0.05 Not
significant
Political 38.66 5.30 37.76 7.53 0.69 0.05 Not
significant
Religious 41.80 6.37 42.18 10.76 0.179 0.05 significant
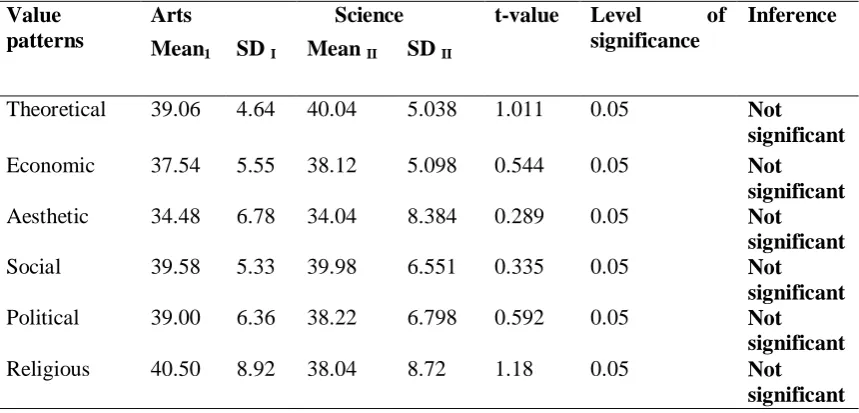
For testing III Hypotheses, ‘t’test was applied and and‘t’ ratio is not significant for six Values
for Science Arts Students studying in Government and private schools at 0.05 level of
[image:5.595.84.514.503.709.2]significance (Table 4 and Table 5).
Table 4 Mean scores, SD and‘t’ value for six values of science and Arts Students
studying in Government Schools (N=100)
Value patterns
Arts Science
t-value
Level of
significance
Inference
Mean1 SD I Mean
II
SD II
Theoretical 41.66 4.72 40.24 5.78 1.34 0.05 Not
significant
Economic 38.50 5.33 38.28 5.58 0.20 0.05 Not
significant
Aesthetic 36.70 7.27 36.70 5.95 0.03 0.05 Not
significant
Social 40.70 5.12 39.50 5.44 1.13 0.05 Not
significant
Political 39.54 5.42 39.54 5.42 0.79 0.05 Not
significant
Religious 42.84 6.46 43.08 6.80 0.18 0.05 Not
significant
Table 5 Mean scores, SD and‘t’ value for six values of science and Arts Students
studying in Private Schools (N=100)
Value patterns
Arts Science t-value Level of
significance
Inference
Mean1 SD I Mean II SD II
Theoretical 39.06 4.64 40.04 5.038 1.011 0.05 Not
significant
Economic 37.54 5.55 38.12 5.098 0.544 0.05 Not
significant
Aesthetic 34.48 6.78 34.04 8.384 0.289 0.05 Not
significant
Social 39.58 5.33 39.98 6.551 0.335 0.05 Not
significant
Political 39.00 6.36 38.22 6.798 0.592 0.05 Not
significant
Religious 40.50 8.92 38.04 8.72 1.18 0.05 Not
Copyright © 2017, Scholarly Research Journal for Interdisciplinary Studies
MAJOR FINDINGS
1. There is no significant difference in the six values of Science and Arts Students.
2. There is no significant difference in value patterns of Science and Arts students belonging
to High Socio Economics Status.
3. Science and Arts Students belonging to low Socio Economic Status differ significantly on
Aesthetic Values and Religious Values.
4. There is no significant difference in the Value pattern of Science and Arts Senior
Secondary School Students studying in Government and Private Schools.
REFERENCES
Aliyu, G. M. (2016). Influence of socio economic status on academic achievement of senior secondary school students in Nassarawa Zonal Education Area of Kano State, Nigeria. Asian Journal of Educational Research, 4(4), 1-8.
Brar, j. (1998). A study of values of secondary school teachers. The Educational Review, 47(6), 113-115.
Bogardus, E. S. (1950). Fundamentals of Social Psychology. New York:Appleton. Buch, M. B. (1987). Third Survey of Research in Education, New Delhi:NCERT.
Chahal, D. (2007). Value Education: Need of the Hour. Educational Trends, 1(2), 44-48. Gandhi, K. L. (1993). Value Education. New Delhi: Gyan Publishing House.
Garret, H. C. (2004). Statistics in Psychology and Education. New Delhi: Paragon International Publishers.
Gold, V. (2000). Values and Value transmitters: A study of secondary school teachers vis-à-vis teaching values in public schools. Dissertation Abstract International, 60(11).
Kaur, M. (2003). The impact of socio economic status and cultural background on the value patterns of adolescents. Unpublished M.Ed. Dissertation , G.N.D.U, Amritsar.
Sharma, S. (2014). Vlaue Oriented Education: Need and Strategies. Journal of recent researches in Education and Psychology, 19(11), 27-30.