Georgia State University
ScholarWorks @ Georgia State University
Public Health Theses School of Public Health
Spring 5-11-2018
Lifetime Risk of Atrial Fibrillation by Race and
Socioeconomic Status: The Atherosclerosis Risk in
Communities (ARIC) Study
Liping Mou
Follow this and additional works at:https://scholarworks.gsu.edu/iph_theses
This Thesis is brought to you for free and open access by the School of Public Health at ScholarWorks @ Georgia State University. It has been accepted for inclusion in Public Health Theses by an authorized administrator of ScholarWorks @ Georgia State University. For more information, please contact [email protected].
Recommended Citation
Mou, Liping, "Lifetime Risk of Atrial Fibrillation by Race and Socioeconomic Status: The Atherosclerosis Risk in Communities (ARIC) Study." Thesis, Georgia State University, 2018.
1 ABSTRACT
Lifetime risk of atrial fibrillation by race and socioeconomic status: The Atherosclerosis
Risk in Communities (ARIC) study
Atrial fibrillation (AF) is a common cardiac arrhythmia, affecting 2.7-6.1 million people in
the US. The lifetime risk of AF has been previously reported in whites, but not in African
Americans. Lifetime risk of AF by socioeconomic status has not been investigated before. This
study investigated the lifetime risk of AF in African Americans and in individuals with different
socioeconomic status. The analysis included 15,343 whites and African Americans in the
Atherosclerosis Risk in Communities (ARIC) study who were followed for an average of 21
years. For analysis, total family income was categorized as <$25,000, $25,000-$49,999, and
≥$50,000, and education as < high school graduate, high school graduate, and at least some
college. Incident AF was ascertained from study electrocardiograms, hospital discharge records,
and death certificates. Lifetime risk of AF was estimated by a modified Kaplan-Meier method.
2760 AF cases were identified during follow-up. Lifetime risk of AF was 36% (95% CI:
32-38%) in white men, 30% (26-32%) in white women, 21% (13-24%) in African American men,
and 22% (16-25%) in African American women. Regardless of race and sex, incidence rates of
AF decreased from the lowest to highest categories of income and education. In contrast, lifetime
risk of AF increased in individuals with higher income and education in most sex-race groups.
Cumulative incidence of AF was lower in those with higher income and education compared to
their low socioeconomic status counterparts through earlier life but was reversed after age 85.
The study concluded that lifetime risk of AF in the ARIC cohort was approximately 33% among
whites and 20% among African Americans. Socioeconomic status was inversely associated with
2
Lifetime risk of atrial fibrillation by race and socioeconomic status: The Atherosclerosis Risk in
Communities (ARIC) study
Liping Mou
MD., Bengbu Medical College,
Graduate School, Sun Yat-Sen University, China
A Thesis Submitted to the Graduate Faculty of Georgia State University in Partial Fulfillment
of the Requirements for the Degree
MASTER OF PUBLIC HEALTH
ATLANTA, GEORGIA
3
Author’s Statement
In presenting this thesis as a partial fulfillment of the requirements for a degree of Master
of Public Health from Georgia State University, I agree that the Library of the University shall
make it available for inspection and circulation in accordance with its regulations governing
materials of this type. I agree that permission to quote from, to copy from, or to publish this thesis
may be granted by the author. Such quoting, copying, or publishing must be solely for scholarly
purposes and will not involve potential financial gain. It is understood that any copying from or
publication of this dissertation which involves potential financial gain will not be allowed without
written permission of the author.
Liping Mou
4
TABLE OF CONTENTS
INTRODUCTION... 7 - 8
LITERATURE REVIEW...9 - 11
METHODS………...12 - 16
RESULTS...17 - 19
DISCUSSION AND CONCLUSION...20 - 24
5
LIST of TABLES
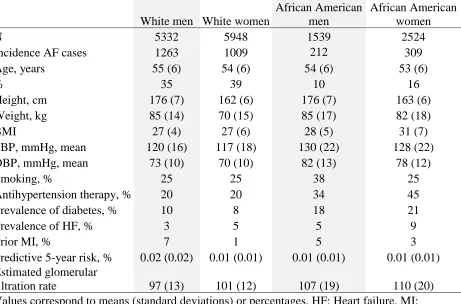
Table 1. Baseline characteristics of participants….………...30
Table 2. Baseline Characteristics of participants by race, family income, and education….31
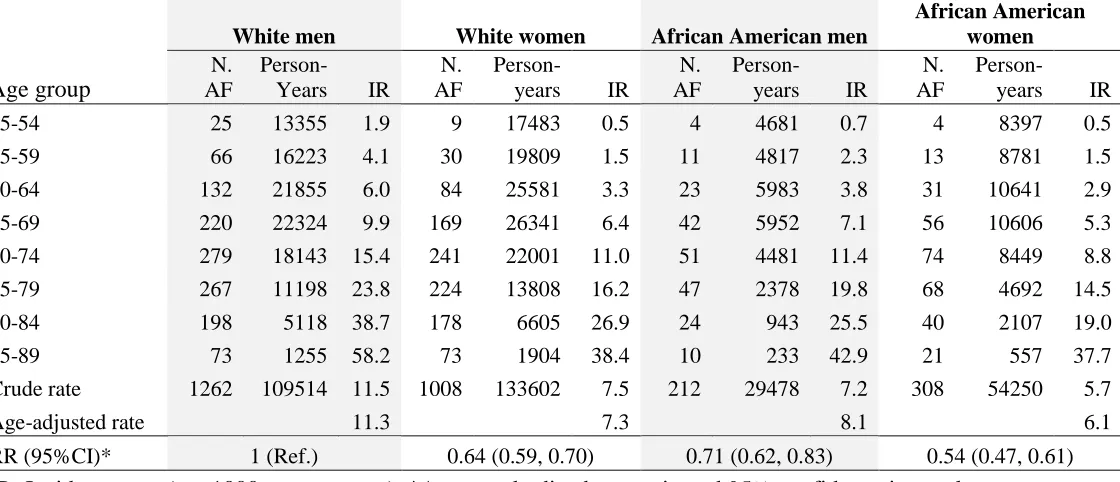
Table 3. Age-, race-, and sex-specific incidence rates of AF per 1000 person-years………33
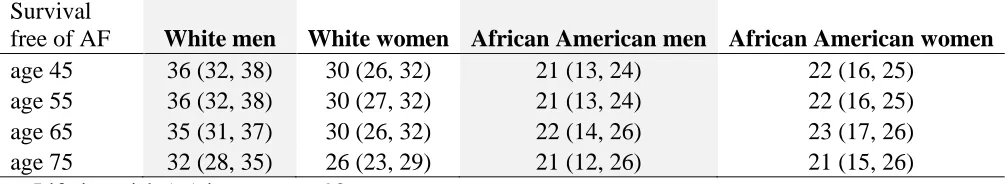
Table 4. Estimates (95% confidence intervals) of race- and sex-specific lifetime risk of AF
conditional on survival free of AF to age 45, 55, 65, or 75………..34
Table 5. Age-, race-, sex-, income-, and education-specific incidence rates of AF per 1000
person-years………..35
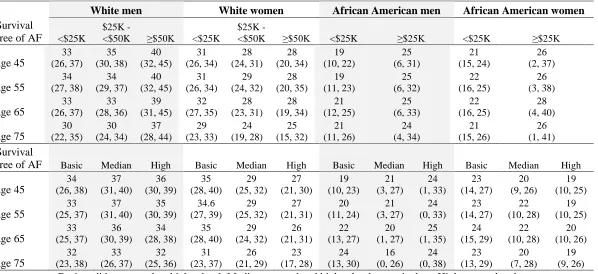
Table 6. Estimates (95% confidence intervals) of race-, sex, income-, and education-specific
lifetime risk of AF conditional on survival free of AF to age 45, 55, 65, and 75...36
Table 7. Estimates (95% confidence intervals) of lifetime risk of AF conditional on survival
6
LIST of FIGURES
Figure 1. Race- and sex-specific cumulative incidence of AF……….38
Figure 2. Cumulative incidence of AF from age 45 to 92 by income, education, race and
sex……….………39
Figure 3. Cumulative incidence of AF from age 45 to 92 by quartiles of predicted 5-year
7 INTRODUCTION
Background
Atrial fibrillation (AF) affects 2.7-6.1 million people in the United States. This number is
expected to increase as the population ages. 1 It is estimated that by 2030 there will be 12.1
million AF cases in the US. 41 AF is associated with significant morbidity, mortality, and poor
quality of life, as it can lead to blood clots and increase the risk of heart failure (HF), myocardial
infarction (MI), 3 and stroke. 4 Risk factors for AF include high blood pressure, obesity, diabetes,
smoking, and heavy drinking.42
AF constitutes a significant public health burden. Annual cost of AF in the US is
approximately $6 billion, and people who have AF spend an additional $8,705 per year on
medical costs compared to people without AF. 1, 2
Findings from the Framingham Heart Study in 2004 indicated that one in four individuals
would develop AF during their lifetime,5 with recent estimates in the same cohort suggesting that
lifetime risk of AF is greater 30%. 6 Lifetime risk quantifies the absolute risk of developing a
disease of interest before death. It is calculated as the adjusted cumulative incidence of the
disease, taking the competing risks of death into account. 5 Estimates of the lifetime risk of
developing AF are an easy way to communicate future risk to individuals. 5 However, the recent
Framingham estimates, though taking into account recent upward trends in the incidence of AF, 7
may not be generalizable to non-white populations because its participants are from a
predominantly white population of European origin. Since African Americans and other ethnic
and racial groups have lower risk of AF compared to whites,8, 9 contemporary estimates of
8
Socioeconomic and racial health disparities exist in the US, 10 which influences health
outcomes, including the management and care of cardiovascular diseases. 11 A previous analysis
of the US-based Atherosclerosis Risk in Communities (ARIC) study cohort showed that lower
income in the overall population and lower education level among women were associated with
increased risk of AF. 12 To date, however, no study has explored the lifetime risk of AF by
socioeconomic status (SES).
Therefore, to address these gaps, data from over 25 years of follow-up among 15,343
participants in the ARIC study was used to provide estimates of lifetime risk of AF by race and
SES. These estimates can provide a more precise picture of the current and future public health
burden of AF in the growingly diverse US populations.
Research Questions
What is the AF incidence in whites, African Americans, and individuals with distinguished
SES in ARIC cohort? What is the lifetime risk of AF in ARIC cohort? What is the lifetime risk
9 LITERATURE REVIEW
Lifetime risk of AF
A well-cited paper 5 from the Framingham Heart Study in 2004 reported that the lifetime
risk for developing AF is 25%for men and women aged 40 years and older. The study included
3999 men and 4726 women followed from 1968 to 1999. The lifetime risk of AF was estimated
to the age of 95. The study showed that from the index age of 40, the lifetime risk of AF was
26% [95% confidence interval (CI), 24% - 27%] for men and 23% (21% - 24%) for women, but
it did not change significantly with the increase of the index ages. At the age of 80, the lifetime
risk of AF was 23% (20% - 24%) in men and 22% (19% - 23%) in women. Recently, another
analysis 6 from the same cohort of Framingham Heart Study shows that the lifetime risk of AF is
37% after the age of 55 and 22% (95% CI, 15% - 29%) among individuals with low risks and
48% (95% CI, 41% - 55%) with high risks. This recent analysis found a higher lifetime risk of
AF than that reported in 2004 from the same cohort. In Europe, a prospective cohort study
conducted in Sweden 20 found that the lifetime risk of AF was 23% among the male participants
who were followed from the age of 50 to 98 years. The study indicated that among the cohort of
855 men born in 1913, 185 developed AF before the age of 98. Another large European
population-based study 21 demonstrated that the lifetime risk of AF was 24% in men and 22% in
women at the age of 55. This study assessed 6808 participants followed for an average of 6.9
years.
Prevalence and incidence of AF
Studies have shown the AF prevalence and incidence in the white population. A study 7 of
the Framingham Heart Study investigated the 50-year trends of incidence and prevalence of AF
10
the analyses. It found that from 1958 to 2007 the age-adjusted prevalence of AF increased from
20.4 to 96.2 cases per 1000 years in men and from 13.7 to 49.4 cases per 1000
person-years in women and the age-adjusted incidence increased from 3.7 to 13.4 and 2.5 to 8.6 new
cases per 1000 person-years in men and women, respectively. The prevalence of AF diagnosed
by electrocardiograph (ECG) increased from 12.6 in 1958-67 to 25.7 in 1998-2007 per 1000
person-years in men and from 8.1 to 11.8 in women, while the incidence of AF diagnosed by
ECG remained unchanged during the same period. The Sweden study of 855 men 20 reveals that
the prevalence of AF was 0.4% among men aged 50 years, 1.9% by the age of 60, 4.6% by 70,
12.5% by 80, and 15.7% by 90 years old, clearly indicating the prevalence was increasing as
people age. Another prospective European study found that the overall prevalence was 5.5%
(0.7% in the age of 55-59 years and 17.8% in individuals ≥ 85 years) and that the incidence was
1.1 per 1000 person-years in the age of 55-59 and 20.7 per 1000 person-years in the age ≥ 80
years. The study also found that men had higher prevalence and incidence than women.
Other studies also revealed the AF prevalence and incidence in diverse populations. 8, 9 An
analysis 8 of the Atherosclerosis Risk in Communities (ARIC) study found that the crude
incidence rates of AF were 6.7, 4.0, 3.9, and 3.0 per 1000 person-years in white men, white
women, African American men, and African American women, respectively. The risk of AF in
African Americans was lowered 41% (95% CI, 8% - 62%), compared with whites. Another
multi-ethnic study 9 included 6721 participants followed by a mean period of 7.3 years. The
study showed that the AF incidence in Hispanics, Non-Hispanic Blacks, and Chinese was
significantly lower than that in Non-Hispanic Whites. An investigation on the US emergency
room visit and the hospital admission 22 revealed that from 1993 to 2004 there were 2.7 million
11
1000 people during this period. The number of visits was increased 88% over the span of 12
years. Another analysis 24 on patients with pacemakers indicated that the prevalence of AF in
African Americans was 21%, 95% (CI, 20%-23%) and was significantly lower than whites
(26%, 95% CI, 25%-26%).
Health disparity and AF
Studies consistently show the existence of health disparity in the US. African Americans
have greater risks of cardiovascular diseases, such as hypertension and hyperlipidemia, obesity,
and diabetes 10. An analysis 12 of ARIC study confirmed that low family income (< $25K per
year) is associated with increased AF risk (hazard ration 1.45, 95% CI, 1.27 – 1.67), compared
with high income (≥ $50k per year). It also found much higher AF risk (hazard ratio 1.88, 95%
CI, 1.55 – 2.28) in women of low education status than those with high educational level. In
addition, another ARIC study found that the rates of stroke, heart failure, coronary heart disease
(CHD), and mortality were higher in African Americans diagnosed with AF, compared with their
white counterparts. The observed rate differences were distinct among African Americans and
whites. Heart failure and CHD were found to be 1.5 – 2 folds higher in African Americans than
whites. Approximately 56% (95% CI, 48% - 64%) mortality rate difference was observed in
whites with AF and those without AF. For African Americans with AF and without AF, the
difference was 106% (95% CI, 86% - 126%). Moreover, another retrospective study on patients
with AF 32 concluded that the all-cause mortality is associated with SES. The study used the SES
score determined by household income, the value of house unit, occupation, and education as a
predictor of mortality, and found that the AF patients with low SES scores had significantly
12 METHODS
Study population
The basic design of ARIC has been described by other authors. 8, 13 Briefly, the
Atherosclerosis Risk in Communities (ARIC) study is a prospective cohort study for the
investigation of risk factors for cardiovascular diseases. 8, 13 During 1987 to 1989, 15,792
participants (55% women, 27% African Americans) 45 to 64 years old were enrolled in the
study. The participants were sampled from 4 US communities: Washington County, MD; the
northwest suburbs of Minneapolis, MN; Jackson, MS; and Forsyth County, NC. The racial
composition of the cohort reflected the underlying populations, except in Jackson, MS, where
only African Americans were sampled. Baseline information was collected by a phone interview
and a clinical examination. Subsequently, participants were examined 3 times at roughly 3-year
intervals until 1998, with a fifth examination taking place in 2011-2013. During follow-up,
participants were contacted annually by phone to gather information on hospital admission and
verify vital status. The response rates on the triennial exams and the annual phone interview were
93%, 86%, 80%, and >90%, respectively. For this analysis, we included follow-up information
through December 31, 2014. The ARIC study has been approved by the Institutional Review
Boards at the participating institutions. All the participants signed a written informed consent.
Among the 15,792 participants, the following was excluded from the analysis: 48 with
self-reported race of non-white or non-African American and 55 African Americans in the study
centers of MN and MD because of the small sample sizes; 37 with AF or atrial flutter diagnosed
by ECG at the baseline visit; and 310 whose ECG was missing or unreadable at the baseline
13
family income and education,893 whose income information was missing and 24 whose
education information missing were excluded, respectively, in the corresponding analysis.
Incidence of AF events
The ascertainment method for AF has been reported previously. 8, 12 In brief, AF was
identified by three sources: ECGs from follow-up exams, hospital discharge records, and death
certificates. ECGs during follow-up exams were done with MAC PC personal Cardiographs. All
ECGs were transmitted to the ARIC ECG reading center for coding, interpretation, and storage.
A trained cardiologist visually read recordings of ECGs automatically coded as AF for the
certainty of the diagnosis. Also, hospitalization information was obtained during the annual
follow-up interview and from surveillance of local hospitals. In ARIC, a trained abstractor
accessed the hospital discharge records and recorded all the diagnoses according to International
Classification of Diseases, Ninth Revision Clinical Modification (ICD-9-CM). AF was defined if
codes 427.31 or 427.32 were present in the absence of procedure codes for open heart surgery.
Finally, information on death from any cause was collected by calling participant’s proxy, or
from obituaries, hospital records, death certificates, or vital statistics from the National Death
Index. 14 Cases of AF were identified from death certificates if ICD-10 code I48 or ICD-9 code
427.3 were listed as one of the causes of death. The validity of this approach for AF event
identification, with a positive predictive value of approximately 90%, has been demonstrated
previously. 8
The incidence date of AF was defined as the first occurrence of AF in an ECG during
follow-up exam, a hospital discharge record, or death certificate. 8
14
The total family income and individual education level were self-reported during the
baseline visit conducted by ARIC researchers. For the analysis, the total family income was
categorized into three groups: < $25,000 per year; $25,000 to < $50,000 per year; and ≥ $50,000
per year. In subgroup analysis related to African Americans, the last two groups were combined
into one as ≥ $25,000 per year due to the small number of African American participants with
reported income ≥ $50,000. Education level was also categorized into three groups: Basic – less
than high school; Intermediate – high school or equivalent; and High– completed at least some
college education.
Risk factors for cardiovascular disease were measured at baseline. Smoking status was
self-reported. Participant’s height was measured without wearing shoes, and weight wearing
light clothing. Blood pressure was measured three times at each visit after a 5-minute rest and in
sitting position. The average of the last two measurements was used for the study. Blood
pressure ≥ 140/90 mmHg or taking medications for hypertension was defined as hypertension.
As it has been used in other studies, fasting blood glucose ≥ 126 mg/dl, non-fasting blood
glucose ≥ 200 mg/dl, current treatment for diabetes, or self-reported physician-diagnosis of
diabetes was defined as diabetes mellitus. 15 Self-reported history of myocardial infarction (MI)
or electrocardiographic evidence of prior MI was characterized as prevalent MI. 15 Prevalent
heart failure (HF) was identified using the Gothenburg criteria, or treatment of HF in the past
two weeks at baseline. 15, 17
To study the association of short-time risk of AF with lifetime risk, the individual
predicted 5-year risk of AF was calculated based on a previously described predictive risk
model. 18 The model includes the following variables: age (years divided by 5), race (white or
15
pressure (10 mmHg), smoking status (current), the presence of treatment of hypertension with
medications (yes), diabetes (yes), HF (yes), and history of MI (yes). It can be calculated as
1 – 0.9718412736exp(ΣβX – 12.5815600). 18
Statistical analysis
Participants’ characteristics at baseline are presented as percentages for the categorized
variables and mean (standard deviation) for the continuous and stratified by race.
Age-specific rates of AF by 10-year group for age 45-54, and 5-year groups starting at age
55 through age 92 (oldest attained age) were computed. Incidence rates were calculated dividing
the number of new cases in an age-specific group by the corresponding person-years of
follow-up. Person-years of follow-up were defined from the date of visit 1 to the first diagnosis of AF,
death, loss of follow-up, or December 31, 2014, whichever occurred first. The crude incidence
rate was calculated as the total number of AF events divided by total person-years of follow-up.
Rates were age-standardized using the age-specific distribution of person-years in the entire
cohort as the standard population.
The modified Kaplan-Meier method was used to account for the competing risk of death
by calculating the lifetime risk of AF (cumulative incidence through oldest attained age in the
cohort), as reported previously. 19 In the computation of cumulative incidence adjusted for
competing risk, the survival analysis was performed by taking death into account as the event of
interest together with AF but not censored. Survival free of AF and being alive was a more
appropriate condition than being free of AF but not alive when death was censored. Lifetime risk
through age 92 (oldest age at which an AF event occurred in the cohort) starting at the index age
45, 55, 65, and 75 was calculated. The separate calculations by race, sex, total family income,
16
were conducted. This later analysis was performed to estimate lifetime risk of AF across
categories of short-term (5-year) AF risk.
17 RESULTS
Characteristics of participants at baseline
There were 15,343 participants aged 45-64 years and without AF at baseline. Table 1
shows participants’ characteristics by race and sex, while Table 2 reports characteristics by race,
family income, and education. African Americans had the higher prevalence of cardiovascular
events than whites, while white men had higher predicted 5-year risk of AF than other groups.
As shown in Table 2, among both whites and African Americans, the lower income groups had a
higher proportion of women (63% in whites and 67% in African Americans) compared to the
other income groups, and those in the lowest categories of income and education had more
adverse cardiovascular risk factors: higher systolic blood pressure (SBP) and higher prevalence
of hypertension, diabetes, HF, and MI, and smoking. Overall, higher income and education were
correlated with more favorable cardiovascular profile, and across categories of income and
education, whites had a lower prevalence of cardiovascular risk factors than African Americans.
AF incidence and lifetime risk by race and sex
The average follow-up period was 21 (+7SD) years. During the 1987 – 2014, follow-up
period, 2,790 new cases of AF (2,270 in whites and 520 in African Americans) were identified.
Incidence rates of AF rose with age across all gender and race groups, whites showing a higher
rate (9.1 per 1,000 person-years) than African Americans (6.8 per 1,000 person-years) overall.
Table 3 presents the age-, race-, and sex-specific incidence rates of AF per 1,000 person-years
from 1987 to 2014. Age-standardized rates were highest (11.3 per 1,000 person-years) among
white men (WM) and lowest (6.1 per 1,000 person-years) among African American women
18
AAW, African American men (AAM), and white women (WW) were 0.54 (0.47, 0.61), 0.71
(0.62, 0.83), and 0.64 (0.59, 0.70), respectively.
The lifetime risk of AF at the age 45 to 92 in whites was 33% and in African Americans
21%, or approximately 1 in 3 and 1 in 5, respectively. Lifetime risk was 36% in WM, 30% in
WW, 21% in AAM, and 22% in AAW. Table 4 displays the lifetime risk by race and sex at the
index age of 45, 55, 65, and 75. The lifetime risk of AF remained almost constant from index age
45 to 65, with slightly smaller values after index age 75. Figure 1 shows the cumulative
incidence of AF from age 45 to 92 by race and sex.
AF incidence and lifetime risk by income and education
Table 5 shows the age-, race-, income-, and education-specific AF incidence rates per
1,000 person-years from 1987 to 2014. Overall, regardless of race and sex, AF incidence rates
decreased as income and education increase. Compared to those with the lowest income,
individuals in the highest income category had age-standardized relative rate reduction of 24%
(WM), 30% (WW), 20% (AAM), and 27% (AAW). Corresponding values for high education
versus low education were 21%, 43%, 29%, and 37% in WM, WW, AAM, and AAW,
respectively.
Table 6 provides lifetime risk of AF by race, sex, income, and education conditional on
survival free of AF from index age 45 to 75. In contrast to the clear association of higher income
and education with lower rates of AF, lifetime risk of AF was higher in those with higher income
and education. The only exception was estimates among WW, in which those with higher
income and education had lower lifetime risk of AF than their more socioeconomically
disadvantaged counterparts. Figure 2 presents the cumulative incidence of AF from age 45 to 92
19
cumulative incidence of AF is lower among those with higher income and education, but that
trend is reversed after the age of 80 years. The only exception was WW who experienced lower
AF cumulative incidence from the lowest to the highest categories of income and education
during their entire lifetime.
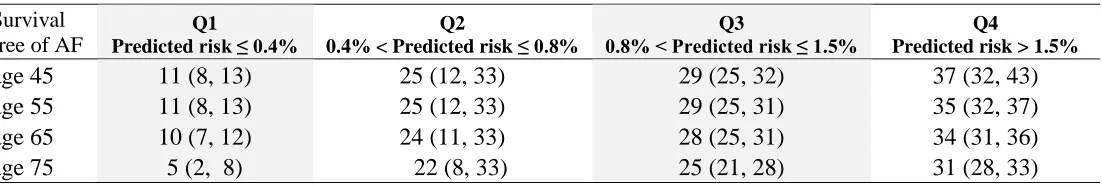
Lifetime risk of AF by predicted AF risk
With the purpose of estimating long-term risk of AF across categories of short-term
predicted AF risk, an estimate of the lifetime risk of AF by quartiles of the predicted 5-year AF
risk was calculated from the predictive model at baseline (see methods for variables included in
the predictive model). Lifetime risk across quartiles of predicted 5-year risk at baseline was 11%
for those with predicted risk ≤ 0.4%, 25% for predicted risk > 0.4% and ≤ 0.8%, 29% for
predicted risk > 0.8% and ≤ 1.5%, and 37% for those with predicted risk > 1.5%, as shown in
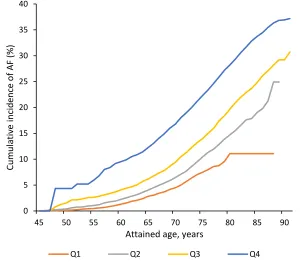
Table 7. Figure 3 presents the cumulative incidence of AF by quartiles of predicted 5-year risk of
AF during age 45-92. The cumulative incidence positively increased with the predicted risk. The
individuals having the highest predicted risk of AF showed more dramatic increase of
cumulative incidence from age 45 to 92 compared to their counterparts who possessed lower
20 DISCUSSION AND CONCLUSION
In this analysis of 15,343 men and women followed for an average of 21 years, estimated
lifetime risk of developing AF was approximately 1 in 3 among whites and 1 in 5 among African
Americans. The higher rates of AF with old age, among whites, and in individuals with lower
socioeconomic status was observed. In contrast, the lifetime risk of AF was lower in individuals
with low versus high socioeconomic status in most race-sex groups, possibly due to longer
survival among the socioeconomically advantaged. Even among those with the lowest short-term
predicted risk of AF, lifetime risk was considerable (>10%).
The current results complement those from an earlier analysis of the ARIC cohort with
follow-up through 2004 (compared to 2014 in the present analysis). 8 The overall results from the
two analyses are consistent, showing higher incidence rates of AF in whites than in African
Americans, in men than in women, and exponential rate increases with age. However, because of
more incident AF cases in the older cohort due to the extended follow-up, the crude incidence
rates of AF increased from 6.7 to 11.5 per 1,000 person-years in white men, from 4.0 to 7.5 in
white women, from 3.9 to 7.2 in African American men, and from 3.0 to 5.7 in African
American women, compared with the previous ARIC report. 8
AF incidence rates in white men and white women in the ARIC cohort are comparable to
the rates reported in a recent analysis of the Framingham Heart Study, 7 reflecting the general
occurrence of AF in the white population in the US. Also, it was found that AF lifetime risk is
around 1 in 3 in whites (36% in white men and 30% in white women) after the age of 45 years,
which is higher than the lifetime risks reported in a previous analysis of the Framingham Heart
Study, 5 the Swedish Study of Men Born in 1913, 20 and the Dutch Rotterdam Study,21 but
21
partially be attributed to enhanced surveillance for and awareness of AF in the community. 7 Of
note, follow-up in the older Framingham Heart Study and Rotterdam Study publications ended
before the year 2000. 5, 21 Also, differences in AF risk factors and lifestyles across cohorts might
explain the differences. For example, the prevalence of diabetes and MI in the ARIC cohort was
higher than that in the Rotterdam Study. 21 Differences in the lifetime risk of AF between the
current ARIC report and the recent Framingham Heart Study 6 can be explained by
dissimilarities in the ascertainment of AF, which rely mostly in hospitalizations in ARIC, while
the Framingham Heart Study had access to outpatient medical records.
Multiple studies have demonstrated that African Americans have lower incidence of AF
than whites. In an earlier analysis of the ARIC study, it was found that AF rates in African
Americans were 41% lower compared to whites after an average 15-year follow-up. 8 The same
results have been found in different cohorts. 22 – 28 Complementing previous studies, I now show
that African Americans have lower lifetime risk of AF than whites, despite higher prevalence of
AF risk factors. However, notwithstanding their lower lifetime risk, still 1 in 5 African
Americans in ARIC were estimated to develop AF during their lifetime, certainly not a trivial
figure. It was also found that unlike whites, African American women had a slightly increased
lifetime risk compared to African American men. The reason might be that African American
women could live longer to very old age to have more chance of developing AF than African
American men. In fact, African American women have lower all-cause mortality and longer life
expectancy than African American men. 29
Prior research has reported higher rates of cardiovascular disease, including AF, among
those with lower SES. 30 – 34 As expected, I found that age-standardized incidence rates of AF
22
sex. The findings here are consistent with a previous ARIC report that specifically focused on
examining the association between SES and AF incidence. 12
In contrast to the inverse association of SES with AF rates, I found that AF lifetime risk
increased with income in WM, AAM, and AAW, and with education in WM and AAM. In this
analysis, it was found that cumulative incidence of AF was generally lower earlier in life among
those with higher income but increased substantially in the last decade of life among those with
higher SES. Consistent with my findings, a prior study showed that the association between
mortality risk and SES was attenuated in older people. 34 One potential explanation for this
observation is the impact of mortality as a competing risk disproportionally affecting the
socioeconomically disadvantaged groups. As shown in this analysis, ARIC participants in the
lowest ranks of income and education had the highest prevalence of cardiovascular risk factors.
Consequently, mortality would be higher in people with low income and education compared to
others and, therefore, fewer people in low income and education would survive to old age to
have a chance to develop AF. This may result in more AF in people with high income and
education at the very late stage of life. In summary, estimates of lifetime risk of AF across SES
groups may be problematic because it could mask actual socioeconomic disparities in the
incidence of the arrhythmia.
The findings have significant implications for public health. The observation that 1 in 3
whites and 1 in 5 African Americans will develop AF during their lifetime underscore the high
burden of AF in the community. The increased number of AF patients has brought about an
increased demand for anticoagulation treatment for stroke prevention, 35 and highlights the need
for more randomized trials to evaluate strategies to reduce risk of ischemic events associated
23
persons affected by AF. 37 – 40 Hence, novel prevention approaches for AF and its complications
are urgently needed overall and specifically in low SES individuals and other vulnerable groups,
such as African Americans, who experience more AF-related adverse clinical outcomes. 14
Strengths and limitations
This study is the first to report the lifetime risk of AF in African Americans. It takes
advantage of the data available in the ARIC cohort, one of the longest follow-up studies in a
large biracial population in the US. In addition to the diverse population, the large number of AF
events, and the extended follow-up, other strengths include the excellent cohort retention and the
careful methodology for ascertainment of cardiovascular events and mortality.
There are certain limitations in the study. More importantly, ascertainment of AF is likely to
be incomplete since asymptomatic cases and those exclusively managed in the outpatient settings
were missing. False negatives of AF possibly existed because the cardiologist was not visually
examining the negative ECGs. Also, AF can be intermittent, and therefore may not be detected
with a standard 10-second ECG and hospitalizations. In addition, the information on education
and total family income was self-reported and collected only at baseline. Although the individual
education status might not change after baseline, the total family income of some participants
could change during the > 20 years of follow-up. While the total family income of other
participants remained constant, this change might affect the result of the analysis. Moreover, the
impact of education and income in the ARIC study reflects the experience of a cohort born
between the 1920s to early 1940s, which may be different from those of later cohorts.
Conclusions
Lifetime risk of AF in a contemporary cohort is approximately 36% among whites, higher
24
the public health impact of AF and can be used to raise awareness of this common condition
among the population. The findings also emphasize the importance of developing programs on
25 REFERENCES
1. January CT, Wann LS, Alpert JS, et al. 2014 AHA/ACC/HRS guideline for the management
of patients with atrial fibrillation. JACC. 2014;64(21):2246-2280.
2. Mozaffarian D, Benjamin EJ, Go AS, et al. Heart disease and stroke statistics—2015 update: a
report from the American Heart Association. Circulation. 2015;131(4):e29-e322.
3. Ruddox V, Sandven I, Munkhaugen J, Skattebu J, Edvadsen T, Otterstad JE. Atrial fibrillation
and the risk for myocardial infarction, all-cause mortality and heart failure: A systemic review
and meta-analysis [published online January 1, 2017]. Eur J Prev Cardiol.
doi:10.1177/2047487317715769.
4. Ceomodolea AD, Bal R, Severens JL. Epidemiology and management of atrial fibrillation and
stroke: review of data from four European countries [published online May 8, 2017]. Stroke
Res Treat. doi:10.1155/2017/8593207.
5. Lloyd-Jones DM, Wang TJ, Leip EP, et al. Lifetime risk for development of atrial fibrillation.
The Framingham Heart Study. Circulation. 2004;110(9):1042-1046.
6. Weng LC, Preis SR, Hulme OL, et al. Genetic Predisposition, Clinical Risk Factor Burden,
and Lifetime Risk of Atrial Fibrillation. Circulation. 2017; doi:
10.1161/CIRCULATIONAHA.117.031431.
7. Schnabel RB, Yin X, Gona P, et al. 50 year trends in atrial fibrillation prevalence, incidence,
risk factors, and mortality in the Framingham Heart Study: a cohort study. Lancet.
2015;386:154-162.
8. Alonso A, Agarwal SK, Soliman EZ, et al. Incidence of atrial fibrillation in whites and
African-Americans: the Atherosclerosis Risk in Communities (ARIC) study. Am Heart J.
26
9. Rodrigues CJ, Soliman EZ, Alonso A, et al. Atrial fibrillation incidence and risk factors in
relation to race-ethnicity and the population attributable fraction of atrial fibrillation risk
factors: the Multi-Ethnic Study of Atherosclerosis. Ann Epipemiol. 2015;25:71-77.
10. Mouton CP, Hayden M, Southland JH. Cardiovascular health disparities in underserved
populations. Prim Care. 2017;44(1):e37-e71.
11. Kokubo Y, Matsumoto C. Traditional cardiovascular risk factors for incident atrial
fibrillation. Cric J. 2016;80(12):2415-2422.
12. Misialek JR, Rose KM, Everson-Rose SA, et al. Socioeconomic status and the incidence of
atrial fibrillation in whites and blacks: the Atherosclerosis Risk in Communities (ARIC)
study. J Am Heart Assoc. 2014;3(4):e001159.
13. The ARIC investigators. The Atherosclerosis Risk in Communities (ARIC) study: design and
objectives. Am J Epidemiol. 1989;129(4):687-702.
14. Magnani JW, Norby FL, Agarwal SK, et al. Racial differences in atrial fibrillation-related
cardiovascular disease and mortality: the Atherosclerosis Risk in Communities (ARIC)
study. JAMA Cardiol. 2016;1(4):433-441.
15. Kwon Y, Norby FL, Jensen PN, et al. Association of smoking, alcohol, and obesity with
cardiovascular death and ischemic stroke in atrial fibrillation: the Atherosclerosis Risk in
Communities (ARIC) study and Cardiovascular Health Study (CHS). PloS One.
2016;11(1):e0147065.
16. White AD, Folsom AR, Chambless LE, et al. Community surveillance of coronary heart
disease in the atherosclerosis risk in communities (ARIC) study: methods and initial two
27
17. Larriva AP, Norby FL, Chen LY, et al. Circulating ceruloplasmin, ceruloplasmin-associated
genes, and the incidence of atrial fibrillaition in the atherosclerosis risk in communities study
[published online August 15, 2017]. Int J Cardiol. doi:10.1016/j.ijcard.2017.04.005.
18. Alonso A, Krijthe BP, Aspelund T, et al. Simple risk model predicts incidence of atrial
fibrillation in a racially and geographically diverse population: the CHARGE-AF
consortium. J Am Heart Assoc. 2013;2(2):e000102.
19. Beiser A, D’Agostino RB, Sr., Seshadri S, Sullivan LM, Wolf PA. Computing estimates of
incidence, including lifetime risk: Alzheimer’s disease in the Framingham study. The
practical incidence estimators (PIE) macro. Stat Med. 2000;19:1495-1522.
20. Mandalenakis Z, Koch LV, Eriksson H, et al. The risk of atrial fibrillation in the general male
population: a lifetime follow-up of 50-year-old men. Europace. 2015;17(7):1018-1022.
21. Heeringa J, Hofman D, Kors JA, et al. Prevalence, incidence and lifetime risk of atrial
fibrillation: the Rotterdam study. Eur Heart J. 2006;27(8):949-953.
22. McDonald AJ, Pelletier AJ, Ellinor PT, Camargo CA. Increasing US emergency department
visit rates and subsequent hospital admission for atrial fibrillation from 1993 to 2004. Ann
Emerg Med. 2008;51(1):58-65.
23. Alonso A, Roetker NS, Soliman EZ, Chen LY, Greenland P, Heckbert SR. Prediction of
atrial fibrillation in a racially diverse cohort: the multi-ethnic study of atherosclerosis
(MESA). J Am Heart Assoc. 2016;5(2):e003077.
24. Kamel H, Kleindorfer DO, Bhave PD, et al. Rates of atrial fibrillation in black versus white
patients with pacemakers. J Am Heart Assoc. 2016;5(2):e002492.
25. Dewland TA, Olgin JE, Vittinghoff E, Marcus GM. Incident atrial fibrillation among Asians,
28
26. Rodriguez F, Stefanick ML, Greenland P, et al. Racial and ethnic differences in atrila
fibrillation risk factors and predictors in women: findings from the women’s health initiative.
Am Heart J. 2016;176:70-77.
27. Rodriguez CJ, Soliman EZ, Alonso A, et al. Atrial fibrillation incidence and risk factors in
relation to race/ethnicity and the population attributable fraction of atrial fibrillation risk
factors: the Multi-Ethnic Study of Atherosclerosis. Ann Epidemiol. 2015;25(2):71-76.
28. Gvadebo TD, Okafor H, Darbar D. Differential impact of race and risk factors on incidence
of atrial fibrillation. Am Heart J. 2011;162(1):31-37.
29. Xu J, Murphy SL, Kochanek KD, Arias E. Mortality in the United States, 2015. NCHS Data
Brief. 2016 Dec;(267):1-8.
30. Wendell CR, Waldstein SR, Evans MK, Zonderman AB. Distribution of subclinical
cardiovascular disease in a socioeconomically and racially diverse sample. Stroke.
2017;48(4):850-856.
31. Quispe R, Benziger CP, Bazo-Alvarez JC, et al. The relationship between socioeconomic
status and CV risk factors. Glob Heart. 2016;11(1):121-130.
32. Kargoli F, Shulman E, Aagaard P, et al. Socioeconomic status as a predictor of mortality in
patients admitted with atrial fibrillation. Am J Cardiol. 2017;119(9):1378-1381.
33. Shulman E, Kargoli F, Aagaard P, et al. Socioeconomic status and the development of atrial
fibrillation in Hispanics, African Americans and non-Hispanic whites [published online June
9, 2017]. Clin Cardiol. doi:10.1002/clc.22732.
34. Gu D, Yang F, Sautter J. Socioeconomic status as a moderator between frailty and mortality
at old ages [published online August 9, 2016]. BMC Geriatr.
29
35. Ashburner JM, Singer DE, Lubitz SA, Borowsky LH, Atlas SJ. Changes in Use of
Anticoagulation in Patients With Atrial Fibrillation Within a Primary Care Network
Associated With the Introduction of Direct Oral Anticoagulants. Am J Cardiol.
2017;120(5):786-791.
36. Lemesle G, Ducrocq G, Elbez Y, et al. Vitamin K antagonists with or without long-term
antiplatelet therapy in outpatients with stable coronary artery disease and atrial fibrillation:
Association with ischemic and bleeding events [published online July 10, 2017]. Clin
Cardiol. doi:10.1002/clc.22750.
37. Wolf PA, Abbott RD, Kannel WB. Atrial fibrillation as an independent risk factor for stroke:
the Framingham Study. Stroke. 1991;22(8):983–988.
38. Wang TJ, Larson MG, Levy D, et al. Temporal relations of atrial fibrillation and congestive
heart failure and their joint influence on mortality: the Framingham Heart Study. Circulation.
2003;107(23):2920–2925.
39. Benjamin EJ, Wolf PA, D’Agostino RB, Silbershatz H, Kannel WB, Levy D. Impact of atrial
fibrillation on the risk of death: the Framingham Heart Study. Circulation. 1998;98(10):946–
952.
40. Conen D, Chae CU, Glynn RJ, et al. Risk of death and cardiovascular events in initially
healthy women with new-onset atrial fibrillation. JAMA. 2011;305(20):2080–2087.
41. Colilla S, Crow A, Petkun W, Singer DE, Simon T, Liu X. Estimates of current and future
incidence and prevalence of atrial fibrillation in the US adult population. Am J Cardiol. 2013;
112(8):1142-1147.
42. Kokubo Y, Matsumoto C. Traditional Cardiovascular Risk Factors for Incident Atrial
30
Table 1. Baseline characteristics of participants, Atherosclerosis Risk in Communities Study, 1987-1989
White men White women
African American men
African American women
N 5332 5948 1539 2524
Incidence AF cases 1263 1009 212 309
Age, years 55 (6) 54 (6) 54 (6) 53 (6)
% 35 39 10 16
Height, cm 176 (7) 162 (6) 176 (7) 163 (6)
Weight, kg 85 (14) 70 (15) 85 (17) 82 (18)
BMI 27 (4) 27 (6) 28 (5) 31 (7)
SBP, mmHg, mean 120 (16) 117 (18) 130 (22) 128 (22)
DBP, mmHg, mean 73 (10) 70 (10) 82 (13) 78 (12)
Smoking, % 25 25 38 25
Antihypertension therapy, % 20 20 34 45
Prevalence of diabetes, % 10 8 18 21
Prevalence of HF, % 3 5 5 9
Prior MI, % 7 1 5 3
Predictive 5-year risk, % 0.02 (0.02) 0.01 (0.01) 0.01 (0.01) 0.01 (0.01)
Estimated glomerular
filtration rate 97 (13) 101 (12) 107 (19) 110 (20)
31
Table 2. Baseline Characteristics of participants by race, family income, and education, Atherosclerosis Risk in Communities Study, 1987 - 1989
Whites (n=11,280)
Total Family Income Education Levels
<$25K $25K-<$50K ≥$50K Basic Median High
N 2874 4569 3337 1844 4890 4046
% of total 26.7 42.4 31 17.1 45.4 37.5
AF cases 683 917 58 491 1007 768
Age, years 57(6) 54(6) 53(5) 56(5) 54(6) 54(6)
% of female 62 51 46 50 59 46
Height (women), cm 161(6) 162(6) 163(6) 160(6) 162(6) 163(6)
Height (men), cm 174(7) 176(7) 178(6) 174 (6) 176(7) 178(6)
Weight, kg 76(16) 78 (16) 78 (16) 78 (16) 76(16) 78(16)
BMI 28(5) 27(5) 26(4) 28(5) 27(5) 27(4)
SBP, mmHg 122(18) 119 (17) 116 (16) 122 (18) 119(17) 117(16)
DBP, mmHg 71(10) 72(10) 72(10) 71(10) 72(10) 72(10)
Smoking, % 30 25 20 35 26 19
AT, % 26 20 15 26 21 16
P. of diabetes, % 14 9 6 15 9 7
P. of HF, % 6 3 2 6 4 3
Prior MI, % 6 4 3 8 4 3
African-Americans (n=4,063)
<$25K ≥$25K Basic Median High
N 2598 1055 1529 1035 1089
% of total 71.1 28.9 41.9 28.3 29.8
AF cases 366 26 258 142 119
Age, years 54(6) 52(5) 55 (6) 53 (6) 52 (6)
% of female 67 52 60 65 63
Height (women), cm 163(6) 164(6) 163 (6) 163 (6) 164 (6)
Height (men), cm 176(7) 177(7) 176 (7) 176 (7) 177 (7)
Weight, kg 83(18) 83(16) 84 (18) 83 (17) 82 (17)
BMI 30(6) 29(5) 30(7) 30(6) 29(6)
SBP, mmHg 131(22) 125(19) 132 (22) 128 (23) 126 (19)
DBP, mmHg 80(12) 79(12) 80 (13) 79 (13) 79 (12)
Smoking, % 32 25 34 29 25
AT, % 44 34 46 38 36
P. of diabetes, % 23 13 25 19 15
P. of HF, % 9 3 10 7 4
Prior MI, % 4 2 5 4 2
Values corresponding to mean (standard deviation) or percentages.
32
33
Table 3. Age-, race-, and sex-specific incidence rates of AF per 1000 person-years, Atherosclerosis Risk in Communities Study, 1987-2014
White men White women African American men
African American women
Age group
N. AF
Person- Years IR
N. AF
Person-
years IR
N. AF
Person-
years IR
N. AF
Person-
years IR
45-54 25 13355 1.9 9 17483 0.5 4 4681 0.7 4 8397 0.5
55-59 66 16223 4.1 30 19809 1.5 11 4817 2.3 13 8781 1.5
60-64 132 21855 6.0 84 25581 3.3 23 5983 3.8 31 10641 2.9
65-69 220 22324 9.9 169 26341 6.4 42 5952 7.1 56 10606 5.3 70-74 279 18143 15.4 241 22001 11.0 51 4481 11.4 74 8449 8.8
75-79 267 11198 23.8 224 13808 16.2 47 2378 19.8 68 4692 14.5
80-84 198 5118 38.7 178 6605 26.9 24 943 25.5 40 2107 19.0
85-89 73 1255 58.2 73 1904 38.4 10 233 42.9 21 557 37.7
Crude rate 1262 109514 11.5 1008 133602 7.5 212 29478 7.2 308 54250 5.7
Age-adjusted rate 11.3 7.3 8.1 6.1
RR (95%CI)* 1 (Ref.) 0.64 (0.59, 0.70) 0.71 (0.62, 0.83) 0.54 (0.47, 0.61)
34
Table 4. Estimates (95% confidence intervals) of race- and sex-specific lifetime risk of AF conditional on survival free of AF to age 45, 55, 65, or 75, Atherosclerosis Risk in Communities study, 1987-2014.
Survival
free of AF White men White women African American men African American women
age 45 36 (32, 38) 30 (26, 32) 21 (13, 24) 22 (16, 25)
age 55 36 (32, 38) 30 (27, 32) 21 (13, 24) 22 (16, 25)
age 65 35 (31, 37) 30 (26, 32) 22 (14, 26) 23 (17, 26)
age 75 32 (28, 35) 26 (23, 29) 21 (12, 26) 21 (15, 26)
35
Table 5. Age-, race-, sex-, income-, and education-specific incidence rates of AF per 1000 person-years, Atherosclerosis Risk in Communities Study, 1987-2014
White men White women African American men African American women
Age group <$25
K
$25K-<$50K ≥$50K <$25K
$25K-<$50K ≥$50K <$25K ≥$25K <$25 ≥$25K
45-54 1.3 2.1 1.6 0.9 0.7 0.2 0.9 0.8 0.6 0.3
55-59 6.9 4.2 2.6 1.5 2.1 0.8 1.3 3.3 2.1 0.3
60-64 7.1 6.0 5.7 2.7 3.4 3.4 5.1 2.5 3.8 1.1
65-69 14.8 9.5 7.2 10.0 5.9 3.7 7.1 7.0 5.2 5.5
70-74 19.3 14.6 14.8 12.4 10.4 9.7 13.4 9.1 9.1 8.1
75-79 27.3 24.1 22.2 19.3 16.0 14.2 24.1 14.3 16.7 9.0
80-84 30.6 41.5 41.0 31.8 23.6 23.4 28.1 21.4 22.4 9.1
85-89 78.9 43.3 61.2 38.3 40.3 38.4 31.5 67.1 30.6 70.7
Rate* 13.7 11.1 10.4 8.7 7.1 6.0 8.9 7.2 6.7 4.9
RR (95%CI) ** 1 (Ref.) 0.81 (0.70, 0.94) 0.76 (0.65, 0.88) 1 (Ref.) 0.82 (0.71, 0.94) 0.70 (0.59, 0.83) 1 (Ref.) 0.80 (0.60, 1.07) 1 (Ref.) 0.73 (0.56, 0.96) Age group Basic Median High Basic Median High Basic Median High Basic Median High
45-54 2.2 1.2 2.4 1.6 0.6 0.1 0.7 0.7 1.1 0.4 0.4 0.6
55-59 4.1 5 3.2 3.0 1.4 1.2 1.1 3.8 2.3 1.0 1.9 1.7
60-64 6.5 6.2 5.7 4.9 3.2 2.7 4.1 7.2 1.0 4.9 2.8 0.6
65-69 12.7 11.1 7.7 11.0 6.1 4.7 7.8 9.6 4.2 7.8 4.2 3.3
70-74 15.9 16.9 13.9 15.1 10.6 9.6 11.5 13.1 10.1 10.0 10.0 5.7
75-79 25.7 26.3 20.9 25.0 15.5 12.7 25.9 15.3 13.7 15.3 11.2 16.5
80-84 41.7 35.9 38.7 27.7 26.7 27.0 30.0 18.5 23.1 22.7 19.4 12.2
85-89 65.2 62.1 51.4 51.5 39.5 28.2 45.8 19.2 60.0 41.8 29.8 39.7
Rate* 12.5 12.1 10.2 10.6 7.1 6.0 8.9 8.7 6.3 7.4 5.7 4.7 RR (95%CI) *** 1 (Ref.) 0.96 (0.83, 1.12) 0.81 (0.70, 0.94) 1 (Ref.) 0.67 (0.57, 0.78) 0.57 (0.48, 0.68) 1 (Ref.) 0.97 (0.70, 1.35) 0.71 (0.5, 1.00) 1 (Ref.) 0.77 (0.59, 1.00) 0.63 (0.48, 0.84)
Basic – did not complete high school; Median – completed high school or equivalent; High – completed at least some college education.
* Age-adjusted rate.
36
Table 6. Estimates (95% confidence intervals) of race-, sex, income-, and education-specific lifetime risk of AF conditional on survival free of AF to age 45, 55, 65, and 75, Atherosclerosis Risk in Communities study, 1987-2014
White men White women African American men African American women
Survival
free of AF <$25K
$25K -
<$50K ≥$50K <$25K
$25K -
<$50K ≥$50K <$25K ≥$25K <$25K ≥$25K
age 45 33 (26, 37) 35 (30, 38) 40 (32, 45) 31 (26, 34) 28 (24, 31) 28 (20, 34) 19 (10, 22) 25 (6, 31) 21 (15, 24) 26 (2, 37) age 55 34 (27, 38) 34 (29, 37) 40 (32, 45) 31 (26, 34) 29 (24, 32) 28 (20, 35) 19 (11, 23) 25 (6, 32) 22 (16, 25) 26 (3, 38) age 65 33 (26, 37) 33 (28, 36) 39 (31, 45) 32 (27, 35) 28 (23, 31) 28 (19, 34) 21 (12, 25) 25 (6, 33) 22 (16, 25) 28 (4, 40) age 75 30 (22, 35) 30 (24, 34) 37 (28, 44) 29 (23, 33) 24 (19, 28) 25 (15, 32) 21 (11, 26) 24 (4, 34) 21 (15, 26) 26 (1, 41) Survival
free of AF Basic Median High Basic Median High Basic Median High Basic Median High
age 45 34 (26, 38) 37 (31, 40) 36 (30, 39) 35 (28, 40) 29 (25, 32) 27 (21, 30) 19 (10, 23) 21 (3, 27) 24 (1, 33) 23 (14, 27) 20 (9, 26) 19 (10, 25) age 55 33 (25, 37) 37 (31, 40) 35 (30, 39) 34.6 (27, 39) 29 (25, 32) 27 (21, 31) 20 (11, 24) 21 (3, 27) 24 (0, 33) 23 (14, 27) 22 (10, 28) 19 (10, 25) age 65 33 (25, 37) 36 (30, 39) 34 (28, 38) 35 (28, 40) 29 (24, 32) 26 (21, 31) 22 (13, 27) 20 (1, 27) 25 (1, 35) 24 (15, 29) 22 (10, 28) 20 (10, 26) age 75 32 (23, 38) 33 (26, 37) 32 (25, 36) 31 (23, 37) 26 (21, 29) 23 (17, 28) 24 (13, 30) 16 (0, 26) 24 (0, 38) 23 (13, 29) 20 (7, 28) 19 (9, 26) Basic – did not complete high school; Median – completed high school or equivalent; High – completed
37
Table 7. Estimates (95% confidence intervals) of lifetime risk of AF conditional on survival free of AF to age 45, 55, 65, or 75 by quartiles of 5-year predicted risk, Atherosclerosis Risk in Communities Study, 1987-2014
Survival free of AF
Q1
Predicted risk ≤ 0.4%
Q2
0.4% < Predicted risk ≤ 0.8%
Q3
0.8% < Predicted risk ≤ 1.5%
Q4
Predicted risk > 1.5%
age 45 11 (8, 13) 25 (12, 33) 29 (25, 32) 37 (32, 43)
age 55 11 (8, 13) 25 (12, 33) 29 (25, 31) 35 (32, 37)
age 65 10 (7, 12) 24 (11, 33) 28 (25, 31) 34 (31, 36)
38
Figure 1. Race- and sex-specific cumulative incidence of AF, Atherosclerosis Risk in Communities Study, 1987-2014.
Lifetime risk is cumulative risk through 92 years of age.
AAM: African American men; AAW: African American women; WM: white men; WW: white women
0 5 10 15 20 25 30 35 40
45 50 55 60 65 70 75 80 85 90
Cumu
lat
iv
e
in
ciden
ce
o
f
AF (%
)
Attained age, years
39
Figure 2. Cumulative incidence of AF from age 45 to 92 by income, education, race and sex, Atherosclerosis Risk in Communities Study, 1987-2014.
A: By income categories in whites. B: By income categories in African Americans. C: By education categories in whites. D: By education categories in African Americans.
AAM: African American men. AAW: African American women. WM: white men. WW: white women. 0 5 10 15 20 25 30 35 40 45
45 50 55 60 65 70 75 80 85 90
Cumu lat iv e In ciden ce o f AF (% )
Attained age, Years
A
WM < $25K WM $25K - < $50K
WM ≥ $50K WW < $25K
WW $25K - <$50K WW ≥ $50K
0 5 10 15 20 25 30
45 50 55 60 65 70 75 80 85 90
Cumu lat iv e in ciden ce o f AF (% )
Attained age, years
B
AAM < $25K AAM ≥ $25K AAW < $25K AAW ≥ $25K
0 5 10 15 20 25 30 35 40 45
45 50 55 60 65 70 75 80 85 90
Cumu lat iv e in ciden ce o f AF (% )
Attained age, years
C
WM Basic WM Intermediate WM High WW Basic WW Intermediate WW High
0 5 10 15 20 25 30
45 50 55 60 65 70 75 80 85 90
Cumu lat iv e in ciden ce o f AF (% )
Attained age, years
D
40
Figure 3. Cumulative incidence of AF from age 45 to 92 by quartiles of predicted 5-year risk of AF, Atherosclerosis Risk in Communities Study, 1987-2014.
Q1: predicted risk ≤ 0.4%. Q2: 0.4% < predicted risk ≤ 0.8%. Q3: 0.8% < predicted risk ≤ 1.5%. Q4: predicted risk > 1.5%.
0 5 10 15 20 25 30 35 40
45 50 55 60 65 70 75 80 85 90
Cumu
lat
iv
e
in
ciden
ce
o
f
AF (%
)
Attained age, years