ISSN 2250-3153
Determination of Tolerance and Sensitivity of Some
Selected Plants to Air Pollution along Major Roads in
Obio-Akpor (Port Harcourt) Nigeria Using Air Pollution
Tolerance Indices
*Udeagbala, T. N.;Agbagwa, I. O.;Tanee, F. B. G.
Department of Plant Science and Biotechnology.University of Port-Harcourt, Nigeria. E-mail: [email protected] 08032927923
*Correspondence author
Abstract
Air pollution is among the most challenging problem in today’s world. In this study, Air Pollution Tolerance Index (APTI) was calculated for four different plants (Panicum maximum,Eleusineindica,XanthosomamafafaandAmaranthusspinosus) found growing along four busy roads (Aba road, East/West road , Ikwerre road and NTA road) in Obio/Akpor local government area and control (IkwerreNgwo) in Etche local government area in Rivers State, Nigeria. The computed APTI results obtained from four biochemical parameters(relative water content, ascorbic acid, leaf extract pH and chlorophyll) showed that the APTI of the test plants recorded remarkable changes as the values obtained in the experimental sites were higher than the control site. The APTI values in the experimental sites (4 roads) were in the range of P. maximum (7.4 – 8.04); E. indica (7.3 – 8.2); X. mafafa (7.2 – 7.9); and A. spinosus (7.2 – 8.0) as against the control (< 6.2) showing that all the test plants studied were sensitive to pollution. Thus, these plants can be used as a better indicator of air pollution in an environment.
Key words: Air Pollution, Relative water content, leaf chlorophyll, Ascorbic acid content, pH
Introduction
One of the most challenging problems that deteriorate the world today is air pollution. It can be defined as the fluctuation in the values
of atmospheric constituent that could have existed without anthropogenic activities (Tripathi and Gautam, 2007). There has been
severe increase in the concentration of particulate and gaseous pollutants due to continuous increase in population growth, vehicular
traffic, industries and road transportation over the years (Joshiet al., 2009) which posses serious threat to the health of inhabitants due
to the adverse effects on the air quality arising from both mobile and stationary combustion sources. These pollutants are classified as
either primary (pollutants that pollute the atmosphere directly once introduced into the environment) or secondary (pollutants that are
formed as a result of the reactions or interactions of primary pollutants in the atmosphere) pollutants (Agbaire and Esiefarienrhe,
2009). Particulate (aerosols, dust, smoke, fumes etc) and gaseous (carbon monoxides, sulphurdioxide, hydrocarbons, etc) pollutants
have negative impacts on humans, plants, animals and the ecosystem at large. Air pollution has been proven to be a contributing
ISSN 2250-3153
due to exposure to particulate and gaseous pollutants which results to diseases such as cardiopulmonary mortality, cardiovascular
diseases and respiratory infections among the habitation (WHO, 2002; Gupta et al., 2004).
In Africa, the risks of exposure to air pollution is high in developing cities, research conducted in Republic of Benin, Ethiopia, Kenya
and Mozambique revealed high level of DNA damage in residents in urban areas and higher prevalence of asthma in school children
that are exposed to air pollution in urban areas as compared to school children in rural areas (Autrup, 2006). Plants provide some
ecosystem functions like temperature amelioration, drainage and water storage filtration, air filtering etc (Bolund and Hunhammers,
1999).
Plants serve as integral basis for our ecosystems and could be affected by air pollution. They have been identified as the most
potential organisms that aremostly affected by ambient air pollution because they are stationary and are continuously exposed to
pollutants from the atmosphere. Hence; injuries caused by air pollution to plants is proportional to the intensity of pollution. Plants are
important tools used to evaluate the impact of air pollution. Sensitive plant species act as biological indicators of air pollution
(Lakshmi et al., 2009).Plants response to air pollution can be understood by determining the air pollution tolerance index (APTI)
which is species dependent plant attribute that expresses the ability of plant to encounter stress that arise due to pollution. APTI is
obtained by using four biochemical parameters which are; relative water content of leaf, ascorbic acid, pH of the leaf and chlorophyll
of the leaf(Singh and Verma,2007). Dileswaret al. (2015) studied the APTI of Tectonagrandis, Sarocaasaca, Terminalia catappa,
Syzygiumcumini, and Cassia fistula, and they observed that Cassia fistula (14.34%) had the highest results followed by
Syzygiumcumini(10.87%), Sarocaasaca(10.77%), Tectonagrandis(8.72%) and Terminalia catappa (7.41%).
Thus; this study was designed to determine the air pollution tolerance level of the test plants as well as the sensitivity of the test plants
with respect to air pollution.The result obtained will assist in environmental biomonitoring of air polluted areas.
Materials and Methods
Description of the Study Area
The study was carried out along four roadsides (i.e Aba road, East/West road, Ikwerre road and NTA road) in parts of Obio/Akpor
local government and the control (in IkwerreNgwo) inEtche local government areas in Rivers State in the Southern region of
Nigeria.Two seasons are experienced in this area; the dry and rainy seasons which ranges from the month of November – March and
April-October respectively.
Aba road and East-West road are among major roads in Obio/Akpor local government area linking parts of the eastern, western and
ISSN 2250-3153
traffic and exhaust fumes emanating from smaller and heavy duty vehicles while Ikwerre and NTA roads are roads where commercial
activities take place. These roads link to some residential areas and local roads in the city. The control site (IkwerreNgwo) is a rural
[image:3.612.70.547.170.723.2]area. Residents here are mostly peasant farmers.
Table 1: GPS of Sample Locations
Locations Northings Eastings Elevations (m)
Obio/Akpor
Aba Road
East/West Road
Ikwerre Road
NTA Road
040 53’ 12.3”
040 52’ 45.8”
040 52’ 05”
040 51’ 30.2”
040 51’ 14.7”
040 51’ 53.1”
040 52’ 13.4”
040 53’ 41.0”
040 55’ 08.2”
040 54’ 51.2”
040 53’ 40.8”
040 53’ 15.3”
040 53’ 49.0”
040 52’ 44.3”
040 52’ 06.1”
0070 08’ 36.4”
0070 07’ 37.1”
0070 06’ 21.0”
0070 4’ 28.7”
0070 04’0 6.6’’
0070 02’ 46.9”
0060 54’ 47.4”
0060 54’ 47.4”
0060 59’ 50.0”
0060 59’ 52.3”
0070 00’ 06.8”
0070 00’ 08.0”
0060 54’ 25.5”
0060 54’ 39.7”
0060 57’ 28.5”
5
20
18
25
26
20
12
12
25
25
24
22
19
22
ISSN 2250-3153
040 52’ 06.1” 0060 57’ 28.5” 16
Etche
IkwerreNgwo 40 54’ 28.8”
40 55’ 8.4”
40 56’ 2.4”
40 55’ 55.2”
70 6’ 57.6”
70 5’ 49.2”
70 5’ 49.2”
70 4’ 37.2”
21
19
20
20
Sampling Procedures
Sampling was done in the months of August (wet season) and December (dry season), 2014. Four sample points along each of these
roads located within a minimum of one kilometer between sample points. Four plant species(Panicum maximum
(Jacq.),Eleusineindica(L.),Xanthosomamafafa(Schott.)andAmaranthusspinosus(L.) )found flourishing in both the experimental and
the control sites were selected for the experimental study. The leaves of the test plants used for this investigation were collected
before noon between the hours of 6.30am and 11am. Replicates of fresh leaves were harvested at a distance of 1 metre away from the
roadside in the experimental and control sites. They were put in well labeled sterile cellophane bags and were hurriedly transported to
an analytical laboratory for analysis. It was ensured that the selected plant species were under the same ecological condition with
regard to soil, light and rainfall.
Analysis of Leaf for Biochemical parameters
Relative water content, total chlorophyll content, pH and ascorbic acid content of leaf extract were analyzed. Thevalues obtained were
used to compute the APTI values.
TheRelative Water Content (RWC) was determined by weighing the fresh leaf samples of the test plants on a digital balance (Setra
model number: BL-410S) to obtain the fresh weight (FW). The fresh leaves were then immersed in water for twenty four hours,
blotted dry with the aid of whatman filter paper and reweighed to obtain the turgid weight (T W). They were finally oven dried
(Gallenkamp plus II oven) for 48 hours at a temperature of 700C and reweighed again to determine their dry weight (DW). Then RWC
was computed using the formula described by Singh (1977) and Taneeet al., (2014) as stated below:
RWC = Fresh Weight – Dry Weight (DW)
ISSN 2250-3153
Total Chlorophyll Content (TLC) was obtained according to the method of Stewarteet al. (1974) in which 0.1gram of each of the leaf
samples was soaked in 10ml of 50% acetone; and then allowed to stand for two days to extract the available chlorophyll using a
spectrophotometer.
The pH of the leaf was obtained by homogenizing 2 gram of fresh leaves in 20 ml of deionized water and leaf pH determined using a
pH meter (HI8314).TheAscorbic Acid Content (AAC) was obtained using the indophenols acetic acid method (AOAC, 1984).
Air Pollution Tolerance Index (APTI) was calculated using the standard method as described by Singh and Rao (1983). Thus;
APTI = AAC (TLC + pH) + RWC
10
Statistical Analysis
Data was statistically analyzed using Standard Error Mean (SEM) using Microsoft excel package version 2007. Least significant
difference (LSD) (p < 0.05) was used to separate means.
Results
The average values of the biochemical parameters and percentage increase/decrease in total chlorophyll, leaf pH, ascorbic acid,
relative water content for the four plant species at boththe experimental and control sites are represented in Tables 2-5 below. The
APTI for the test plants at both the experimental and control sites are shown in table 6.
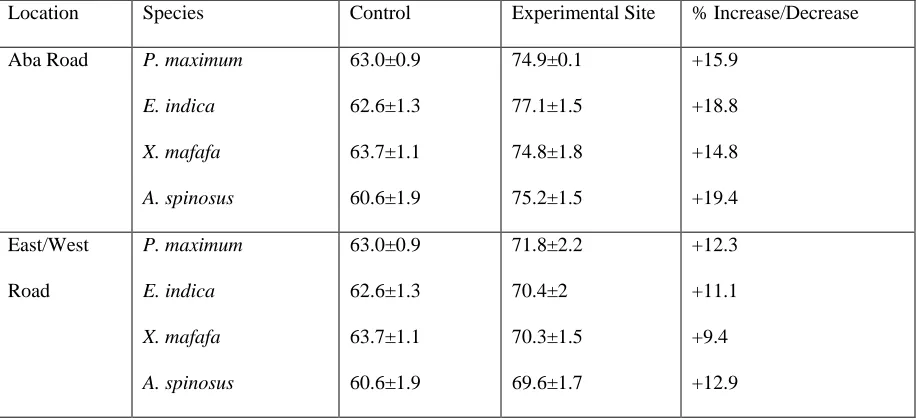
The relative water content of the test plants was higher in the experimental sites than the control site for both seasons. That is; plants
in experimental sites retains more water than the ones in control site (Table 2a and b).The highest was recorded in X. mafafa in all the
roads in the wet season.
Table 2a:Relative Water Content (wet season)
ISSN 2250-3153
Aba Road P. maximum
E. indica X. mafafa A. spinosus 56.45±1.4 51.9±1.1 48.15±1.4 58.66±1.1 80.59±3.0 76.36±1.5 78.34±3.3 76.94±0.6 +30 +32 +38.5 +23.8 East/West Road P. maximum E. indica X. mafafa A. spinosus 56.45±1.4 51.9±1.1 48.15±1.4 58.66±1.1 83.24±1.1 78.3±0.6 79.7±3.3 74.0±0.5 +32.2 +33.7 +39.6 +20.7
Ikwerre Road P. maximum
E. indica X. mafafa A. spinosus 56.45±1.4 51.9±1.1 48.15±1.4 58.66±1.1 76.53±2.1 83.94±0.7 82.24±2.4 76.66±2.6 +26.2 +38.2 +41.5 +23.5
NTA Road P. maximum
[image:6.612.78.537.524.734.2]E. indica X. mafafa A. spinosus 56.45±1.4 51.9±1.1 48.15±1.4 58.66±1.1 78.68±1.2 82.8±1.0 84.43±0.6 77.0±2.0 +28.3 +37.3 +43.0 +23.8
Table 2b. Relative Water Content (dry season)
Location Species Control Experimental Site % Increase/Decrease
Aba Road P. maximum
ISSN 2250-3153
Ikwerre Road P. maximum
E. indica X. mafafa A. spinosus 63.0±0.9 62.6±1.3 63.7±1.1 60.6±1.9 71.3±2.8 70.2±2.3 72.0±2.6 72.5±3.7 +11.6 +10.5 +11.5 +16.4
NTA Road P. maximum
E. indica X. mafafa A. spinosus 63.0±0.9 62.6±1.3 63.7±1.1 60.6±1.9 76.1±1.1 72.9±2.4 75.9±2 76.5±2.7 +17.2 +14.1 +16.1 +20.8
Where; + = % increase, - = % decrease
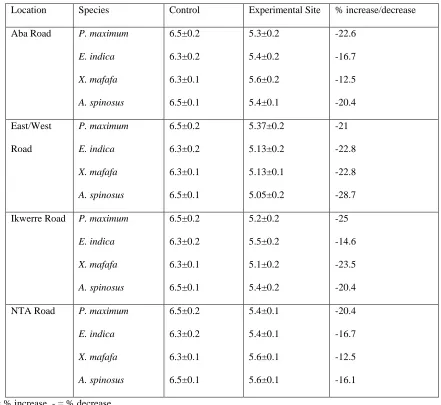
The pH of the leaf extract was found to be lower in the experimental site than the control site (Table 3a and b). The highest pH was
[image:7.612.68.548.362.733.2]recorded in Xanthosomamafafaon Aba road while the least was recorded in Amaranthusspinosuson East/West road for both seasons.
Table 3a:pH of the Leaf Extracts (Wet Season)
Location Species Control Experimental Site % increase/decrease
Aba Road P. maximum
E. indica X. mafafa A. spinosus 4.12±0.1 3.52±0.2 4.22±0.2 3.49±0.2 2.31±0.1 2.36±0.04 2.4±0.1 2.12±0.07 -52.1 -43.4 -50.1 -27.4
East/West Road P. maximum
E. indica X. mafafa A. spinosus 4.12±0.1 3.52±0.2 4.22±0.2 3.49±0.2 1.3±0.1 2.02±0.1 1.08±0.03 0.98±0.04 -47.9 -49.5 -38.6 -43.9
Ikwerre Road P. maximum
E. indica X. mafafa A. spinosus 4.12±0.1 3.52±0.2 4.22±0.2 3.49±0.2 2.11±0.1 2.11±0.1 1.80±0.03 1.5±0.1 -56.6 -39 -53.8 -50.1
NTA Road P. maximum
ISSN 2250-3153
A. spinosus 3.49±0.2 2.12±0.1 -27.8
[image:8.612.84.525.174.579.2]Where; + = % increase, - = % decrease
Table 3b:pH of the Leaf Extracts (Dry Season)
Location Species Control Experimental Site % increase/decrease
Aba Road P. maximum
E. indica
X. mafafa
A. spinosus
6.5±0.2
6.3±0.2
6.3±0.1
6.5±0.1
5.3±0.2
5.4±0.2
5.6±0.2
5.4±0.1
-22.6
-16.7
-12.5
-20.4
East/West
Road
P. maximum
E. indica
X. mafafa
A. spinosus
6.5±0.2
6.3±0.2
6.3±0.1
6.5±0.1
5.37±0.2
5.13±0.2
5.13±0.1
5.05±0.2
-21
-22.8
-22.8
-28.7
Ikwerre Road P. maximum
E. indica
X. mafafa
A. spinosus
6.5±0.2
6.3±0.2
6.3±0.1
6.5±0.1
5.2±0.2
5.5±0.2
5.1±0.2
5.4±0.2
-25
-14.6
-23.5
-20.4
NTA Road P. maximum
E. indica
X. mafafa
A. spinosus
6.5±0.2
6.3±0.2
6.3±0.1
6.5±0.1
5.4±0.1
5.4±0.1
5.6±0.1
5.6±0.1
-20.4
-16.7
-12.5
-16.1
Where; + = % increase, - = % decrease
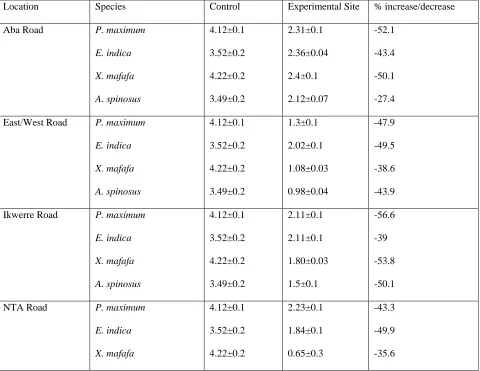
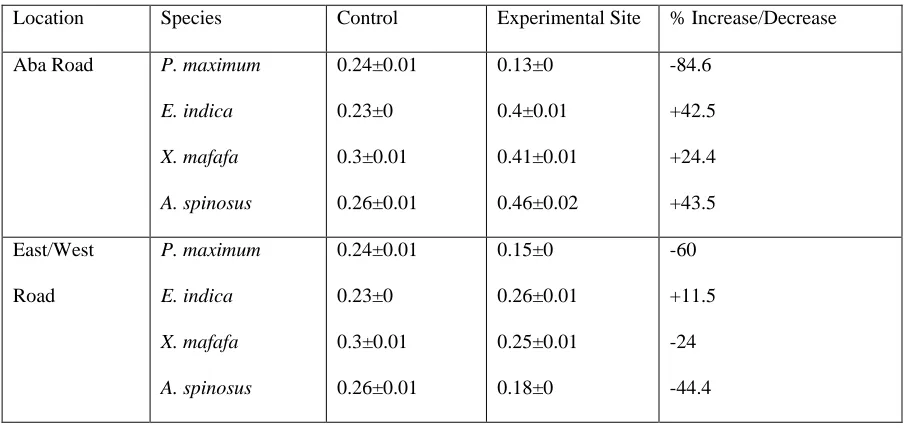
During rainy season, the ascorbic acid content of the test plants in the experimental sites were lower in all plants except for P.
maximum in NTA road (Table 4a). While in dry season, it varied among locations with E. indicain NTA road having the highest value
and P. maximum in Aba road with the least value (Table 4b).
ISSN 2250-3153
Location Species Control Experimental Site % Increase/Decrease
Aba Road P. maximum
E. indica X. mafafa A. spinosus 0.52±0.01 0.54±0.01 0.52±0.01 0.56±0.01 0.38±0.01 0.45±0.02 0.4±0.02 0.46±0.02 -36.8 -20 -30 -21.7 East/West Road P. maximum E. indica X. mafafa A. spinosus 0.52±0.01 0.54±0.01 0.52±0.01 0.56±0.01 0.43±0.01 0.52±0.01 0.32±0.003 0.53±0.01 -20.9 -3.9 -62.5 -5.7
Ikwerre Road P. maximum
E. indica X. mafafa A. spinosus 0.52±0.01 0.54±0.01 0.52±0.01 0.56±0.01 0.42±0.01 0.47±0.01 0.43±0.003 0.50±0.01 -23.8 -14.9 -20.9 -12
NTA Road P. maximum
E. indica X. mafafa A. spinosus 0.52±0.01 0.54±0.01 0.52±0.01 0.56±0.01 0.55±0.02 0.5±0.01 0.33±0.01 0.44±0.004 5.5 -8 -57.6 -27.3
[image:9.612.80.534.512.726.2]Where; + = % increase, - = % decrease
Table 4b:Ascorbic Acid Content (AAC) for Dry Season
Location Species Control Experimental Site % Increase/Decrease
Aba Road P. maximum
ISSN 2250-3153
Ikwerre Road P. maximum
E. indica X. mafafa A. spinosus 0.24±0.01 0.23±0 0.3±0.01 0.26±0.01 0.23±0.01 0.17±0.01 0.22±0.01 0.29±0.02 -4.4 -35.3 -40.9 +10.4
NTA Road P. maximum
E. indica X. mafafa A. spinosus 0.24±0.01 0.23±0 0.3±0.01 0.26±0.01 0.36±0.01 0.74±0.1 0.34±0.01 0.2±0.01 +33.3 +68.9 +8.8 -8.3
Where; + = % increase, - = % decrease
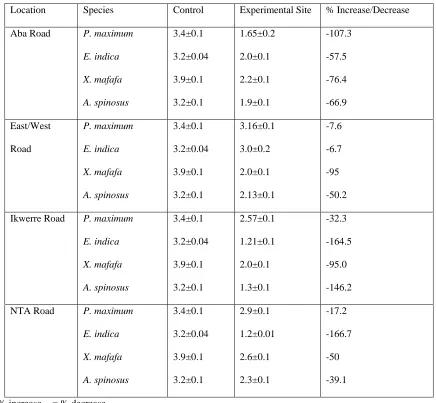
Results from this study showed that the test plants in the experimental sites had lower total chlorophyll content than in the control site
[image:10.612.84.531.359.734.2](Table 5a and b).
Table 5a.Total leaf chlorophyll (wet season)
Location Species Control Experimental Site % Increase/Decrease
Aba Road P. maximum
E. indica X. mafafa A. spinosus 4.12±0.1 3.52±0.2 4.22±0.2 3.49±0.2 2.31±0.1 2.36±0.04 2.4±0.1 2.12±0.07 -78.4 -49.2 -75.8 -64.6 East/West Road P. maximum E. indica X. mafafa A. spinosus 4.12±0.1 3.52±0.2 4.22±0.2 3.49±0.2 1.3±0.1 2.02±0.1 1.08±0.03 0.98±0.04 -216.9 -74.3 -290.7 -256.1
Ikwerre Road P. maximum
E. indica X. mafafa A. spinosus 4.12±0.1 3.52±0.2 4.22±0.2 3.49±0.2 2.11±0.1 2.11±0.1 1.80±0.03 1.5±0.1 -95.3 -66.8 -134.4 -132.7
NTA Road P. maximum
ISSN 2250-3153
A. spinosus 3.49±0.2 2.12±0.1 -64.6
[image:11.612.87.523.174.577.2]Where; + = % increase, - = % decrease
Table 5b.Total Leaf Chlorophyll (dry season)
Location Species Control Experimental Site % Increase/Decrease
Aba Road P. maximum
E. indica
X. mafafa
A. spinosus
3.4±0.1
3.2±0.04
3.9±0.1
3.2±0.1
1.65±0.2
2.0±0.1
2.2±0.1
1.9±0.1
-107.3
-57.5
-76.4
-66.9
East/West
Road
P. maximum
E. indica
X. mafafa
A. spinosus
3.4±0.1
3.2±0.04
3.9±0.1
3.2±0.1
3.16±0.1
3.0±0.2
2.0±0.1
2.13±0.1
-7.6
-6.7
-95
-50.2
Ikwerre Road P. maximum
E. indica
X. mafafa
A. spinosus
3.4±0.1
3.2±0.04
3.9±0.1
3.2±0.1
2.57±0.1
1.21±0.1
2.0±0.1
1.3±0.1
-32.3
-164.5
-95.0
-146.2
NTA Road P. maximum
E. indica
X. mafafa
A. spinosus
3.4±0.1
3.2±0.04
3.9±0.1
3.2±0.1
2.9±0.1
1.2±0.01
2.6±0.1
2.3±0.1
-17.2
-166.7
-50
-39.1
Where; + = % increase, - = % decrease
The test plants in this study had APTI values of less than 16 for both seasons. It was observed that the APTI for both seasons were
higher in the experimental sites than the control site. The maximum APTI values for rainy season was recorded in Panicum maximum
on NTA road while the least was recorded in X. mafafaand A. spinosus on East/West road while the highest values for dry season was
recorded in Elusineindicaon NTA road and the least was recorded in Amarathusspinosusin Ikwerre road (Tables 6a & b).
ISSN 2250-3153
Location Species Control Experimental Site % Increase/Decrease
Aba Road P. maximum
E. indica X. mafafa A. spinosus 5.6±0.3 5.8±0.4 5.6±0.3 5.7±0.5 7.74±0.1 8.02±0.2 7.75±0.2 7.82±0.2 +27.6 +27.7 +27.7 +27.1 East/West Road P. maximum E. indica X. mafafa A. spinosus 5.6±0.3 5.8±0.4 5.6±0.3 5.7±0.5 7.4±0.2 7.4±0.2 7.2±0.2 7.2±0.2 +24.3 +21.6 +22.2 +20.8
Ikwerre Road P. maximum
E. indica X. mafafa A. spinosus 5.6±0.3 5.8±0.4 5.6±0.3 5.7±0.5 7.4±0.3 7.3±0.2 7.5±0.3 7.5±0.4 +24.3 +20.6 +25.3 +24
NTA Road P. maximum
E. indica X. mafafa A. spinosus 5.6±0.3 5.8±0.4 5.6±0.3 5.7±0.5 8.04±0.1 7.6±0.3 7.8±0.2 8.0±0.3 +30.4 +23.7 +28.2 +28.8
[image:12.612.85.529.513.726.2]Where; + = % increase, - = % decrease
Table 6b:Air pollution Tolerance indices (APTI) of the Test Plants (Dry Season)
Location Species Control Experimental Site % Increase/Decrease
Aba Road P. maximum
ISSN 2250-3153
Ikwerre Road P. maximum
E. indica
X. mafafa
A. spinosus
6.2±0.1
6.0±0.03
6.1±0.02
6.2±0.2
7.7±0.1
7.5±0.2
7.9±0.2
7.4±0.2
+19.9
+20.2
+22.2
+16.3
NTA Road P. maximum
E. indica
X. mafafa
A. spinosus
6.2±0.1
6.0±0.03
6.1±0.02
6.2±0.2
7.8±0.1
8.2±0.2
7.7±0.1
7.7±0.1
+20.8
+26.2
+20.3
+19.8
Where; + = % increase, - = % decrease
Discussion
When there is reduction in the rate of leaf transpiration, as a result of air pollution, plants lose its engine that pulls water from the
roots to supply photosynthesis. The plants will either cool the leaf or bring minerals from roots to leaf where biosynthesis occur
(Seyyednjadet al., 2011).Plants at the experimental sites were found to have more relative water content than the control. Similar
result has been reported by Bhattacharya etal. (2013) where they observed higher relative water content in the monsoon seasonwhile
Das and Prasad (2010) observed high leaf RWC during rainy season, low inwinter and least in summer season.This retained water
acts as an adaptive feature that helps in the maintenance of plants physiological balance against pollution stress condition (Verma,
2003). This shows that the ability to retain and accumulate water is an adaptive feature of plant to tolerate pollution stress.
pH plays very vital role in the modification of the toxicity of air pollution such as SO2. Singh and Verma (2007) reported that plants
with lower pH are more susceptible while those with pH of about 7 are more tolerant to pollution. High pH could increase the
efficiency of the conversion from hexose sugar to ascorbic acid (Escobedo et al., 2008). The decrease in pH in the leaves of plant at
the experimental sites could be explained that the exposure of plant to air pollutant causes an appreciable acidification of the
cytoplasm to occur (Veljovic-Jovanovicet al., 1993) leading to low photosynthesis.
Ascorbic acid activates some defense and physiological mechanisms (Arora et al.,2002) and serves as a tool acceptable to biomonitor
pollutants. Its reducing power is proportional to its concentrations (Raza and Murthy, 1988). It also plays very significant role in light
reaction during photosynthesis (Singh and Verma, 2007) but when subjected to stress, it has the ability to replace water from light
reaction II (Singh and Verma, 2007). Ascorbic acid is a strong reducer that has significant function in photosynthetic fixation of
carbon with its reducing power proportional to its concentration. So it reductions in the experimental site is an indicator of air
ISSN 2250-3153
Some air pollutants have been reported to reduce chlorophyll content (Tiwari et al, 2006; Joshi and Swami, 2007 and 2009; Joshi et
al., 2009) while others increase it (Tripathi and Gautam, 2007; Agbaire and Esiefarienrhe, 2009). The reductions in the pH and
ascorbic acid also have a direct effect on chlorophyll synthesis as observed in the result. Similar results had been reported by Joshi
and Swami (2007) who observed that one of the most common impacts of air pollution is the gradual disappearance of chlorophyll.
Decrease in values of pH of leaf extract and total chlorophyll content of leaf as observed also agrees with the findings of Jyothi and
Jaya (2010) who proposed that high concentration of automobile pollution results in reduction in chlorophyll content of leaf in higher
plants near roadsides. This shows that there is a correlation between leaf pH, ascorbic acid content and chlorophyll synthesis. Though,
this varies from plant species to species, leaf age, pollution level as well as abiotic and biotic conditions (Katiyar and Dubey, 2001).
Reduction in the chlorophyll content of plants results in poor productivity in plants.Thus; plants that maintain their chlorophyll in a
polluted environment are referred to as tolerant (Singh and Verma, 2007).
APTI plays important role in determining the susceptibility and resistivity of plant species against levels of pollution. The
resultsshowed that various plants respond differently to air pollution. Differences in the values obtained from the four biochemical
parameters (pH, ascorbic acid, chlorophyll and relative water content) resulted in variation in APTI values. In this study, the result of
the APTI values of all the test plants fell within the range of sensitive for plant in the experimental site (Table 7). The increase in the
APTI of the test plants may be due to increase in the RWC of the test plants that aid in plant physiological balance against
pollution.Agbaire and Esiefarienrhe (2009); Tanee and Albert (2013); Taneeet al. (2014) and Dileswaret al. (2015) have also reported
[image:14.612.63.557.498.618.2]some plants with varying level of sensitivity and tolerance to pollution using APTI.
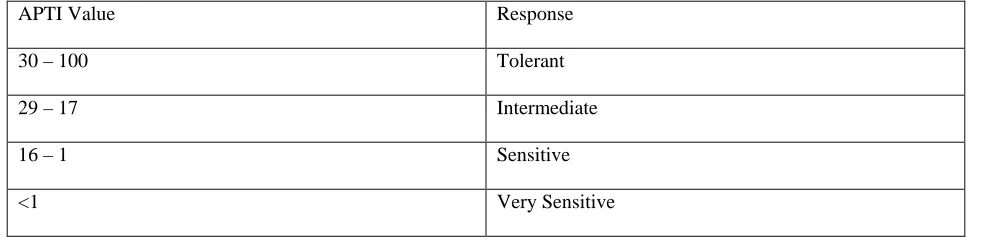
Table 7: Grouping of plants based on APTI
APTI Value Response
30 – 100 Tolerant
29 – 17 Intermediate
16 – 1 Sensitive
<1 Very Sensitive
Source; Lakshmi et al., (2009)
Conclusion
All the test plants showed increased values at the experimental site for relative water content and ascorbic acid except for E. indicaand
ISSN 2250-3153
but the values of APTI for the test plants were higher in the experimental sites than the control site. Hence, plants found growing
along busy roads are exposed to pollutants to their own system which alter the biochemical nature of the leaf. All the plants in this
study fell within the range of sensitive category to air pollution. Therefore, these plants can be explored as biomonitors in air pollution
prone environment.
References
P. O. Agbaire and E. Esiefarienrhe. (2009). Air pollution tolerance index of plants around Otorogun Gas Plants in Delta State,
Nigeria. Journal of Applied Science of Environmental Management,13(1):11-14
A. L. Agrawal. (1988). Air pollution control studies and impact assessment of stack and fugitive emission from CCI Akaltara Cement
Factory. Project report sponsored by M/S CCI Akaltara Cement Factory, NEERI, Nagpur
A. Arora, R. K. Sairam and G. C. Srivastava (2002). Oxidative stress and antioxidative system in plants. Curriculum of Science, 82:
1227-1238.
Association of Official Analytical Chemists (1984). Official methods of analysis of the Association of Official Analytical Chemist
(14th edition), Arlington, Virginia, USA
S.E. Autrup. (2006). Survey of air pollution in Cotonou, Benin-air monitoring and biomarkers, Science of Total Environment,
358(1-1):85-96
P. Bolund and S. Hunhammers. (1999). Ecosystem services in urban areas. Ecological Economics, 29:293-301
T. Bhattacharya, L. Kriplani and S. Chakraborty.(2013). Seasonal variation in air pollution tolerance index of various plant species of
Baroda City, Univer.Journal of Environmental Resource Technology, 3(2): 199-208
S. Das and P. Prasad (2010). Seasonal variation in air pollution tolerance indices and selection of plant species for industrial areas of
Rourkela.International Journal of Environmental Protection, 30(12)978-988
N. Dileswar, D. P. Patel, K. Thakare, K. Satasiya and P. Shrivastava.(2015). Assessment of air pollution tolerance index of selected
plants.Indian Forester, 141(4) : 372-378
F. J. Escobedo, J. E. Wagnerand D. J. Nowak. (2008). Analyzing the cost effectiveness of Santiago Chile’s policy using urban forest
ISSN 2250-3153
A. Gupta, K.KararKakoli, S. Ayoob and J. Kuruvilla.(2004). Spatio-temporal characteristics of gaseous and particulate pollutants in
an urban region of Kolkata, India.Atmospheric Research, 87:103-115
N. Joshi, A. Chauhan and P. C. Joshi.(2009). Impacts of industrial air pollutants on some biochemical parameters and yield in wheat
and mustard plants.Environmentalist, 29:98-104
N. Joshi, A. Chauhan and P. C Joshi.(2009). Impacts of industrial air pollutants on some biochemical parameters and yield in wheat
and mustard plants.Environmentalist, 29:98-104
P. C. Joshi andA. Swami.(2007). Physiological responses of some tree species under roadsides automobile pollution stress around
city of Haridwar, India.Environmentalist,27:365-374
J. S. Jyothi and D. S. Jaya.(2010). Evaluation of air pollution tolerance index of selected plant species along roadsides in
Thiruvananthapuram, Kerala.Journal of Environmental Biology, 31: 379-386.
V. Katiyar and P. S. Dubey.(2001). Sulphurdioxide sensitivity on two stage of leaf development in a few tropical tree
species.Industrial Journal of Environmental Toxicology, 11:78-81
P. S. Lakshmi, K. L. Sarawanti and N. Sirinivas.(2009). Air pollution tolerance index of various plant species growing in industrial
area.Journal of Environmental Science, 2(2):203-206
S. H. Raza and M. S. R Murthy.(1988). Air pollution tolerance index of certain plants of Naacharam industrial area, Hyderabed.Indian
Journal of Botany, 11(1):91-95
S. M. Seyyednjad, K. Majdian, H. Koochak and M. Niknejad. (2011). Air Pollution Tolerance Indices of Some Plants Around
Industrial Zone in South of Iran. Asian Journal of Biological Sciences, 4: 300-305.
A. Singh.(1977). Practical plant physiology.Kalyani Publishers, New Delhi. 266 pp
S. K. Singh and D. N. Rao.(1983). Evaluation of plant for their tolerance to air pollution.In proc. Symp. On air pollution control,
Indian Association of Air Pollution Control, New Delhi
S. N. Singh and A. Verma. (2007). Phytoremediation of Air Pollutants: A Review. In: Environmental Bioremediation technology,
Singh, S. N. and Tripathi, R.D (eds). Springer Berlin Heidelberg, 293-314 pp
R. J. Stewart, J. W. Devanney and W. Briggs.(1974). Oil spill trajectory studies for Atlantic Coast and Gulf of Alaska. Report to
ISSN 2250-3153
F.B.G. Tanee and E. Albert. (2013). Air pollution tolerance indices of plants growing
aroundUmuebulu Gas flare station in Rivers state, Nigeria. African Journal of Environmental Science and Technology, 7(1):
1-8
F. B. G. Tanee, E. Albert and B. R.Amadi.(2014). Biochemical properties and air pollution tolerance indices of plants in Port Harcourt
City, Nigeria.British Journal of Applied Science and Technology, 4(34): 4835-4845
S. Tiwari, M. Agrawaland F. M. Marshall.(2006). Evaluation of ambient air pollution impact on carrot plants at a suburban site using
open top chambers.Environmental Monitoring Assessment, 119:15-30
A. K. Tripathi and M. Gautam.(2007). Biochemical parameters of plants as indicators of air pollution.Journal of Environmental
Biology, 28:127-132
S. Veljovic-Jovanovic, W. Bilger and U. Heber.(1993). Inhibition of photosynthesis, stimulation of zeaxanthin formation and
acidification in leaves by SO2 and reversal of these effects.Plant,191:365-376
A. Verma.(2003). Attenuation of automobile generated air pollution by higher plants. Dissertation, University of Lucknow