Economic efficiency of radiology wards using data
envelopment analysis: Case study of Iran
Ali Keshtkaran1, Mohsen Barouni2*, Ramin Ravangard1, Mohammad Yandrani1
1
Schools of Management and Medical Information Sciences, Shiraz University of Medical Sciences, Shiraz, Iran
2
Research Center for Health Services Management, Institute for Futures Studies in Health, Kerman University of Medical Sciences, Kerman, Iran; *Corresponding Author:[email protected]
Received 28 November 2013; revised 31 December 2013; accepted 9 January 2014
Copyright © 2014 Ali Keshtkaran etal. This is an open access article distributed under the Creative Commons Attribution License, which permits unrestricted use, distribution, and reproduction in any medium, provided the original work is properly cited. In accor-dance of the Creative Commons Attribution License all Copyrights © 2014 are reserved for SCIRP and the owner of the intellectual property Ali Keshtkaran etal. All Copyright © 2014 are guarded by law and by SCIRP as a guardian.
ABSTRACT
Background: In evaluating the activities and per- formance of radiology units, the main aim of applying feasible scientific methods is to use te- chnological and human resources optimally. One of the suitable scientific methods in this field is determining the technical, economic, and allocative efficacy of these centers. We aimed to assess the economic efficiency of radiology units of hospitals affiliated to Shiraz University of Medical Sciences, southern Iran. Methods: In this descriptive-analytical cross-sectional study, the technical, economical, and allocative effi- ciency of 27 radiology units of public hospitals was assessed using data envelopment analysis. The input oriented envelopment form with the assumption of the varied outputs with respect to the scale was used. Related forms were filled using the existing information in the archives of radiology centers. Input variables in this study were the number of radiology devices, the num- ber of expert personnel, the number of techni-cians, equipment maintenance and depreciation costs, and the salaries of the experts and tech-nician. Output variables included the number of admitted patients and the number of photo-graphic film. Then, data were analyzed using the DEAP software for calculating the various forms of efficiency. Results: The mean scores of eco-nomic, technical, and allocative efficiencies of radiology units were 0.749, 0.880, and 0.852, respectively. The final score of economical effi- ciency was lower than the technical and alloca-tive efficiency scores. Only 15% of radiology units
were economically efficient. Conclusion: Eco-nomical efficiency can be attained when resour- ces are used in the best possible way and not wasted. Therefore, a combination of inputs that comprise the lowest costs should be selected.
KEYWORDS
Economic Efficiency; Allocative Efficiency; Technical Efficiency; Data Envelopment Analysis; Radiology Wards
1. INTRODUCTION
Efficiency has been widely studied in scientific litera- ture. This term is used anywhere where an activity is taking place. One of the reasons for the popularity of this concept is its importance in the society. The main issue regarding efficiency and its influencing factors is focused on how an activity can be efficient with lower costs and facilities, uses existing resources better, and prevents the waste of material and human resources [1].
Economic efficiency is a unit’s capability to achieve the maximum productivity and efficiency possible con- sidering the costs and input levels to find the ratio be- tween the least possible cost and the existing cost. Eco- nomic efficiency is obtained by multiplying technical and allocative efficiencies [3]. Therefore, in order to en- hance economic efficiency, technical and allocative effi- ciencies should also be enhanced. Lack of economic ef- ficiency is rooted in technical and allocative efficiencies and the lack of allocative efficiency is related to unsuit- able distribution of interventions and different treatment methods, and incorrect use of different technologies. The lack of technical efficiency is related to waste of re-sources and financial assets including wrong and inferior equipment purchases or excess labor work [4].
Therefore, a health system has economic efficiency when it could present correct and adequate services (al- locative efficiency) in a useful and proportionate manner (technical efficiency) [5]. Since paying attention to health- care and investment in this field can increase the effi- ciency of the work force and productivity, allocating adequate resources and the optimal use of the resources is important in this regard [2]. Recent advances in know- ledge, technology, healthcare, and treatment methods as well as the created changes in people’s lifestyles and cultural and social structures, change in disease models and people’s medical needs and the rapid population growth have complicated the supply of healthcare facili-ties and services. On the other hand, the optimal utiliza-tion of human and material resources for effective pro-duction and supply depends on awareness about eco- nomic regulations [6]. Advances in economic efficiency enable the healthcare system to perform better using ex- isting resources and create justice and equality [4].
We aimed to assess the economic efficiency of radi-ology units of hospitals affiliated to Shiraz University of Medical Sciences, southern Iran using data envelopment analysis.
2. MATERIALS AND METHODS
This descriptive-analytical cross-sectional study was done during 2011 to assess the economic efficiency of 27 radiology units of hospitals affiliated to Shiraz Univer-sity of Medical Sciences using data envelopment analysis. This method of analysis is one of the non-parametric methods of estimating functions as well as a linear pro- gramming technique. Sampling was not done since a limited number of university-affiliated public hospitals existed. This study is also an applicable study since hos-pital managers, other hoshos-pitals, and policy makers could benefit from the findings of the study.
Data were collected using simultaneous field and li-brary studies using a researcher-designed checklist. In
this checklist a list of needed data including the study inputs and outputs were recorded. Collected data were comparatively analyzed and assessed using the DEAP software. Analytic tests were done using SPSS software.
We studied the economic, allocative, technical, scale and management efficiencies of the radiology units using the data envelopment analysis assuming varied outputs with respect to the scale in an input-oriented fashion. The data used in our study were related to input variables such as imaging device, maintenance cost per year (con-sidering device depreciation), number of expert person-nel, number of technicians, and the salaries of experts and technicians. The output variables included number of admissions and number of X-ray per year.
The important point to consider is that since different devices were used in the radiology units of different hos-pitals with different life spans (some less that and some more that 10 years), we used the direct methods for cal-culating device depreciation using scientific accounting literature and with the consultation of experts in account-ing and economics. In the direct linear method a fixed percentage of initial assets are depreciated in the useful life of assets. However, the main point is that based on the textbooks and expert consultation, the maintenance cost was calculated for devices that were old according to available records [7]. This cost was quite considerable in existing contracts and affected the economic effi-ciency score. The maintenance and depreciation costs were calculated for devices that were less than 10 years old [8].
3. RESULTS
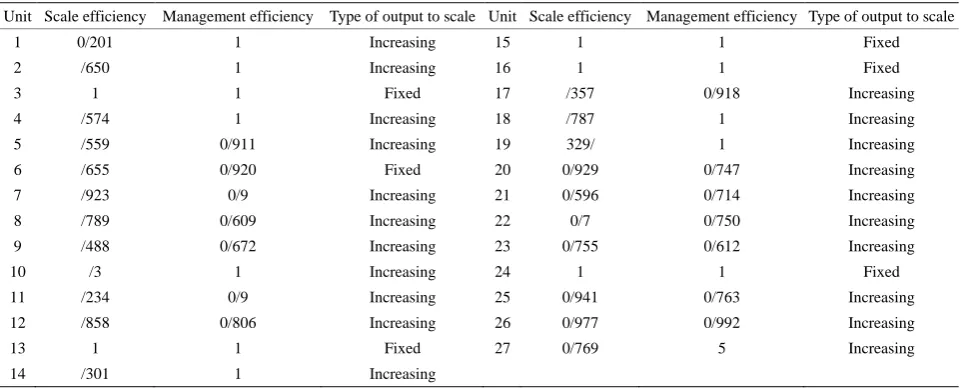
The results of the first stage of the study included The scale and management efficiencies of radiology units considering the type of their scale are shown in Table 1.
As shown in Table 1, the management and scale effi-ciencies of radiology units are very different from each other with scale and management efficiencies ranging from 0.201 - 1 and 0.556 - 1, respectively. Radiology units that performed efficiently with respect to both man-agement and scale efficiencies during the study period were related to hospitals 3, 13, 15, 16, and 24. These five radiology units had a fixed output with respect to scale that confirms their efficiency. Other units had an increas-ing output to scale which signals that they were not per-forming efficiently and for having scale efficiency they should increase their production capacity. The least scale (0.201) and management (0.556) efficiencies were re-lated to the radiology units of hospitals 1 and 27, respec- tively.
Table 1. Scale and management efficiency scores of radiology units of University-affiliated hospitals.
Unit Scale efficiency Management efficiency Type of output to scale Unit Scale efficiency Management efficiency Type of output to scale
1 0/201 1 Increasing 15 1 1 Fixed
2 /650 1 Increasing 16 1 1 Fixed
3 1 1 Fixed 17 /357 0/918 Increasing
4 /574 1 Increasing 18 /787 1 Increasing
5 /559 0/911 Increasing 19 329/ 1 Increasing
6 /655 0/920 Fixed 20 0/929 0/747 Increasing
7 /923 0 /9 Increasing 21 0/596 0/714 Increasing
8 /789 0/609 Increasing 22 0 /7 0/750 Increasing
9 /488 0/672 Increasing 23 0/755 0/612 Increasing
10 / 3 1 Increasing 24 1 1 Fixed
11 /234 0 /9 Increasing 25 0/941 0/763 Increasing
12 /858 0/806 Increasing 26 0/977 0/992 Increasing
13 1 1 Fixed 27 0/769 5 Increasing
14 /301 1 Increasing
tained results the mean scale and management efficien-cies of the studied radiology units during 2011 were 0.692 and 0.880, respectively.
In the DEA methodology, formally developed by Charles, Cooper and Rhodes (1978), efficiency is defined as a ratio of weighted sum of outputs to a weighted sum of inputs, where the weights structure is calculated by means of mathematical programming and constant returns to scale (CRS) are assumed. In 1984, Banker, Charnes and Cooper developed a model with variable returns to scale (VRS).
In this table we report two types of efficiency (scale and management efficiency). If we divide constant return to scale efficiency (CRS) score to variable return to scale (VRS) efficiency (managerial) achieved scale efficiency. Constant return to scale efficiency not included in Table 1.
The results of the second stage of the study are the economic, allocative, and technical efficiencies of each radiology unit were calculated by considering costs.
[image:3.595.58.539.101.295.2]According to Table 2, the mean economic efficiency of radiology units was 0.749. This amount of efficiency shows that if these units were completely efficient they could reduce about 30% of their expenses and gain the same amount of output. The mean technical and alloca-tive efficiencies were 0.880 and 0.852, respecalloca-tively. Ta-ble 3 shows the excess inputs calculated by estimating technical efficiency.
Table 3 shows the excess application of inputs using the non-parametric method assuming a varied output with respect to scale for radiology units. In other words this table shows how much each radiology unit should reduce its unit’s input to reach technical efficiency.
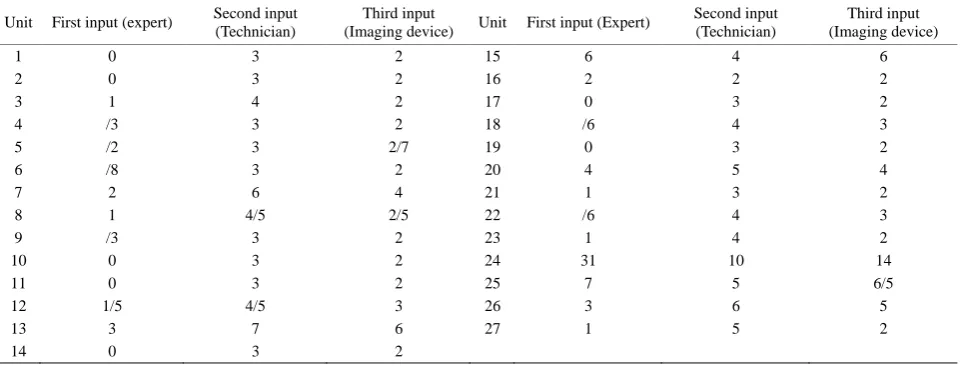
Table 4 shows the optimum input amounts of radiol-ogy units at University-affiliated hospitals. This table is different from Table 3 because it shows the optimum
economical amounts of the inputs for increasing eco-nomic efficiency, while Table 4 is after optimizing in-puts for increasing the technical efficiency of radiology units.
In this study, a hypothesis was made about the mean economic efficiency of radiology units of Shiraz com- pared with other cities. We found that the mean eco- nomic efficiency of radiology units in Shiraz did not have a significant difference from other cities (P = 0.952).
4. DISCUSSION
Considering that hospitals play a crucial role in pre- senting healthcare services and can affect the efficiency of the whole healthcare system, applying the data envel- opment method can enhance the performance of hospi- tals throughout the country.
We found that the mean scale efficiency scores of ra- diology units were 0.691 in 2011. Ferrier and colleague estimated the scale efficiency of 360 American hospitals to be 0.893 [9]. Other studies have stated a scale effi-ciency of 0.940 for 123 hospitals and about 0.790 - 1 for 41 hospitals of the same country, respectively [10,11]. The scale efficiency of 55 hospitals in America was fur-ther reported to be 0.51 to 1 [12]. These estimations are consistent with our study.
Table 2. Score and grade of economic, allocative, and technical efficiencies of radiology units during 2011.
Unit Technical efficiency Allocative efficiency Economic efficiency Unit Technical efficiency Allocative efficiency Economic efficiency
1 1 0/627 0/627 15 1 1 1
2 1 0/608 0/608 16 1 0/704 0/704
3 1 1 1 17 0/918 0/861 0/791
4 1 0/953 0/953 18 1 0/830 0/830
5 0/911 0/933 0/850 19 1 0/812 0/812
6 0/920 0/938 0/862 20 0/747 0/705 0/727
7 0/900 0/903 0/813 21 0/714 0/903 0/644
8 0/609 0/839 0/511 22 0/750 0/699 0/524
9 0/672 0/978 0/657 23 0/612 0/945 0/578
10 1 0/977 0/977 24 1 1 1
11 0/900 0/783 0/705 25 0/763 0/672 0/513
12 0/806 0/925 0/746 26 0/992 0/781 0/755
13 1 1 1 27 0/556 0/887 0/494
[image:4.595.58.540.101.295.2]14 1 0/732 0/732 Mean 0/44 0/814815 0/72963
Table 3.Percentage of excess inputs with respect to input variables and radiology units.
Unit Economic
efficiency score
Technical efficiency
Allocative efficiency
Economic
efficiency Unit
Economic efficiency score
Technical efficiency
Allocative efficiency
Economic efficiency
1 17 1 0/627 0/627 15 1 1 1 1
2 18 1 0/608 0/608 16 14 1 0/704 0/704
3 1 1 1 1 17 9 0/918 0/861 0/791
4 3 1 0/953 0/953 18 6 1 0/830 0/830
5 5 0/911 0/933 0/850 19 8 1 0/812 0/812
6 4 0/920 0/938 0/862 20 20 0/747 0/705 0/727
7 7 0/900 0/903 0/813 21 16 0/714 0/903 0/644
8 22 0/609 0/839 0/511 22 21 0/750 0/699 0/524
9 15 0/672 0/978 0/657 23 19 0/612 0/945 0/578
10 2 1 0/977 0/977 24 1 1 1 1
11 13 0/900 0/783 0/705 25 20 0/763 0/672 0/513
12 11 0/806 0/925 0/746 26 10 0/992 0/781 0/755
13 1 1 1 1 27 23 0/556 0/887 0/494
[image:4.595.59.540.554.737.2]14 12 1 0/732 0/732
Table 4. The optimum economic amount of inputs in order to minimize the costs of radiology units.
Unit First input (expert) Second input
(Technician)
Third input
(Imaging device) Unit First input (Expert)
Second input (Technician)
Third input (Imaging device)
1 0 3 2 15 6 4 6
2 0 3 2 16 2 2 2
3 1 4 2 17 0 3 2
4 / 3 3 2 18 / 6 4 3
5 /2 3 2/7 19 0 3 2
6 / 8 3 2 20 4 5 4
7 2 6 4 21 1 3 2
8 1 4 /5 2 /5 22 / 6 4 3
9 / 3 3 2 23 1 4 2
10 0 3 2 24 31 10 14
11 0 3 2 25 7 5 6 /5
12 1 /5 4 /5 3 26 3 6 5
13 3 7 6 27 1 5 2
It should be noted that pure technical efficiency (man-agement efficiency) is possible only if technical effi-ciency is estimated under fixed output conditions with respect to the scale. Moreover, most studies around the globe have focused on technical and scale efficiencies rather than management efficiency. Our findings on evaluating management efficiencies showed a score of 0.2 to 1. The mean management efficiency, assuming a fixed output to scale (0.605) was less than scale effi-ciency and management effieffi-ciency assuming a varied output to scale. Pure technical efficiency is an indicator of correct management and a correct combination of production frontiers. During 2011, about 19% of studied hospitals were completely efficient in this regard. In a previous study on 10 public hospitals in Tehran, Iran, the mean management efficiency score during an 8-year pe-riod was estimated to be 0.963 (range: 0.788 - 1) [3].
In our study, considering the mean technical efficiency score (0.880), there is a 12% potential for improving the efficiency of radiology units. Also, this shows that 45% of radiology units had a technical efficiency score of 1 and were efficient. Moreover, units that did not have complete efficiency had excess production factors, espe-cially expert personnel (39%). This is consistent with another similar study reporting an excess input related to paramedical personnel (38.54%).
Allocative efficiency is obtained by dividing economic efficiency and technical efficiency assuming a varied out-put with respect to scale. In fact, after determining the price on inputs in the model, allocative efficiency be-comes important. Lack of allocative efficiency is related to the inadequate distribution of resources (between terventions and different treatment methods) and the in-correct use of various technologies. About 15% of radi-ology units have complete allocative efficiency. The al-locative efficiency scores of the 27 studies units was in a logical range (0.6 - 1). In this study the mean allocative efficiency (0.852) was less than the mean technical effi-ciency (0.880). Allocative effieffi-ciency of private and pub-lic Iranian hospitals was respectively 0.76 and 0.77 in a previous report [14].
The economic efficiency of radiology units is obtained by multiplying technical and allocative efficiencies. Eco-nomic efficiency is reached is resources are not wasted and used optimally. This in turn depends on selecting a combination of inputs with the least costs. In this study, we evaluated the different types of efficiencies of radi-ology units of public hospitals. The mean economic effi-ciency score of these units was 0.749 which was lower than their allocative and technical efficiencies. Of course, the obtained number was the result of multiplying tech-nical and allocative efficiencies. The least obtained eco-nomic efficiency score was that of hospital 27 (0.495).
This lack of efficiency is mostly related to technical effi-ciency than allocative effieffi-ciency. The highest economic efficiency score was related to hospitals 3, 13, 15, and 24 with a score of 1. These hospitals were completely cient with respect to their technical and allocative effi-ciencies. In other words, about 15% of radiology units were economically efficient. In a study on 94 public hos-pitals in Spain, an economic efficiency of 24.5% was reported. In a study among 21 public hospitals in Fars province the mean economic efficiency score was re-ported to be 0.53 [4]. Moreover, Sheikhzadeh and col-leagues reported mean economic efficiency scores of 0.52 and 0.68 for private and public hospitals, respec-tively [14].
This study is the only study done on the economic ef-ficiency of radiology units using the data envelopment analysis method. Most studies in this regard have fo-cused on technical efficiency. Moreover, we included all public hospitals affiliated to Shiraz University of Medi-cal Sciences. We also performed a systematic study on the input and output variables with respect to previous studies considering the importance of their correct selec-tion. On the other hand, our study also had some limita-tions. In Iran, in all efficiency evaluations, the inputs and outputs are similarly weighted. For example, when the number of experts, technicians, physicians, and active beds are considered as inputs in an efficiency study, a similar impact or weigh is considered for a technician and a physician. This could be considered as a weakness per se. The DEAP2 software cannot distinguish the weight of the variables. This problem is also evident in the out-puts. For instance, when the number of healthy discharged patients is considered as an output, all patients that are discharged from various wards are considered equal. In reality, a patient that is discharged from the orthopedics ward is not in the same condition as a patient discharged from the surgery wards.
5. CONCLUSION
Economical efficiency can be attained when resources are used in the best possible way and not wasted. There-fore, a combination of inputs that comprise the lowest costs should be selected.
ACKNOWLEDGEMENTS
We would like to thank all the personnel of the studied hospitals.
AUTHORS’ CONTRIBUTION
All authors contributed equally.
FUNDING/SUPPORT
grant from the Vice-Chancellor of Research Affairs of Shiraz Uni-ver-sity of Medical Sciences (grant number: 6360).
REFERENCES
[1] Saber Mahani, A., etal. (2012) Comparing the efficiency of kerman province towns in acquiring human develop-ment index via data envelopdevelop-ment analysis. Iranian Red Crescent Medical Journal, 14, 248-249.
[2] Despotis, D.K. (2005) A reassessment of the human de-velopment index via data ende-velopment analysis. Opera-tional Research Society Journal, 56, 969-80.
[3] Cooper, W.W., Seiford, L.M. and Tone, K. (2007) Data Envelopment Analysis: A comprehensive text with mod-els, applications, references and DEA-solver software. Springer Science and Business Media, LLC, New York.
[4] Nahid, H., et al. (2012) Cost efficiency of the family physician plan in Fars Province, Southern Iran. Iranian Journal of Medical Sciences, 37, 253-259.
[5] Giokas, D. (2002) The use of goal programming, regres- sion analysis and data envelopment analysis for estimat- ing efficient marginal cost of hospital services. Multi- criteria Decision Analysis, 11, 261-268.
[6] Newbrander, W., Barnum, H. and Kutzin, J. (1992) Hos- pital economics and financing in developing countries, WHO.
[7] Somanathan, A., Honson, K. and Doralawila, T. (2000) Operating efficiency in public sector health facilities in
sirilanka: Measurement and institutional determinantes of performance. PHR.
[8] Ferrier, G.D. and Lovell, C.A.K. (1990) Measuring cost efficiency in banking econometrics and linear program-ming evidence. Journal of Econometrics, 46, 229-245. http://dx.doi.org/10.1016/0304-4076(90)90057-Z [9] Byrnes, P. (1994) Analysing technical and allocative
effi-ciency of hospitals. In: Charnes, A., Cooper, W. and Lewin, A., Eds., DEA Theory, Methodology and Applica-tions, Kluwer, Boston.
[10] Valdmanis, V. (1992) Sensivity Analysis for DEA Model —An empirical example using public vs. NFP hospital. Journal of Public Economics, 48, 185-205.
[11] Maindiratta, A. (1990) Largest size-efficient scale and size efficiencies of decision-making units in data envel- opment analysis. Journal of Econometrics, 46, 57-72. http://dx.doi.org/10.1016/0304-4076(90)90047-W [12] Hatam, N. (2008) The role of data envelopment analysis
(DEA) pattern in the efficiency of social security hospi-tals in Iran. Iranian Red Crescent Journal, 10, 2-7. [13] Sheikhzadeh, Y., Roudsari, A.V., Vahidi, R.G.,
Em-rouznejad, A. and Dastgiri, S. (2012) Public and private hospital services reform using data envelopment analysis to measure technical, scale, allocative, and cost efficien-cies. Health Promotion Perspectives, 2, 28-41.