Citation:
Dixon, S and Guest, E and Dixon, MB and Elliot, J and Mullier, D (2011) DScent Final Report. Technical Report. Leeds Metropolitan University.
Link to Leeds Beckett Repository record:
http://eprints.leedsbeckett.ac.uk/858/
Document Version: Monograph
The aim of the Leeds Beckett Repository is to provide open access to our research, as required by funder policies and permitted by publishers and copyright law.
The Leeds Beckett repository holds a wide range of publications, each of which has been checked for copyright and the relevant embargo period has been applied by the Research Services team.
We operate on a standard take-down policy. If you are the author or publisher of an output and you would like it removed from the repository, please contact us and we will investigate on a case-by-case basis.
DScent
Final Report
Leeds Metropolitan University
(Faculty of Arts, Environment & Technology)
Authors: S. Dixon, Dr M. Dixon, Dr J. Elliot, Dr E. Guest, Dr D. Mullier
Version: 2.0
Date: 31st January 2011
Status: Issue
Document
1. Document Control
1.1 Quality Review
Name Role Signature Date
John Elliott AI Expert
Elizabeth Guest Dscent Principle
Investigator
Duncan Mullier AI Expert
1.2 Change History
Version Date Author Change Description
0.1 07/09/2010 S. Dixon Initial Draft
0.2 30/09/2010 S. Dixon
D. Mullier
Amendments regarding the neural network
0.3 12/10/2010 S.Dixon
D.Mullier J.Elliott
Amendments regarding the behavioural based AI
1.0 01/11/10 S.Dixon
D.Mullier J.Elliott E.Guest
Amendments post walkthrough for Issue.
2.0 31/01/2011 S.Dixon
M.Dixon E.Guest D.Mullier J.Elliott
Amendments post article submissions (no code in appendixes)
1.3 Distribution
Name Title
Elizabeth Guest Dscent Principle Investigator
Mark Dixon Senior Lecturer
John Elliot AI Expert
Duncan Mullier AI Expert
Tom Ormerod DScent Lead Partner
EPSRC Final Report
Nicholas M Stake Holder
Andrea Davis Senior Officer (University Research
Office)
Richard Lampard Head of Networks Research
3
2. Table of Contents
1. Document Control ... 2
1.1 Quality Review ... 2
1.2 Change History ... 2
1.3 Distribution ... 2
2. Table of Contents ... 3
3. Introduction ... 5
4. The Games ... 5
4.1 Cutting Corners Board Game ... 6
4.2 The Location Based Game ... 7
5. Phase One Development ... 10
5.1 Neural Networks ... 11
5.1.1 Different Types of Neural Network ... 11
5.2 Cutting Corners Board Game Data ... 12
5.3 Cutting Corners Board Game Results ... 13
5.3.1 The Mann Whitney U Test ... 13
5.3.2 Altering the Result Threshold ... 14
5.4 Summary of Results ... 15
5.5 Phase One Conclusion ... 16
6. Phase Two Development ... 17
6.1 DScentTrail System ... 17
6.1.1 User Interface Design ... 17
6.1.2 Technical System Design ... 21
6.1.2.1 DScent.Model Class Model ... 22
6.1.2.2 GUI Class Model ... 23
6.1.2.3 GUI DScentTrail Main Window (Object Model) ... 24
6.1.2.4 GUI Database Connection (Object Model) ... 25
6.1.2.5 GUI New Suspect (Object Model) ... 26
6.1.2.6 GUI Meetings Set Up (Object Model) ... 27
6.1.2.7 GUI Time Interval Set Up (Object Model) ... 28
6.1.3 Screen Shots ... 29
6.1.3.1 New Database Connection ... 30
6.1.3.2 New Primary Suspect ... 31
6.1.3.3 Meetings Configuration ... 32
6.1.3.4 Time Interval Configuration ... 33
6.1.3.5 Primary Suspect Timeline Showing Non-deceptive Behaviour ... 34
6.1.3.6 Primary Suspect Timeline Showing Deceptive Behaviour ... 35
6.2 Artificial Intelligence (AI) ... 36
6.2.1 Neural Network ... 36
6.2.1.1 Neural Network Input File ... 37
6.2.2 Behavioural Based Artificial Intelligence ... 40
6.2.2.1 Theme 5.0 ... 40
6.2.2.1.1 Temporal Analysis of Results ... 41
6.2.2.1.2 Event Based Analysis of Results ... 43
6.2.2.2 Behavioural Based AI Conclusions ... 45
Appendix A - DScent Data Dictionary ... 47
Appendix B - Data File ... 60
Appendix C - Results Cross Reference ... 62
Appendix D - Test Results ... 65
Appendix E - The Root Mean Square Error (RMSE) During Training ... 68
Appendix F - Calculation of U Value for Mann Whitney U Test ... 74
Appendix G - Altered Results Threshold ... 75
Appendix H – Theme Category Table ... 76
Appendix I – Theme Data File ... 78
5
3. Introduction
DScent was a joint project between five UK universities combining research theories in the disciplines of computational inference, forensic psychology and expert decision-making in the area of counter-terrorism. This document discusses the work carried out by Leeds Metropolitan University which covers the research, design and development work of an investigator support system in the area of deception using artificial intelligence. For the purposes of data generation along with system and hypothesis testing the project team devised two closed world games, the Cutting Corners Board Game and the Location Based Game.
DScentTrail presents the investigator with a ‘scent trail’ of a suspect’s behaviour over time, allowing the investigator to present multiple challenges to a suspect from which they may prove the suspect guilty outright or receive cognitive or emotional clues of deception (Ekman 2002; Ekman & Frank 1993; Ekman & Yuille 1989; Hocking & Leathers 1980; Knapp & Comadena 1979). A scent trail is a collection of ordered, relevant behavioural information over time for a suspect. There are links into a neural network, which attempts to identify deceptive behavioural patterns of individuals.
Preliminary work was carried out on a behavioural based AI module which would work separately alongside the neural network, with both identifying deception before integrating their results to update DScentTrail. Unfortunately the data that was necessary to design such a system was not provided and therefore, this section of research only reached its preliminary stages.
To date research has shown that there are no specific patterns of deceptive behaviour that are consistent in all people, across all situations (Zuckerman 1981). DScentTrail is a decision support system, incorporating artificial intelligence (AI), which is intended to be used by investigators and attempts to find ways around the problem stated by Zuckerman above.
4. The Games
For data protection, security and ethical reasons real life data could not be used and therefore, for the purpose of data generation and testing of hypothesis, the project team devised two closed world games.
4.1 Cutting Corners Board Game
Game participants either acted as potentially dishonest builders constructing
part of an Olympic stadium, or terrorists masquerading as builders with the aim of planting explosives. The game was divided into rounds with a certain number of dice throws per player and the winner was the first to accomplish their aim.
Each game consisted of four players, White (W), Yellow (Y), Blue (B) and Green (G). Between one and three players acted as terrorists (t). During the game the players could visit three different types of virtual location; the Builders Yard (BY) selling virtual construction blocks, soil and fertiliser, the Electronics Store (ES) selling virtual wiring and dynamite and the Olympic Site/Goal (Go) where virtual items could be unloaded. An initial amount of virtual cash was given to each player to purchase items and a virtual van. During the game van searches and van weight checks were carried out where players displayed two items in their van and were weighed respectively. If the van exceeded the maximum weight allowance of 100kg the player did not receive a cash reward. For each van weigh check all players would receive the cash payment regardless of whether they were weighed, provided they were not found overweight. On completion of each round the sum of the items sold from each shop was calculated. Figure 4.1 shows an example of information that may have been known at the end of a game.
G ame R oun d P lay er Loc at ion 1 Loc at ion 2 Loc at ion 3 W ir e Dy n ami te C on B lo c k So il F e rt ilis e r V an W e ight W ir e S o ld D y n S o ld C on S ol d S o il S o ld F e rt S o ld
13 5 W ES Go 6 2 3 1 0
Y BY Go
B ES Go
G(t) BY Go
8 W BY 10 3 2 1 1
Y ES 1 1 60
B BY
Gt ES 2 70
11 W Go BY 2 100 0 1 0 2 0
Y ES 1 1 70
B Go
G(t) Go
14 W 1 0 5 3 1
Y BY 1 1
B BY 200
G(t) ES BY 1 1 60
17 W Go 0 0 0 1 0
Y Go BY 1 50
B Go
G(t) Go
20 W ES 4 2 2 1 0
Y BY Go
B ES
7
Figure 4.1 Board game example data
4.2 The Location Based Game
The Location Based Game was similar to the board game where participants
were either acting as potentially dishonest builders constructing part of an
Olympic stadium, or terrorists masquerading as builders with the aim of planting explosives. Participants from a variety of different backgrounds were recruited to partake in the game trials over a number of months. These participants traversed set locations (see figure 4.2) using GPS enabled devises to communicate, navigate and purchase items. For reasons discussed in the conclusions, only 2 games worth of data was available for testing purposes.
Each game comprised of four teams, and each team comprised of three players, a foreman, and two of the following tradesmen: an electrician; an explosives expert; or a builder. The games were divided into four building tasks and the winning team was the first to complete all four of these tasks. Virtual cash rewards were given to teams upon completion of tasks. Each task involved specific team members being in certain locations at certain times. They involved participants purchasing specific items and unloading these at their site. One team member was given the role of van driver and therefore could purchase items. Vans were virtual and could be transferred between team members via the mobile device.
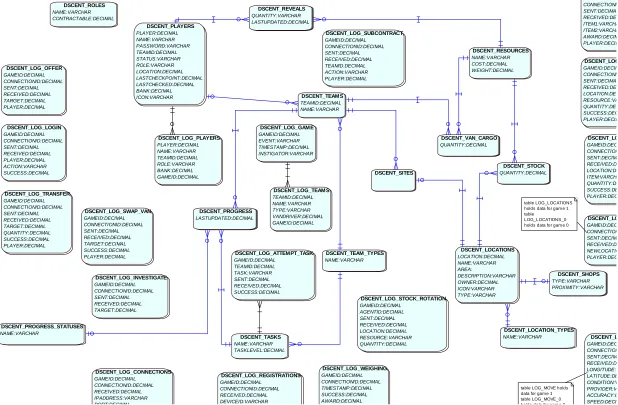
All data captured from the games was stored in the DScent database which can be seen in figure 4.3 below. For a description of the entities and
attributes please refer to Appendix A.
©2011 Google, Map Data ©2011 Tele Atlas
Figure 4.2 – Map of Location Based Game Playing Area
DScent DSCENT_LOCATIONS LOCATION:DECIMAL NAME:VARCHAR AREA: DESCRIPTION:VARCHAR OWNER:DECIMAL ICON:VARCHAR TYPE:VARCHAR DSCENT_LOCATION_TYPES NAME:VARCHAR DSCENT_LOG_ATTEMPT_TASK GAMEID:DECIMAL TEAMID:DECIMAL TASK:VARCHAR SENT:DECIMAL RECEIVED:DECIMAL SUCCESS:DECIMAL DSCENT_LOG_CONNECTIONS GAMEID:DECIMAL CONNECTIONID:DECIMAL RECEIVED:DECIMAL IPADDRESS:VARCHAR PORT:DECIMAL DSCENT_LOG_GAME GAMEID:DECIMAL EVENT:VARCHAR TIMESTAMP:DECIMAL INSTIGATOR:VARCHAR DSCENT_LOG_INVESTIGATE GAMEID:DECIMAL CONNECTIONID:DECIMAL SENT:DECIMAL RECEIVED:DECIMAL TARGET:DECIMAL DSCENT_LO GAMEID:DEC CONNECTION SENT:DECIM RECEIVED:D NEWLOCATIO PLAYER:DEC DSCENT_LOG_LOGIN GAMEID:DECIMAL CONNECTIONID:DECIMAL SENT:DECIMAL RECEIVED:DECIMAL PLAYER:DECIMAL ACTION:VARCHAR SUCCESS:DECIMAL DSCENT_L GAMEID:DEC CONNECTION SENT:DECIM RECEIVED:D LONGITUDE:D LATITUDE:DE CONDITION:V PROVIDER:V ACCURACY:D SPEED:DECI DSCENT_LOG_OFFER GAMEID:DECIMAL CONNECTIONID:DECIMAL SENT:DECIMAL RECEIVED:DECIMAL TARGET:DECIMAL PLAYER:DECIMAL DSCENT_LOG_PLAYERS PLAYER:DECIMAL NAME:VARCHAR TEAMID:DECIMAL ROLE:VARCHAR BANK:DECIMAL GAMEID:DECIMAL DSCENT_LO GAMEID:DEC CONNECTION SENT:DECIM RECEIVED:D LOCATION:DE ITEM:VARCH QUANTITY:DE SUCCESS:DE PLAYER:DEC DSCENT_LOG_REGISTRATIONS GAMEID:DECIMAL CONNECTIONID:DECIMAL RECEIVED:DECIMAL DEVICEID:VARCHAR DSCENT_LOG GAMEID:DECIM CONNECTIONI SENT:DECIMA RECEIVED:DE ITEM1:VARCHA ITEM2:VARCHA AWARD:DECIM PLAYER:DECIM DSCENT_LOG_STOCK_ROTATION GAMEID:DECIMAL AGENTID:DECIMAL SENT:DECIMAL RECEIVED:DECIMAL LOCATION:DECIMAL RESOURCE:VARCHAR QUANTITY:DECIMAL DSCENT_LOG_SUBCONTRACT GAMEID:DECIMAL CONNECTIONID:DECIMAL SENT:DECIMAL RECEIVED:DECIMAL TEAMID:DECIMAL ACTION:VARCHAR PLAYER:DECIMAL DSCENT_LOG_SWAP_VAN GAMEID:DECIMAL CONNECTIONID:DECIMAL SENT:DECIMAL RECEIVED:DECIMAL TARGET:DECIMAL SUCCESS:DECIMAL PLAYER:DECIMAL DSCENT_LOG_TEAMS TEAMID:DECIMAL NAME:VARCHAR TYPE:VARCHAR VANDRIVER:DECIMAL GAMEID:DECIMAL DSCENT_LOG_TRANSFER GAMEID:DECIMAL CONNECTIONID:DECIMAL SENT:DECIMAL RECEIVED:DECIMAL TARGET:DECIMAL QUANTITY:DECIMAL SUCCESS:DECIMAL PLAYER:DECIMAL DSCENT_LOG GAMEID:DECIM CONNECTIONI SENT:DECIMA RECEIVED:DE LOCATION:DE RESOURCE:VA QUANTITY:DE SUCCESS:DEC PLAYER:DECIM DSCENT_LOG_WEIGHING GAMEID:DECIMAL CONNECTIONID:DECIMAL TIMESTAMP:DECIMAL SUCCESS:DECIMAL AWARD:DECIMAL DSCENT_PLAYERS PLAYER:DECIMAL NAME:VARCHAR PASSWORD:VARCHAR TEAMID:DECIMAL STATUS:VARCHAR ROLE:VARCHAR LOCATION:DECIMAL LASTCHECKPOINT:DECIMAL LASTCHECKED:DECIMAL BANK:DECIMAL ICON:VARCHAR DSCENT_PROGRESS LASTUPDATED:DECIMAL DSCENT_PROGRESS_STATUSES NAME:VARCHAR DSCENT_RESOURCES NAME:VARCHAR COST:DECIMAL WEIGHT:DECIMAL DSCENT_REVEALS QUANTITY:VARCHAR LASTUPDATED:DECIMAL DSCENT_ROLES NAME:VARCHAR CONTRACTABLE:DECIMAL DSCENT_SHOPS TYPE:VARCHAR PROXIMITY:VARCHAR DSCENT_SITES DSCENT_STOCK QUANTITY:DECIMAL DSCENT_TASKS NAME:VARCHAR TASKLEVEL:DECIMAL DSCENT_TEAMS TEAMID:DECIMAL NAME:VARCHAR DSCENT_TEAM_TYPES NAME:VARCHAR DSCENT_VAN_CARGO QUANTITY:DECIMAL table LOG_LOCATIONS holds data for gam e 1 table LOG_LOCATIONS_0 holds data for gam e 0
table LOG_MOVE holds data for gam e 1 table LOG_MOVE_0 holds data for gam e 0
5. Phase One Development
The Cutting Corners board game data was used for phase one development which consisted of various types of neural networks.
The use of various AI techniques, such as data mining, artificial neural networks, symbolic AI and Case Based Reasoning, for counter-terrorism has been advocated by Markman et al (2003) and Marappan et al (2008). Projects which consider such techniques are discussed below.
Scianta Intelligence (2001) provides a precise definition of data mining:
“Data Mining, also called Knowledge Discovery, is a general term for a variety of interlocking technologies that, used together, find, isolate, and quantify patterns hidden in large and often disparate collections of data. As a general knowledge extraction process, its primary goal is the discovery of nontrivial and potentially valuable hidden in local files, databases, and in repositories scattered across distributed networks.”
Schneier (2006) in his article on Why Data Mining Won’t Stop Terror, writes
that data mining works best when you're searching for a well-defined profile, a reasonable number of attacks per year and a low cost of false alarms. Rudmin (2006), Professor of Psychology at the University of Tromso, Norway, is also sceptical regarding data mining techniques used for counter-terrorism and disregards them completely as in order to make a Bayesian computation, he estimates that at best in the USA there would be a base-rate of 1 terrorist per 300,000 people and that if a surveillance monitoring system had an accuracy rate of 40% positive identification of real terrorists then according to Bayes’ Theorem (Joyce 2008) the misidentification rate would be .01%, or 30,000 innocent people. Rudmin stresses that these numbers are simply examples based on one particular technology.
Data mining was not used on DScent since it is generally used for extracting information from large quantities of data that is collected for reasons other than for the purpose of mining itself. The DScent data was explicitly designed and collected for identifying suspicious behaviour. DScent would not encounter the problems outlined by Professor Rudmin of having to potentially question 30,000 innocent people as the set did not contain the entire population, it is merely a well established sub-set. Ware (2002) in his paper on antiterrorism states that neural networks do not lend themselves easily to real-time updated information and has concerns regarding the limited historical data on terrorist attacks, he further comments on how terrorist tactics are not static and change over time. These issues have been carefully considered during the project and are discussed further below.
11
to the neural network and keeping these to an absolute minimum, the amount of historical data required for training will be far less. Furthermore, if the neural network can identify deception amongst humans from a small amount of inputs then we are getting closer to that “well-defined profile” of which Schneier speaks.
5.1 Neural Networks
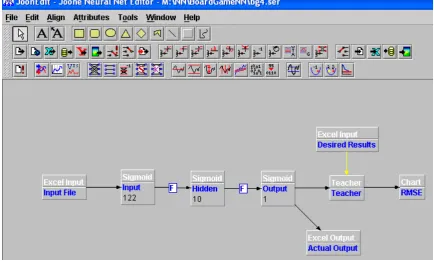
The neural networks were developed within the JOONE (Java Object Oriented Neural Engine) GUI editor. JOONE is an open source, object based neural network framework written in Java (Marrone 2010) with a graphical front end. EasyNN-plus (Neural Planner Software 2010) was used to validate the output from Joone. The tool is limited, though adequate to quickly validate the results.
Figure 5.1 shows one of the experimental configurations of feed-forward back-propagation neural network used for the DScent project. This configuration shows the input data from an Excel spreadsheet entering the input layer containing 122 neurons, progressing to a hidden layer containing 10 neurons, before finally reaching the output layer containing a single neuron. The output value is in the range zero to one and is passed into an Excel spreadsheet, all three layers utilise the sigmoid activation function (Mitchell 1997). The Teacher layer trains the network by presenting it with complete examples, including whether the example is a terrorist or not (this is known as supervised learning). The training is then presented graphically via a Root Mean Square Error chart (RMSE) see section 5.3 Cutting Corners Board Game Results for more details.
5.1.1 Different Types of Neural Network
There are two main types of neural network and these are classified by the method in which they train, supervised and unsupervised.
Figure 5.1 An example of a neural network architecture created within the Joone Neural Network Editor
5.2 Cutting Corners Board Game Data
The data from the Cutting Corners board game was collated into an excel spread sheet. (See Appendix B) The spread sheet contained 144 rows of game data which resulted from playing 36 games. This game data was divided into separate training and test files with a ratio of 4:1 respectively. Three types of training and three types of test files, each containing varying numbers of terrorists were created for each variation on the input file as can be seen in table 5.1 below. Note that the training and corresponding test files have been colour coded for ease of recognition in the results tables shown within the appendices.
File Record Range File Partition Number
of
Terrorists
Training File 1
29-144 Train with last 116 48
Training File 2
1-116 Train with first 116 40
Training File 3
1-88, 97-100, 105-108, 113-116, 121-124, 129-132, 137-144
Train with least number of terrorists
35
Test File 1 1-28 Test with first 28 7
Test File 2 117-144 Test with last 28 15
Test File 3 89-96, 101-104, 109-112, 117-120, 125-128, 133-136
Test with highest number of terrorists
20
[image:13.595.88.523.79.340.2]13
The effectiveness of a neural network is greatly reduced when the number of variables (horizontal), do not have adequate training pattern examples (vertical), as the network does not have the opportunity to explore a large proportion of the possibilities. It is therefore necessary to prune the input file of unnecessary variables prior to training. It is apparent that by knowing which variables are contributing to the neural network (Sexton & Sikander 2002) the developer has not only improved the effectiveness of the networks ability to generalise but also, and maybe more importantly, they have gained a better understanding of the problem. Multiple experiments were performed excluding different variables within the import file to enable the ultimate level of accuracy given the number of training patterns available.
The Results Cross Reference table in Appendix C shows which variables were either included or excluded from each experiment.
5.3 Cutting Corners Board Game Results
Due to the severe lack of training data the results were predictably inaccurate, though much better than anticipated. This did not however present a problem, as the purpose of phase one was to experiment with different tools; architectures; input variables; the ratio of positive and negative patterns presented within the training and test files and to identify the optimal classification threshold within the output. 55 neural network experiments were performed within phase one, the summation of these results can be seen in Appendix D. A threshold of 0.5 was used as the cut-off point, where 0 indicated ‘builder’ and 1 indicated ‘terrorist’, therefore any result greater than or equal to 0.5 was deemed to be a terrorist and any result less than 0.5 was deemed to be a builder. The Root Mean Square Error (RMSE) (Levinson 1946) was plotted for each experiment during training, see Appendix E, to establish the optimum number of times the neural network was presented with
the entire training set, known as an epoch. The X axis of the RMSE graphs
represents the number of epochs and the Y axis represents the error. It is crucial not to over train the network as it has the potential to memorise the training data and looses the ability to generalise with different data.
5.3.1 The Mann Whitney U Test
Figure 5.2 -Results from automated calculator for comparison of worst against best neural network
The test showed that there was not a significant difference between the results of the best and the worst neural networks. Though, when the best neural network (experiment I) results were compared against a random set, the significance was rated as ‘highly significant’, proving the value of the neural network even with such small amounts of training data, see results below in Figure 5.3 below.
Figure 5.3 -Results from automated calculator for comparison of best neural network results against a random set
5.3.2 Altering the Result Threshold
[image:15.595.92.536.390.484.2]15
positive. Initially, the result was classified as being positive if the resulting number fell between 0.5 and 1.0, else it was negative. If this arbitrary result threshold value of 0.5 was shifted, so as anything greater than or equal to 0.13 became a positive result and anything less than 0.13 became a negative result, then the number of true positives was increased from 53% to 60%. This did however, have a slightly negative effect on the total number of correct classifications within the test files, taking the percentage down from 64% to 60%. This percentage loss was deemed acceptable, as it was not identifying terrorists but merely flagging those who merited further investigation, resulting in a slightly larger subset.
The stakeholders were consulted about what they wanted from the project, in particular whether they wanted to know who the terrorists were from a small previously identified population or whether they wanted the system to identify a subset that merited further investigation, they chose the latter. By moving the threshold to reduce false positives, the project met this objective. Jonas and Harper in their book on Effective Counterterrorism and the Limited Role of Predictive Data Mining discuss this point further (Jonas & Harper 2006). They state that it is a waste of the tax payers’ money developing data mining techniques to solve terrorism. This may be true, though to develop a decision support system which will provide a subset of potential terrorists for further investigation is quite different.
5.4 Summary of Results
This initial set of neural network experiments showed on average a 60% success rate and at best, a 68% success rate for correctly identifying terrorist behaviour (with a threshold of 0.13). The winning architecture consisted of all three layers; input, hidden and output using the sigmoid activation function. The hidden layer contained 10 neurons which resulted in 11% of the number of variables contained within the input file. The information variables which proved to be of importance were ‘locations’, ‘Stock Items’ and ‘Stock Take’. The variables which were excluded were ‘Game Number’, ‘Colour’ and ‘Van Weight’. The patterns within the training file were presented to the neural network randomly rather than in sequence and over 1500 epochs. Finally, the result threshold was set to 0.13.
generalise on. Not all games were played in full; they ended when one player won, which is another reason for the neural network incorrectly classifying records. This of course would also be the case in reality, you would not want to wait until the terrorist event had occurred before an arrest was made. The next stage of development would have been to introduce the concept of pattern completeness, this would be to train and refine the neural network on patterns with varying degrees of completeness and identifying chunks of behaviour which were deceptive in isolation. This type of discrete deception identification would be far more valuable in reality.
Problem domains such as counter-terrorism intrinsically contain many information variables. Each time a variable is added, the number of possible pattern combinations increases exponentially. Therefore, with 100 variables within the input file, a vast number of rows would be required to cover just a small number of possible combinations of data. Take for example, the winning neural network where only location information, stock items and stock take information was used (92 variables), each variable had an average of 4
possible values, i.e. 492, resulting in 2.45 x 1055 rows of training data required
to cover every possible combination. This poses a problem, as large numbers of historical patterns of terrorist behaviour are not available.
5.5 Phase One Conclusion
The neural network showed extremely promising results, on average a 60% success rate and at best a 68% success rate for correctly identifying deceptive behaviour, taking into account the sparse amount of training data. Future work is underway to develop a method for generating behavioural data, building on the rules of the board game. This can be done by combining intelligent agents (Evertsz 2009) with gene expression programming (Ferreira 2006) and the use of an Emdros database (Petersen 2004).
17
6. Phase Two Development
The Location Based Game data was used to help design and test the DScentTrail System during Phase two of the project. Phase two was split between three areas, the DScentTrail System and two external AI modules which included the neural network and a symbolic AI module.
6.1 DScentTrail System
A graphically based software product was developed to help visualise game data. Extensive research was carried out to ensure that the interface was designed in such a way that it would benefit investigators in an interview situation and not only serve as a visualisation tool within the project. Various types of information were collated, processed and then presented by means of a ‘scent trail’. DScentTrail has links into a neural network that attempts to identify deceptive behavioural patterns of individuals, giving further enrichment to the information available to the investigator, not only by supplying them with related information that may not have been possible to find manually but also reducing their cognitive overload, allowing them to concentrate on their interviewing techniques.
The DScentTrail System was designed and specified using various
techniques from the Unified Modelling Language (Booch, Jacobson &
Rumbaugh 2005) (UML), such as class and object modelling within the QSEE
Superlite Development Environment (Dixon 2004). All user interface design
was created using Microsoft Visio and was written in Java programming
language (Flanagan 2002) within the Eclipse Integrated Development
Environment(The Eclipse Foundation 2004) (IDE).
6.1.1 User Interface Design
Loc Builders
Site
Nat Electricians
CP1 Loc Electricians
Site Site
Loc Builders
Site
Loc Builders Site CP1(van)0kg
Loc Electricians
Nat Builders
Loc Electricians Loc Electricians
Nat Electricians
Nat Electricians
Site Nat Electricians
Site Site 10:00
10:02 10:04 10:06 10:08
10:10 10:12 10:14 10:16
10:18 10:20
10:22 10:24 10:26 10:28
10:30 10:32
10:34 10:36 10:38 10:40 10:42 10:44 10:46
New Suspect
Duncan
Tim/James Tim/Alex
Duncan
Sam – Game1 – 23/06/09 Duncan Telecoms: 35% Tim Telecoms: 45%
Actions DScentTrail File View Tools
CP1(van)2020kgWW
CP1
Nat Electricians Loc Electricians
Nat Builders
Loc Electricians
New Time
Meeting
RCP(van)2020kgWW
New db Connection
[image:19.595.91.486.73.377.2]Figure 6.1 - DScentTrail screen design (Primary and secondary suspects)
For all windows within the DScentTrail system, time travels down the y axis and suspect information is displayed along the x axis, both of which are scrollable. All windows display a suspects time-line. A time-line represents the ‘scent trail’ and shows a series of events for a player within a game, the name of the suspect is displayed at the top of the window. A time ordered list of locations and police checks is shown down the right side of the time-line, these locations are listed in the ‘The Location Based Game’ section above. If a participant who is driving a van enters a fixed or has an investigator initiated checkpoint additional information is displayed, consisting of the weight of the van and up to two items which they must reveal. In figure 2 above, Sam at 10.16am had an investigator initiated (random) checkpoint, had a van weight of 2020kg and revealed two wiring looms. At 10.26am Sam enters checkpoint 1 but as she is not driving a van, no additional information is displayed. Table 1 shows the codes used for the various stock items when revealed.
Stock Item Code
Dynamite D
Wiring Loom W
Construct ion Block B
Fertiliser F
Soil S
[image:19.595.93.300.642.727.2]19
The information down the left side of the primary suspect’s time-line shows potential meetings. A meeting is defined by the investigator; it is where two
players are within x meters for greater than y seconds. Certain locations may
be excluded, for example shops, checkpoints and sites, as these are areas where participants may naturally gather. To display a secondary suspect’s time-line the investigator would right click the mouse over a name down the left side of the primary suspect’s time-line, alternatively they may select ‘New Suspect’ from either the top menu bar under ‘File’ or from the side menu bar. Multiple secondary suspect time-lines may be displayed at one time.
The blue horizontal arrows in figure 2 show telecommunication activity between primary and secondary suspects with the arrow head indicating the direction of the call. The green horizontal bars indicate potential meetings, again between the primary and secondary suspects. Hovering the mouse over either type of highlighter bar provides additional information, for example call or meeting duration and detailed meeting location information. Nodes on the time-line are either shown in black or red, with black indicating normal behaviour and red indicating potentially deceptive behaviour; the red nodes varying in hue depending on the combined certainty factor generated from the AI modules, drawing the investigators attention to a potential terrorist.
Loc Builders
Site
Nat Electricians
CP1 Loc Electricians Site
Site 10:00
10:02
10:04
10:06
10:08
10:10 10:12 10:14 10:16
10:18 10:20
10:22 10:24 10:26
10:28
10:30 10:32
10:34 10:36
10:38 10:40
10:42
10:44
10:46
New Suspect
Duncan
Tim/James Tim/Alex
Duncan Sam – Game1 – 23/06/09 Actions
DScentTrail File View Tools
CP1(van)2020kgWW
New Time
Meeting
RCP(van)2020kgWW
New db Connection
Sam – 10:28 to 10:38 - The Downs
CP1
CP2
CP3 NB
LE
Site
LB
3
[image:21.595.91.504.70.397.2]2
Figure 6.2 - DScentTrail screen design (Trajectory of route)
21
Loc Builders
Site
Nat Electricians
CP1 Loc Electricians Site
Site 10:00
10:02
10:04
10:06
10:08
10:10 10:12 10:14 10:16
10:18 10:20
10:22 10:24 10:26
10:28
10:30 10:32
10:34 10:36
10:38 10:40
10:42
10:44
10:46
New Suspect
Duncan
Tim/James Tim/Alex
Duncan Sam – Game1 – 23/06/09 Actions
DScentTrail File View Tools
CP1(van)2020kgWW
New Time
Meeting
RCP(van)2020kgWW
New db Connection
0 5 10 15 20 25 30
C R C R C R C R C R C R
Tim Duncan James Alex Coral Tom
Sam – Game1 – 23/06/09 - Telecommunications
Figure 6.3 - DScentTrail screen design (Game Summary of Telecommunications Activity)
6.1.2 Technical System Design
The DScentTrail System is an Object Oriented (Ambler 2009) (OO) system,
designed with the use of UML (Booch 2005) diagrams. The game data was
captured and stored in an Oracle Spatial database(Oracle Corporation 2010)
by a partnering university. There were many tables in this database, though the ones significant to the DScentTrail system are shown in figure 4.3. The DScentTrail system connected to this Oracle database using the Java
Database Connectivity (JDBC) API (Reece 2000). The various class and
6.1.2.1 DScent.Model Class Model
dscent.model Class Model
+ Timeline
+ getEvents (start:Tim estam p,end:Tim estam p) :Event[0..*] + Tim eline(player:Player)
+ getEvents (duration:Duration) :Event[0..*] + getMovem entEvents (duration:Duration) :Movem ent[0..*] + addEvent(event:Event)
+ addSus picious Activity(suspicious Activity:Sus piciousActivity) + sortEvents ()
+ rem oveAllMeetings ()
+ getMeetingEvents(duration:Duration) :Meeting[0..*]
+ Area
- m ap : Object
+ getLocation(pos :Position) :Location - location : Location + Area()
+ addLocation(location:Location)
+ Location
- radius : double - nam e : String - id : long + setArea(area:Area) + setSize(radius:double) + setPosition(centralPos ition:Position) + Location(id:long,nam e:String) + getNam e() :String + getId() :long + isTim elineLocation() :boolean
+ Timestamp
- tim es tam p : java.util.Date + setTim es tam p(value:long) + toString() :String + Tim es tam p(value:long) + isAfter(otherTim e:Tim estam p) :boolean + isBefore(otherTim e:Tim es tam p) :boolean + isWithin(duration:Duration) :boolean + toTim e() :long
+ isWithinTim e(duration:Duration) :boolean + getDifference(otherTim e:Tim es tam p) :long + Tim es tam p(date:Date)
+ toTim eString() :String + getTim e() :long + com pareTo(other:Tim es tam p) :int
+ Duration
- start : Tim estam p - end : Tim estam p
+ contains(tim estam p:Tim es tam p) :boolean + overlaps(duration:Duration) :boolean
+ overlapsBy(duration:Duration,overlapAm ount:long) :boolean + getMilliseconds () :long
+ Duration(s tart:Tim es tam p,end:Tim es tam p) + toTim eString() :String
+ getEnd() :Tim estam p + getStart() :Tim estam p
+ Event
- tim e : Tim estam p - tim eline : Tim eline + getTim es tam p() :Tim estam p + Event(tim e:Tim es tam p) + setTim eline(tim eline:Tim eline) + com pareTo(other:Event) :int
+ SuspiciousActivity
+ setTim eline(tim eline:Tim eline)
+ Check
- fixedCP : FixedCheckpoint [0..1] + Check(tim e:Tim es tam p) + getFixedCheckPoint() :FixedCheckpoint + setFixedCheckPoint(fixedCP:FixedCheckpoint)
+ Movement
+ getPosition() :Pos ition - position : Pos ition
+ Movem ent(tim e:Tim es tam p,pos ition:Position)
+ Call
- duration : Duration - ins tigatedCall : Call - receivedCall : Call + Call(tim e:Tim estam p)
+ Meeting
- duration : Duration - player : Player
+ Meeting(tim e:Tim estam p,end:Tim estam p,position:Pos ition,player:Player) + addPlayer(player:Player)
- position : Pos ition
+ getDuration() :Duration + getMetPlayer() :Player + getPosition() :Pos tion
+ VanWeightCheck
- weight : double
+ VanWeightCheck(tim e:Tim es tam p,weight:double) + getWeight() :double
+ ResourceCheck
+ addResource(resource[0..*]) + Res ourceCheck(tim e:Tim estam p)
+ Shop
- shopNam e : String
+ addResourceType(resource:Res ourceType) + rem oveRes ourceType(resource:Res ourceTy + Shop(location:Location)
+ tim eline 1..1 + events 0..* + tim eline 1..1
+ suspicious Activities 0..*
+ receivedCall 0..1
+ ins tigatedCall 0..1
+ Position
- xCoord : double - yCoord : double + toString() :String
+ Pos ition(xCoord:double,yCoord:double)
+ isCloseTo(position:Pos ition,m axDis tance:double) :boolean + isCloseToLocation(location:Location) :boolean + calcDistance(pos ition:Pos ition) :double
+ area 1..1 + locations 1..* This is the UML clas s m odel which s hows
the m ain clas ses us ed to s tore the underlying data for the ds centTrail s oftware.
+ ResourceType
- resourceNam e : String - resourceCos t : float - resourceWeight : float
+ Res ourceType(res ourceNam e:String,res ourceCost:float,resourceWeight:float)
+ FixedCheckpoint
- location : Location - checks : Check [0..*] + FixedCheckpoint(location:Location) + addCheck(check:Check) + getLocation() :Location + checks 0..*
+ fixedCP 0..1
+ fixedCP 1..1
+ location 1..1 + s + location 1..1
+ m ovem ent 1..1 + position 1..1
+ centralPosition 1..1 + location 0..1
A location will not always have a radius and a centralPos ition, ie. when it is the wilderness !
+ Game
- gam eID : long + Gam e(gam eID:long,area:Area) + getID() :long
+ addPlayer(player:Player) + getPlayers () :Player[3..*] + getArea() :Area
+ getNam edPlayer(nam e:String) :Player
+ Player
- playerId : long - playerNam e : String
+ Player(playerNam e:String,playerID:long) + getNam e() :String
+ setGam e(gam e:Gam e) + getGam e() :Gam e + setVan(van:Van) + getTim eline() :Tim eline + getID() :long
+ player 3..* + gam e 1..1
+ gam e 1..*
+ area 1..1
+ player 1..1 + tim eline 1..1
+ players 1..1
+ m eeting 0..*
+ CashCheck
- bank : float
+ Cas hCheck(tim e:Tim es tam p)
Comparable
+ OwnedResource
- startTim e : Tim es tam p
+ OwnedResource(res ource:ResourceType,own + own + resource 1..1
+ Van
+ van 0..1
+ player 1..1
+ 1..1
+ foundRes ources 0..2
+ ResourceOwner
+ Res ourceOwner()
+ addResource(resource:OwnedResource) + getRes ource(type:ResourceType) :OwnedRes ource
+ owner 1..1
+ resources 1..* + 1..1
+ resourceLis t 1..*
23
6.1.2.2 GUI Class Model
GUI Class Model
+ 1..1
+ 0..*
+ DScentTrail_1
+ m ain(args :String[]) - createContentPane() :Container - BACKGROUNDCOLOUR : Color - fram e : JFram e - db : DBAcces s
- createTopMenuBar() :JMenuBar - createSideMenu() :JPanel - createIm ageIcon(path:String) :Im ageIcon + DScentTrail()
- WINDOW_WIDTH : int = 1170 - WINDOW_HEIGHT : int = 800 - MIN_WINDOW_WIDTH : int = 300 - MIN_WINDOW_HEIGHT : int = 440 - SIDE_MENU_WIDTH : int = 82 - TIME_WIDTH : int = 80 - TIME_LINE_WIDTH : int = 700 - MENU_BUTTON_SPACER : Dim ens ion = 62, 20 - ps tlp : Prim arySuspectTim elinePanel - tp : Tim ePanel - holderPanel : JPanel - suspectNam e : String - gam eNum : int - title : String
+ constructTitle(nam e:String,gam e:int) :String ~ us erNam e : String
~ hostNam e : String ~ sid : String ~ port : int ~ pass word : String ~ tim eInt : int
+ setHolderPanelVisibility() - DScentTrail.ConnMenuItemListener - DScentTrail.PrintMenuItemListener - DScentTrail.ExitMenuItemListener ActionListener ActionListener ActionListener - DScentTrail.SuspectMenuItemListener ActionListener + DBConnectDialog - BACKGROUNDCOLOUR : Color - hostNam eTextField : JTextField - us erNam eTextField : JTextField - portTextField : JTextField - sidTextField : JTextField - pass wordTextField : JPass wordField - saveButton : JButton - cancelButton : JButton - tes tButton : JButton - connectButton : JButton + DBConnectDialog(owner:Fram e) + getHos tNam e() :String + getSID() :String + getUserNam e() :String + getPass word() :String + getPort() :int - data : String[2..2] - okPress ed : boolean
+ NewSuspectDialog - BACKGROUNDCOLOUR : Color - suspectNam eCom boBox : JCom boBox - gam eCom boBox : JCom boBox - startTim eCom boBox : JCom boBox - okButton : JButton - cancelButton : JButton
+ NewSuspectDialog(owner:Fram e,gam es:String[0..*],players:String[0..*]) - owner : Fram e
- endTim eCom boBox : JCom boBox
- toDate(tim e:String) :Date - okPress ed : Boolean
- OUTER_VERTICAL_SPACER : Dim ens ion = 360, 30 - OUTER_HORIZONTAL_SPACER : Dim ension = 35, 200 - DIALOG_SIZE : Dim ens ion = 420, 335 - ENTER_FRAME_SIZE : Dim ens ion = 420, 220 - INNER_VERTICAL_SPACER : Dim ens ion = 100, 15 - INNER_HORIZONTAL_SPACER : Dim ens ion = 15, 70 - BUTTONS_VERTICAL_SPACER_SIZE : Dim ension = 300, 5 - BUTTONS_PANEL_SIZE : Dim ens ion = 360, 40
+ getSuspectNam e() :String + getGam e() :int + getStartTim e() :Date + getEndTim e() :Date - startTim e : String [9..9] - endTim e : String [11..11]
+ 1..1
+ 1..1
+ MeetingsSetUpDialog - BACKGROUNDCOLOUR : Color - dis tanceCom boBox : JCom boBox - secondsCom boBox : JCom boBox - shopCheckBox : JCheckBox - checkpointCheckBox : JCheckBox - siteCheckBox : JCheckBox - okButton : JButton - cancelButton : JButton - dis tance : String [12..12] - seconds : String [6..6]
+ MeetingsSetUpDialog(owner:Fram e) - DIALOG_SIZE : Dim ens ion = 405, 420 - TOP_SPACER_SIZE : Dim ens ion = 385, - MAIN_PANEL_SIZE : Dim ens ion = 385, 4 - LEFT_SPACER_SIZE : Dim ens ion = 30, - COMBO_BOX_PANEL_SIZE : Dim ension - MIDDLE_SPACER_SIZE : Dim ension = 3 - CHECKBOX_PANEL_SIZE : Dim ension - TOP_BUTTON_SPACER_SIZE : Dim ens - BUTTONS_PANEL_SIZE : Dim ens ion = + getDistance() :String + getSeconds () :String
- NewSuspectDialog.CancelButtonListener + setVis ible(fals e:boolean)
- DBConnectDialog.SaveButtonListener
+ 1..1
+ 1..1 - DBConnectDialog.CancelButtonListener
ActionListener - DBConnectDialog.TestButtonListener
- NewSuspectDialog.OkButtonListener + setVis ible(fals e:boolean)
- MeetingsSetUpDialog.CancelButto + setVis ible(fals e:boolean) - DBConnectDialog.ConnectButtonListener
ActionListener
+ 1..1
+ 1..1 ActionListener
- MeetingsSetUpDialog.OkButtonListener + 1..1
+ 1..1
- TimeIntMenuItemListener
ActionListener
- DScentTrail.MeetingsSetUpMenuItemListener
+ 1..1 + 1..1
A ti Li t ActionListener ActionListener
ActionListener ActionListener
+ TimeIntSetUpDialog - BACKGROUNDCOLOUR : Color = light grey - DIALOG_SIZE : Dim ens ion = 365, 260 - MAIN_PANEL_SIZE : Dim ens ion = 345, 210 - TOP_SPACER_SIZE : Dim ens ion = 345, 20 - LEFT_SPACER_SIZE : Dim ens ion = 30, 260 - COMBO_BOX_PANEL_SIZE : Dim ension = 290, 80 - TOP_BUTTON_SPACER_SIZE : Dim ension = 345, 40 - BUTTONS_PANEL_SIZE : Dim ens ion = 292, 100 - tim eIntCom boBox : JCom boBox - okButton : JButton - cancelButton : JButton - m inutes : String [5..5]
+ Tim eIntSetUpDialog(owner:Fram e,currentInterval:int) ~ okPress ed : boolean
+ getTim eInt() :int
+ JDialog_3
+ 1..1
+ 0..*
+ 1..1
+ 1..1
+ 1..1
+ 0..*
+ 1..1
+ 2..2
+ 1..1
+ 0..1
+ 1..1 + 2..2
+ 1..1
+ 1..1
- DBConnectDialog.PortListener
+ 1..1 + 2..2
- CancelButtonListener + setVis ible(fals e:boolean) + 1..1
+ 1..1
+ 1..1
+ 1..*
- OkButtonListener + setVis ible(fals e:boolean) + 1..1
+ 1..1 + 1..1+ 1..1
+ J + JDialog
+ PrimarySuspectTimelinePanel - LINE_DIST_RIGHT : int = 150
- TOP_GAP : int = 30 - TOP_CIRCLE_DIAMETER : int = 15 - LINE_LENGTH : int = 840 # nam e : String # gam e : int - player : m odel.Player
+ Prim arySus pectTim elinePanel(tp:Tim ePanel) ~ incOffs et(m ins :int)
~ setSuspectDetails (player:Player,s uspectNam e:String,gam e:int,s tartTi - createTitle() :String
+ paintCom ponent(page:Graphics ) - EVENT_SPACE : int = 30 - EVENT_CIRCLE_DIAMETER : int = 8 - tp : Tim ePanel
- createIm ageIcon(path:String) :Im ageIcon - XPOS_LOCATION : int = 175 - LOCATION_TIP_WIDTH : int = 80 - XPOS_MEETING : int = 20 - events : m odel.Event[] - slots : m odel.Event[]
~ calculateSlotPos itions () + drawEvents (page:Graphics,events :Event[ ]) + getToolTip(ev:Mous eEvent) :String + 1..1
+ 1..1
+ TimelinePanel + Tim elinePanel() + JPanel
+ JDialog_1
+ TimePanel
+ paintCom ponent(page:Graphics ) + Tim ePanel(holderPanel:JPanel) + scrollUp() + scrollDown() - LEFT_MARGIN : int = 20 - TOP_LINE : int = 75 - BOTTOM_LINE : int = 45 - EVENT_SPACE : int = 30 ~ startTim e : Date ~ endTim e : Date ~ tim eInt : int - offs et : int - holderPanel : JPanel
~ getOffset() :int ~ calcYPos (tim e:Tim estam p) :int
+ setTim eDetails (s tartTim e:Date,endTim e:Date,tim eInt:int) - scrollingDown : boolean
- scrollingUp : boolean - SCROLL_SPEED : int = 50
~ calcSlot(tim e:Tim estam p) :int ~ getSlot(yPos :int) :int ~ updateTim eInterval(tim eInt:int) + setScrollDown(scrollingDown:boolean) + setScrollUp(s crollingUp:boolean)
+ [db] DBImporter
+ DBIm porter(us erNam e:String,pas s Word:String,serverNam e:String,port:int,s id:String) + doIm port(gam eId:String) :Gam e
+ calculateMeetings (m axDis tance:double,duration:Duration,player:Player,overlapTim e:long) + getGam es () :String[0..*]
+ getPlayerNam es () :String[0..*] - im portCalls (gam e:Gam e,player:Player) - im portRes ourceChecks (gam e:Gam e,player:Player) - im portCas hChecks (gam e:Gam e,player:Player) - im portMovem ents (gam e:Gam e,player:Player) - im portVanWeightChecks (gam e:Gam e,player:Player) - im portEvents (gam e:Gam e,player:Player) - im portPlayers(gam e:Gam e) - im portGam e(gam eId:String,area:Area) :Gam e - im portLocations (area:Area) ~ db : DBAccess
- MOVEMENT_TIMESTAMP : String = SENT - MOVEMENT_PLAYER : String = PLAYER - MOVEMENT_LATITUDE : String = LATITUDE - MOVEMENT_LONGITUDE : String = LONGITUDE - MOVEMENT_GAME_ID : String = GAMEID - MOVEMENT_LIVE_TABLE : String = DSCENT_LOG_MOVE_0 - MOVEMENT_TABLE : String = DSCENT_LOG_MOVE - VAN_WEIGHING_TIMESTAMP : String = TIMESTAMP - VAN_WEIGHING_PLAYER : String = PLAYER - VAN_WEIGHING_WEIGHT : String = WEIGHT - VAN_WEIGHING_GAME_ID : String = GAMEID - VAN_WEIGHING_TABLE : String = DSCENT_LOG_WEIGHING - LOG_LOCATIONS_PLAYERS_ID : String = PLAYER - LOG_LOCATIONS_NEW_LOCATION : String = NEWLOCATION - LOG_LOCATIONS_RECEIVED : String = RECEIVED - LOG_LOCATIONS_SENT : String = SENT - LOG_LOCATIONS_CONNECTION_ID : String = CONNECTIONID - LOG_LOCATIONS_GAME_ID : String = GAMEID - LOG_LOCATIONS_TABLE : String = DSCENT_LOG_LOCATIONS - LOCATIONS_DESCRIPTION : String = DESCRIPTION - LOCATIONS_TYPE : String = TYPE - LOCATIONS_NAME : String = NAME - LOCATIONS_ID : String = LOCATION - LOCATIONS_TABLE : String = DSCENT_LOCATIONS - PLAYERS_GAME_ID : String = GAMEID - PLAYERS_NAME : String = NAME - PLAYERS_ID : String = PLAYER - PLAYERS_TABLE : String = DSCENT_LOG_PLAYERS - GAME_ID : String = GAMEID
- GAME_TABLE : String = DSCENT_LOG_GAME - DATABASE_SID : String = DScent - DATABASE_PORT : int = 1521 - DATABASE_SERVER_NAME : String = 160.9.123.85 - DATABASE_PASSWORD : String = wenawing - DATABASE_USERNAME : String = ds cent
+ clos eConnection()
+ tes tConnection(us erNam e:String,pass Word:String,serverNam e:String,port:int,s id:String) + m ain(args :String [ ] )
+ 1..1 + 1..1 + 1..1
+ 1..1
+ 1..1
+ 1..1 + 1..1
+ 1..1 + 1..1
+ 1..1
+ [db]DBAccess
- DATABASE_DRIVER_CLASS_NAME : String = oracle.jdbc.driver.OracleDriver
- DATABASE_TYPE : String = jdbc:oracle:thin CONNECTION NOT AVAILABLE St i C ti t il bl
+ 1..1+ 1..1 - DScentTrail.UpButtonMouseListener
+ m ous eClicked(arg0:Mous eEvent) + m ous eEntered(arg0:Mous eEvent) + m ous eExited(arg0:Mous eEvent) + m ous ePress ed(arg0:Mous eEvent) + m ous eReleased(arg0:MouseEvent)
+ DScentTrail.DownButtonMouseListener + m ous eClicked(arg0:Mous eEvent) + m ous eEntered(arg0:Mous eEvent) + m ous eExited(arg0:Mous eEvent) + m ous ePress ed(arg0:Mous eEvent) + m ous eReleased(arg0:MouseEvent) + 1..1
+ 1..1 + 1..1
+ 1..1 MouseListener
MouseListener
6.1.2.3 GUI DScentTrail Main Window (Object Model)
GUI DScentTrail Main Window (Object Model)
frame : JFrame
: ConnMenuItemListener
menuBar : JMenuBar
fram e
m enubar contentPane : JPanel fram e
contentpane
fileMenu : JMenu
m enubar filem enu
newConMenuItem : JMenuItem
filem enu
newconm enuitem
printMenuItem : JMenuItem
filem enu
printm enuitem
exitMenuItem : JMenuItem
filem enu
exitm enuitem
newconm enuitem
: PrintMenuItemListener
printm enuitem
: ExitMenuItemListener
exitm enuitem
newSuspectMenuItem : JMenuItem
filem enu
news us pectm enuitem
: SuspectMenuItemListener
news us pectm enuitem
toolsMenu : JMenu
m enubar tools m enu
meetingsSetUpMenuItem : JMenuItem
tools m enu
m eetingss etupm enuitem
: MeetingsSetUpMenuItemListener
m eetingss etupm enuitem
sideMenuPanel : JPanel
actionsLabel : JLabel
newDbConnectionButton : JButton
newSuspectButton : JButton
printButton : JButton holderPanel : JPanel
contentpane
holderpanel
tp : TimePanel
holderpanel tim epanel
pstlp : PrimarySuspe
holderpanel
tim elinepanel contentpane
s idem enupanel
upButton : JButton downButton : JButton
tp upbutton
tp
downbutton
: UpButtonMouseListener : DownButtonMous
upbutton downbutton
timeIntMenuItem : JMenuItem
tools m enu
tim eintm enuitem
: TimeIntMenuItemListener
25
6.1.2.4 GUI Database Connection (Object Model)
GUI DB Connection Dialog (Object Model)
connectBox : DBConnectDialog
mainPanel : JPanel
selectionPanel : JPanel
dbConnectRightPanel : JPanel
dbConnectInputPanel : JPanel
dbconnectrightpanel
dbconnectinputpanel
rightMiddleSpacerPanel : JPanel
rightMiddleSpacerPanel
dbconnectinputbottom s pacerpanel
saveButton : JButton testButton : JButton connectButton : JButton dbConnectionsList : JList
s electionpanel
dbconnectionslis t
connectbox
m ainpanel
dbConnectButtonsPanel : JPanel
dbconnectbuttonspanel
s avebutton
dbconnectbuttonspanel
testbutton
dbconnectbuttonspanel
connectbutton dbconnectrightpanel
dbconnectbuttonspanel
userNameLabel : JLabel
userNameTextField : JTextField
passwordLabel : JLabel
hostNameLabel : JLabel
hostNameTextField : JTextField
sidLabel : JLabel
sidTextField : JTextField portLabel : JLabel
portTextField : JTextField
: PortListener
: SaveButtonListener
s avebutton
: TestButtonListener
testbutton
: ConnectButtonListener
cancelBut
dbconnectbuttonspanel
connectbutton
: CancelB
cancelbutton
topSpacerPanel : JPanel
m ainpanel
tops pacerpanel
leftHoldingPanel : JPanel
m ainpanel
leftholdingpanel
leftholdingpanel s electionpanel
bottomLeftSpacerPanel : JPanel
leftholdingpanel
bottom lefts pacerpanel m ainpanel
6.1.2.5 GUI New Suspect (Object Model)
GUI New Suspect Dialog (Object Model)
newSuspectBox : NewSuspectDialog
backPanel : JPanel
newSus pectBox
backPanel
mainPanel : JPanel
backpanel m ainpanel
buttonsPanel : JPanel
backpanel
buttons panel
backCCPanel : JPanel
m ainpanel
backccpanel
outerTopSpacerPanel : JPanel
m ainpanel outertopspacerpanel
outerBottomSpacerPanel : JPanel
m ainpanel outerbottom s pacerpanel
outerLeftSpacerPanel : JPanel
m ainpanel
outerleftspacerpanel
outerRightSpacerPanel : JPanel
m ainpanel
outerrights pacerpanel
okButton : JButton
buttons panel okbutton
cancelButto
buttons panel c
innerTopSpacerPanel : JPanel
backccpanel innertopspacerpanel
innerBottomSpacerPanel : JPanel
backccpanel innerbottom s pacerpanel
centreContentPanel : JPanel
backccpanel centrecontentpanel
innerLeftSpacerPanel : JPanel
backccpanel
innerleftspacerpanel
innerRightSpacerPanel : JPanel
backccpanel
innerrights pacerpanel
suspectNameComboBox : JComboBox
gameLabel : JLabel
gameComboBox : JComboBox startTimeLabel : JLabel
startTimeComboBox : JComboBox
suspectNameLabel : JLabel endTimeLabel : JLabel endTimeComboBox : JComboBox buttonsSpacerPanel : JPanel
backpanel
buttons s pacerpanel
: OkButtonListener
okbutton
27
6.1.2.6 GUI Meetings Set Up (Object Model)
GUI Meetings Set Up (Object Model)
meetingsSetUpBox : MeetingsSetUpDialog
backPanel : JPanel
m eetingss etupbox backpanel
mainPanel : JPanel
backpanel
m ainpanel
topSpacerPanel : JPanel
tops pacerpanel
comboBoxPanel : JPanel
com boboxpanel
middleSpacerPanel : JPanel
m iddles pacerpanel
checkBoxPanel : JPanel
checkboxpanel
topButtonsSpacerPanel : JPanel
topbuttons s pacerpanel
buttonsPanel : JPane
buttons panel
distanceLabel : JLabel
distanceComboBox : JComboBox
metersLabel : JLabel
timeLabel : JLabel
secondsComboBox : JComboBox
secondsLabel : JLabel
shopLabel : JLabel
h Ch kB JCh kB
checkpointLabel : JLabel
h k i tCh kB JCh kB
siteLabel : JLabel
it Ch kB JCh kB
okButton : JButton cancelButto
: OkButtonListener : CancelBu leftSpacerPanel : JPanel
backpanel
6.1.2.7 GUI Time Interval Set Up (Object Model)
GUI Time Interval Set Up Dialog (Object Model)
timeIntSetUpBox : TimeIntSetUpDialog
backPanel : JPanel
tim eints etupbox
backpanel
leftSpacerPanel : JPanel
backpanel
leftspacerpanel
mainPanel : JPanel
backpanel
m ainpanel
topSpacerPanel : JPanel comboBoxPanel : JPanel topButtonsSpacerPanel : JPanel buttonsPanel : JPanel
m ainpanel
tops pacerpanel
m ainpanel
com boboxpanel m ainpanel
topbuttons s pacerpanel m ainpanel
buttons panel
showEventsLabel : JLabel
com boboxpanel
s howeventslabel
timeIntComboBox : JComboBox
com boboxpanel
tim eintcom bobox
minutesLabel : JLabel
com boboxpanel
m inutes label
okButton : JButton cancelButton : J
buttons panel
okbutton
buttons panel
cancelb
: OkButtonListener
okbutton
: CancelButton
29
6.1.3 Screen Shots
It was never the intention to implement the entire design for DScentTrail as this would not have been achievable within the timeframe and with the allocated resources. However, all major areas were implemented, this allowed for the data to be imported from an external non-tailored database
and a dynamic intelligent class model built (see section 6.1.2.1), from this
31
6.1.3.3 Meetings Configuration
33
35
6.2 Artificial Intelligence (AI)
The intention was to build two AI modules running in parallel, both attempting to identify deceptive behaviour. The two AI techniques chosen would be completely different, both working independently, attempting to identify deceptive behaviour. The output from each technology would be compared and combined into a hybrid AI module system to strengthen the accuracy of their results, before drawing the investigators attention within the DScentTrail system to possible deception.
Unfortunately, only two games worth of data was available during the development of this phase. This resulted in the neural network not being trained or tested and the behavioural based AI module not being built. Both systems, in effect, being significantly affected by data sparseness issues: a situation analogous to expecting expert solutions from someone who has never been able to study the problem.
If a suitable amount of data had been forthcoming at an appropriately early phase of the project, this would have enabled the planned systems development, modelling and subsequent analysis to be conducted within the time-frame of the project. However, the first 2 games data only arrived at the end of the project’s second year and a following 9 games were sent to us 1 year later. None of these games included telecommunications data and due to the majority of the game data arriving two months prior to the end of the project (taking holidays into account) and therefore no useful time was available for our team to attempt the modelling and analysis required. It is submitted that our methods and concepts are robust but the course of events and available data combined to confound.
6.2.1 Neural Network
As the neural network architecture used in phase one was so successful given the amount of data, it was the intention to use the same for phase two. However, this was not possible, given the increased number of variables in
the game. A regression network architecture (Ripley 2008) was therefore
37
strengthening certainty as it is presented with more data. This process is transparent to the DScentTrail system, all the user would see would be a final output from the neural network. This neural network was integrated with the DScentTrail system, potentially deceptive scent trails were then highlighted for the investigator’s attention.
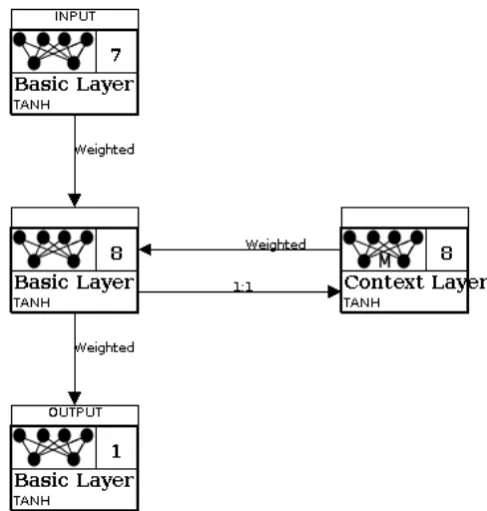
[image:38.595.109.353.259.515.2]The neural network was developed using Encog (Heaton 2010), which is a more powerful neural network and artificial intelligence application programmers interface (API) than JOONE, used for the phase 1 neural network. The neural network architecture used was an Elman Recurrent Network (Elman 1991). The Java code can be seen in Appendix H.1 and the architecture diagram can be seen in figure 6.4 below.
Figure 6.4 – Neural Network Architecture
Due to the severe lack of data available, it proved impossible to train the network. Though a regression neural network was implemented and integrated into the DScentTrail system. Future work is underway to develop a method for generating behavioural data, building on the rules of the location
based game. This will be done by combining intelligent agents24 with gene
expression programming25 and the use of an Emdros database26. The
intention is to train and fully test the neural network on the receipt of this game data.
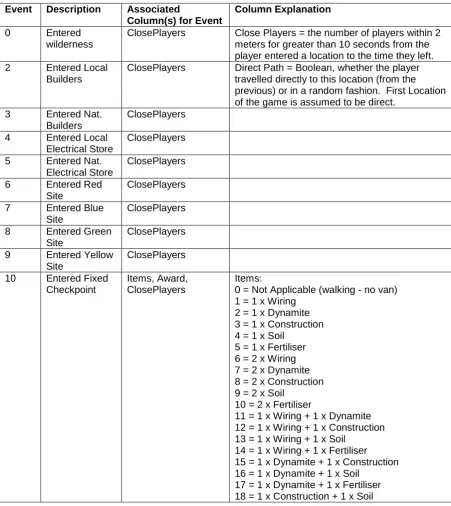
As there was so little data to train and test the neural network, the number of variable had to be reduced to a bare minimum. The resulting columns were as follows:
Event, Time, Items, Award, CallDuration, CallLocation, CallCount, ClosePlayers
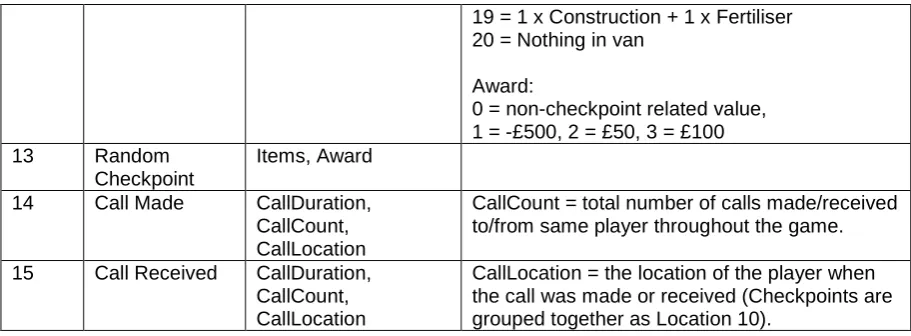
The GameId, PlayerId and Time will be present for all rows, but not shown to the neural network. A player’s worth of data for a game was shown to the network in time order. A description of the input file is shown in table 6.2 below and an example of an input file for Game 0, Player 1 can be seen in table 6.3.
Event Description Associated
Column(s) for Event
Column Explanation
0 Entered
wilderness
ClosePlayers Close Players = the number of players within 2
meters for greater than 10 seconds from the
player entered a location to the time they left.
2 Entered Local
Builders
ClosePlayers Direct Path = Boolean, whether the player
travelled directly to this location (from the previous) or in a random fashion. First Location of the game is assumed to be direct.
3 Entered Nat.
Builders
ClosePlayers
4 Entered Local
Electrical Store
ClosePlayers
5 Entered Nat.
Electrical Store
ClosePlayers
6 Entered Red
Site
ClosePlayers
7 Entered Blue
Site
ClosePlayers
8 Entered Green
Site
ClosePlayers
9 Entered Yellow
Site
ClosePlayers
10 Entered Fixed
Checkpoint
Items, Award, ClosePlayers
Items: 0 = Not Applicable (walking - no van)
1 = 1 x Wiring 2 = 1 x Dynamite 3 = 1 x Construction 4 = 1 x Soil
5 = 1 x Fertiliser 6 = 2 x Wiring 7 = 2 x Dynamite 8 = 2 x Construction 9 = 2 x Soil
10 = 2 x Fertiliser
11 = 1 x Wiring + 1 x Dynamite 12 = 1 x Wiring + 1 x Construction 13 = 1 x Wiring + 1 x Soil
14 = 1 x Wiring + 1 x Fertiliser 15 = 1 x Dynamite + 1 x Construction 16 = 1 x Dynamite + 1 x Soil
[image:39.595.85.537.260.767.2]39
19 = 1 x Construction + 1 x Fertiliser 20 = Nothing in van
Award:
0 = non-checkpoint related value, 1 = -£500, 2 = £50, 3 = £100
13 Random
Checkpoint
Items, Award
14 Call Made CallDuration,
CallCount, CallLocation
CallCount = total number of calls made/received to/from same player throughout the game.
15 Call Received CallDuration,
CallCount, CallLocation
[image:40.595.84.540.70.238.2]CallLocation = the location of the player when the call was made or received (Checkpoints are grouped together as Location 10).
Table 6.2 Neural Network Input File Column Description Table
GameId PlayerId Event Time Items Award CallDuration CallLocation CallCount ClosePlayers
0 1 7 849
0 1 15 850 19 0 4
0 1 0 858
0 1 5 906 3
0 1 15 1257 10 5 1
0 1 0 1267
0 1 10 1351 0 2
0 1 0 1375
0 1 6 1439 2
0 1 0 1514
0 1 7 1527
0 1 0 1536
0 1 10 1556 0 2
0 1 0 1587
0 1 10 1699 0 2
0 1 0 1710
0 1 9 1765
0 1 15 1777 4 9 4
0 1 0 1786
0 1 10 1809 0 2
0 1 0 1816
0 1 6 1838 1
0 1 0 2132
0 1 7 2154
0 1 0 2167
0 1 10 2220 0 2
0 1 0 2230
0 1 6 2324 3
0 1 15 2866 8 6 4
0 1 0 3094 2
0 1 8 3159 1
0 1 0 3179
0 1 6 3196
0 1 0 3231
0 1 9 3241
0 1 0 3242 2
0 1 10 3339 0 2
0 1 0 3397
0 1 10 3456 0 2
0 1 0 3482 1
0 1 5 3616
0 1 10 3712 0 2
0 1 0 3734
0 1 6 3800 1
0 1 0 3839
0 1 7 3845
0 1 0 3854
0 1 10 3870 0 2 2
0 1 0 4005
0 1 10 4156 0 2
0 1 0 4168
0 1 3 4189 1
0 1 0 4255
0 1 15 4294 8 0 4
0 1 4 4321 2
0 1 0 4528
0 1 10 4553 0 2
0 1 0 4570
Table 6.3 - Input file for Game 0, Player 1
6.2.2 Behavioural Based Artificial Intelligence
Phase two incorporated the preliminary stages of design for a symbolic AI (Haugeland 1985) system, here the decision making process behind the output was visible to the investigators; this was in direct contrast to the ‘black box’ nature of the neural network. By analysing the relationships of the variables within the game, patterns and behavioural rules could be extracted and type classifications derived. These models would then be embedded, attached with probabilistic information to identify emergent deceptive behaviour. This would become a refining, iterative process for future research and development.
6.2.2.1 Theme 5.0
Theme 5.0 software (Noldus Information Technology 2004) was used for
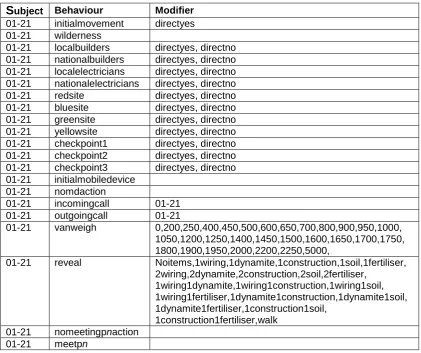
detecting and analysing hidden patterns of behaviour within the game data. Theme detects statistically significant time patterns in sequences of behaviour and provides basic analysis tools. This behavioural based AI module would contain probabilistic information and would be centred on pattern matching and relationship modelling of entities within their environment. Two files are required to analyse data using Theme software; a category table (see Appendix H) and a data file (see Appendix I). The category table contains coded metadata used to record the subject (participants); the behaviours (events) and the modifiers (variables), see table 6.4 for more details. Mutual exclusivity between the three is enforced within this file. The data file contains behavioural data, scored according to the codes defined in the category table. Separate data files were required for each participant resulting in 21 for analysis purposes.
[image:41.595.89.289.70.263.2]