THE EFFECTIVENESS OF FOREIGN AID TO POVERTY TRAP IN TERMSOF POOR COUNTRIES – CASE OF AFGHANISTAN
Jalil Ahmad Ghazizada
Institute Of Social Sciences, Istanbul Aydin University, Turkey
ABSTRACT Based on economic theories, foreign aid has a positive impact on poverty
reduction in developing countries. Some economists, however, criticize foreign assistance due to poor outcomes of these aid inflow, these critics state that foreign aidincreases corruption and bureaucracy significantly. The debate on effectiveness of foreign aid is still ongoing and outcomes of foreign assistances are under question yet. This research investigates the role of foreign aid on poverty alleviation in Afghanistan, using time series analyses covering a period of nine years (2006 to 2015). The study has mainly used secondary data. Households and NPISHs Final consumption expenditure per capita growth (annual %) has been chosen as main variable for measuring poverty.
The study has found that foreign aid has positively affected poverty reduction via increasing NPISH final consumption expenditure per capita growth in the studied period. Severe poverty still exists mainly due to increase in corruption, misallocation of the aids, donor driven and lack of ownership of the aids by Afghanistan’s government.Secondly, empirical evidence suggests that institutional quality, control of corruption and trade openness are vital for aid effectiveness. Economic growth and trade openness have been found to be necessary conditions for poverty reduction.
KEYWORDS- foreign aid, poverty reduction, country development
INTRODUCTION AND BACKGROUND
Foreign aid is a potential external capital, which plays an important role in the
economic development in developing countries. Foreign aid first started with the
marshal plan as a post-war assistance in the late 1914s. Mainly these cash inflows
donated with the aim of reconstruction in the war-torn economy of Western Europe
(Moyo, 2009). A successfully out-come of Marshall plan after the world war
second (WWII) was enough to lead the development of more optimistic ideas about
the role of foreign aid and its effects on the developing counties. Foreign assistance
became an essential prerequisite for economic advancement of the developing
countries, especially while economy is moving out of “low-level equilibrium traps”
(Hjertholmand White, 2000). According to the World Bank, these financial flows
present with two main objectives; poverty reduction and promoting long-term International Research Journal of Human Resource and Social Sciences
growth in developing countries and increasing short-term political and strategic
interest of donor‟s countries (World Bank, 1998).
Fallowing the decades of war, Afghanistan as a developing country received huge
amount of developing assistance. After 2001, the country continued to be one of
major recipients of international aid in the world (World Bank, 2010). Based on
Organization for Economic Cooperation and Development - Development
Assistance Committee (OECD-DAC) statistics, only United State donated net ODA
to Afghanistan amounted to USD 118 Billion, presenting the country as one of the
largest aid recipient among the developing countries. according to the world bank
database, net ODA as a percentage gross national income (GNI) is still significant
and high relative to many developing countries (13.43% on average from 2000
-2010 reaching a peak of 19.15 in 2003). Poverty in Afghanistan is in a severe
condition. Among the population, 35.8 percent lived under poverty line in 2011,
with 20 percent of the population just above the povertyline, where the risk of
falling under the poverty line is dominant. The data in hand belongs to the year
2011, due to lack of data in either national or international level for the recent
years. The National Risk and Vulnerability Assessment (NRVA) reported that 53.8
percent of Kuchis (Nomadic people in Afghanistan), 37.7 percent of rural
population, and 28.9 percent of people living in urban areas are living under the
poverty line.1 Poverty in Afghanistan defines to be a multi-faceted phenomenon,
involving low assets (physical, financial and human), a long period of conflict
insecurity and drought, poor infrastructure and public services.2Afghanistan is one
of the poorest countries in the world. Mostly foreign aid is considered as main
external tools to boost economic growth in different countries. It is essential to
conduct a scientific research on whether foreign a ids have been effective or not in
Afghanistan. The main objective of this study is to find the effectiveness of foreign
aid on poverty reduction in Afghanistan. What the government allocated the
massive foreign assistance, what has been the outcome of the foreign aid for
Afghanistan, what are the reasons if it is ineffective, and are that any alternative
1
Afghanistan living condition, National Risk and Vulnerability Assessment 52. Available at:
http://www.af.undp.org/content/dam/afghanistan/docs/MDGs/NRVA%20REPORT-rev-5%202013.pdf.
2
Human Development Report, United Nations Development Program 2017. Available at:
ways to make use the foreign assistance more effectively to diminish the poverty
and promote the country‟s development.
This study fills the literature gap of foreign assistance and economic development
especially for Afghanistan.This research will find out the reasons if inefficient of
foreign aid in AFG to help the country escape the poverty trap.This study will give
policy makers and donors some suggestio ns to improve the effectiveness of foreign
aid with the development goals.
LITERATURE REVIEW
The term „Aid‟ commonly refers to the nominal value of direct and indirect
financial recourses and cash flows from developed and rich countries to the poor
countries or developing countries and can be in the form of military aid, economic
aid, humanitarian aid, or emergency aid to the recipient countries. Based on the
Tripathi definition, “foreign aid is the expression which mostly used to describe,
the flow of financial and technical resources from the developed world to the under
developing world” (Tripathi, 1981).
ODA widely well knowns as Official Development Assistance in economic
literatures.This kind of aid mostly donates to reduce poverty and to promote
economic development. Official Development Assistances (ODA) named as most
common type of foreign aids, which mostly donates with the aims of boosting
country development and poverty reduction to the non-developed countries
(Williamson, 2011).
In the year 2000, international community founded the organization of millennium
development goals (MDGs).3 The MDGs created to analyze the aid allocation failure on
poverty reduction in recipient countries. Additionally, it agreed that the donors together
set up an international action plan by increasing the amount of ODA to 0,7 % of GNI in
2015, towards reducing poverty in eight non-developed areas. (Aid Watch, 2011).
Conferences on Aid Effectiveness
While the economic theories mostly consistent to the pivotal role of foreign aid in
spurring growth and development in the recipient countries (big push theory), the
outcome of foreign aid from developing countries was not desirable as it was
expected (Easterly, 2005). Therefore, international community joined at the Paris
High Level Forum regarding Aid effectiveness, hoseted by OECD.The
aforementioned declaration consisted of 56 partnership commitments. In order to
present a measurable and evidence-based method for tracking the progress of
implementation as well as development of aid-based projects, it is based on the 12
indicators. The declaration established five further mutually reinforcing principles
that closely secured the effectiveness of aid. In the following subsections, the
aforementioned principled are briefly described:
Ownership: In developing countries, taking the lead in development policies and
strategies by the governments plays a vital role for maintaining a sustainable
development. (OECD, 2008).
Alignment: The donors would allocate their assistances in congruous with the
priorities outlined in national development strategies in recipient countries.
(OECD, 2008).
Harmonization: to avoid the dublication and transaction cost in developing
countries,
It was committed that the donors would properly coordinate their development
work amongst themselves (OECD, 2008).
Mutual accountability: In Paris declaration agreed that, mutual accountability;
transparency and responsibility by both donors and recipient towards aid allocation,
implementation, outcome and the impact of aid were to be made available to the citizens
and parliament of both countries. Later, fragmentation in aid allocation negatively
affected governmental plan for strengthens the national system. Additionally, based on
the evaluations of the some NGOs, the Paris declaration on aid effectiveness was not
implemented as planned in the forum (EuroDad, 2008). Therefore, later in the year
2008, Accra meeting was held in Accra city of Ghana. This meeting was continuing to
the previous meeting regarding aid effectiveness, which held at Paris and Rome. Mainly
the aim of this meeting (HLF-3) was to accelerate the development progress towards the
millennium development goals. More than 100 senior minister from the different
countries, delegates of aids institutions such as the World Bank, European commission,
the head of United Nations, member of non-governmental foundations, was attended
Accra Agenda for Action (AAA) introduced the main areas which improvement towards
reform was not desirable, and need to be speed up for a better outcome of the aids
(Accra Agenda for Action, 2008). These areas defined as country ownership, Building
effective partnerships for development, gaining development result, country‟s ownership
over development, and building of country‟s institution.
Poverty
Poverty is a multi-definitionphenomenon. According to the World Bank, poverty word
refers to the people living without access to the basic and necessary resources for
covering their basic needs such as food, drinking water and shelter. Poverty line is the
measure of absolute poverty related to the $1.25 or $2 a day. The 1.25 poverty
headcount ratios defined “the percentage of the population living on less than $1.25 a day at 2005 international prices” (The World Bank Group, 2012). Based on poverty
definition, people at the far down under the poverty line with $1 or less a day stay more
poor with less access to basic needs of normal life, while people close to the poverty
line(but still under poverty line) with $1.5 - $2 a day satay in a better situation than the
first group however still strugling with poverty, and people above the poverty line, as far
as they stay above the poverty line, they have better access to the resources and
live‟standards. Therefore, poverty reduction can easily define as reduction in poverty
measurement such as poverty gap index or poverty headcount ratio. Referring to the
head count ratio, poverty reduction is quite easy to achieve by simply moving people
closest to the poverty line from direct below it to direct above it (OECD, 2011).
Aid-Poverty Relations
Foreign aid is a new phenomenon to the economic lessons, having been formalized in
1947 while the economists began to search and discuses about it as new indicator
effecting developing countries and its impact and the relation with the other economic
factors in 1950s. Nurske and Lewis as earlier theorists present the foreign aid as external
capital can provide efficient resources to boost developing countries into sustainable
economic growth and to achieve desirable level of economic growth (Nurske, 1953;
Lewis, 1954). While McGillivray mentioned that, there was no imperial studying which
proves the impact of foreign aid and its relation with the poverty reduction in 1947,
foreign aid, aid- poverty relation and the effectiveness of the aid to poverty reduction
and economic development.
Harrod-Domar and Gap Models
According to easterly (1997), harrod-Domer model is widely presented by development
economists and aid policy makers to calculate the amount of aid need to be allocated to
developing countries with the aims of development and increasing the economic growth
rate.
Equation [1] shows the Harrod-Domer equation and relationship to the model.
g = S V (2.1)
Where g is growth rate of income in the Economy, S as savings rate of economy
(available savings) and V is the capital output ratio?Excess in supply of the labor in
economy presented as main assumption of the model, availability and productivity of the
capital present as main factors effecting economic growth and level of savings will
determine the level on investment to the economy (McGillivray et al, 2006). However,
the creators of Harrod-Domar model was not clarifying this as main intention of the
model, while development economists to find and specify rate of economic growth was
using the Harrod-Domar relationship by estimating the saving-investment rate to the
economy. (Clunies-Ross et al, 2009).
Foreign Aid ‘Channels Effecting Poverty
Mosley discus that, here is three channels which foreign aid can effect on poverty
reduction and country development in recipient countries. Firstly, aid can be
efficient and have direct effects to the recipient countries while the aid money
directly allocate to the projects, which has been targeted before and was originally
intended. Secondly, the development outcomes can be affected indirectly by
foreign aid via impress the spending of Public-Sector in recipient government.
Therefore, Access to the aids and its availability gives the opportunity to the
recipient country to reallocate their expenditures regarding their priorities. Lastly,
“transfer of aid money raises the prices of some goods, depresses the price of some
others, and hence has side-effects on the private sector of the recipient economy
Wagner looking from different angle to the subject and described that here are
three microeconomic channels which mainly foreign aid can effect poverty through
them. These channels include the effect of foreign aid on poverty through
growthchannel, macroeconomic stabilizing effect of aid and social public
expenditures(Guillaumont and Wagner, 2014).
RESEARCH METHODOLOGY
In this research,Household and NPISH Final Consumption per Capita Growth is
selected to estimate poverty and using time series analysis by calculating the
relationship between independent and dependent variables and determining the
effect of each independent variable and its impact on the d ependent variable.
Furthermore, mathematical models were constructed to study the effect of
independent variables which are represented in Subsidies and other transfers
(current LCU), Debt forgiveness grants (current US$), Grants and other revenue (%
of revenue) , Net ODA received per capita (current US$), on the dependent
variable which is represented in Households and NPISHs Final consumption
expenditure per capita growth over a period of time (2006-2015). The model
function and study model are formulated as follows:
Yt = α0+α1 X1t + α2X2t +α3𝑋3t + 𝛼4𝑋4t + et
Dependent variable:
(Y): Households and NPISHs Final consumption expenditure per capita growth
(annual %)
Independent variables:
(𝑋1): Subsidies and other transfers (current LCU)
(𝑋2): Debt forgiveness grants (current US$)
(𝑋3): Grants and other revenue (% of revenue)
(𝑋4): Net ODA received per capita (current US$)
(e): Error Termt: time
Study uses quantitative data to describe the independent variable and the dependent
research has 40 observations of the raw data regarding dependent variable and four
independent variables and as motioned above. The data were obtained from the
official sources represented by the Afghan national Statistical Center, Organization
for Economic Co-operation and Development (OCED) and the World Bank.
Study Model
The present study used the Ordinary Least Square (OLS) to estimate the model.
The characteristic of this method is that the total number of squares deviations
from the observed values of the dependent variable is low (Attya, 2005). Ordinary
Least Square has main assumptions that should be existed in any estimated
regression model in order to depend on the results of the estimation and reliability.
These assumptionsdefine as random errors (residuals) follow the normal
distribution, the mean of the model equals to zero, the error limits are
homogeneous, meaning that the error variation is constant, and the error limits are
independent of each other meaning that there is no self-correlation within the error
limits (Gujarati, 2004). This method used during the estimation of model
parameters.
Furthermore, in economics, the dependence of the dependent variable on
independent variable values is not always instantaneous. It usually involves a time
difference which is called a lag variable. The regression model or lag variables are
necessary to deal with time series data. The general formula of the lagged
regression model that contains more than one independent variable is written as
follow:
𝑌𝑡 = 𝛼 + 𝛽1𝑗𝑋1𝑡−𝑗 𝑘
𝑗 =0
+ 𝛽2𝑗𝑋2𝑡−𝑗 𝑘
𝑗 =0
+ 𝛽3𝑗𝑋3𝑡−𝑗 𝑘
𝑗 =0
+ 𝛾𝑖𝑌𝑡−𝑖 𝑚
𝑖=1
+ 𝜀𝑡
ANALYSIS
Descriptive Analyses of the Variables
The researcher used a set of statistical descriptive methods to describe the variables
of the study. This was done by using some dispersion measures and measures of
As well as the lowest value and the largest value for each variable. Table below
shows the most important statistical measures of the variables of the model.
Table4.1:The most important descriptive statistical measures of the study variables
Maximum Minimum STD.D Mean N Currency type Variables 553.82 438.39 32.77 507.03 40 USD dollar Y 21.49 3.00 5.92 12.52 40 Local currency (billion) 𝑥1 115.43 16.01- 32.60 18.06 40 USD dollar(million) 𝑥2 93.68 74.13 4.51 86.94 40 USD dollar(thousand) 𝑥3 232.21 102.20 41.54 181.82 40 USD dollar(thousand) 𝑥4
Time Series Statistic Test
The following table 4.2 shows the results of the static tests using Augmented
Dickey-Fuller (ADF) and (Phillips Perron -PP) to test the stability of the time
series based on the level and on the first difference and the second difference. The
study variables were static at significance level of 5% after taking the second
differences according to the ADF test. According to the PP test, all the study
variables are static at 5% of significance level after taking the first differences. We
conclude from this that the time series are still static in the first class (CI ~ (1)
Table 04.2: Unit Root Test results of the study variables
PP ADF
Variables
2ed df 1st df
Level 2ed df
1st df Level --- -3.91* -1.88 -4.97* -0.73 -2.92 Y --- -3.42* -1.56 -6.22* -1.40 -1.16 X1 --- -3.96* -2.49 -4.25* -2.10 -1.60 X2 --- --- -2.98* --- -3.73* 0.99 X3 --- -3.41* -1.67 -9.83 -1.70 -2.13 X4
Significant at 5%, according to the table values of Mackinnon (1996).
Co-integration Test of Study Variables
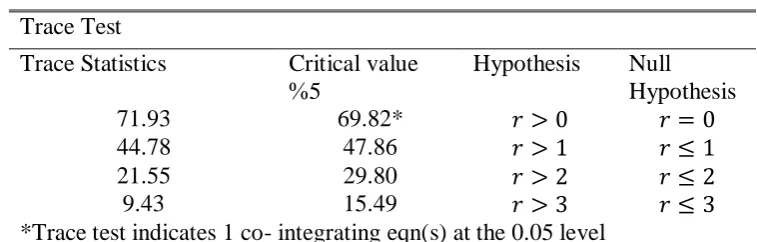
Table 4.3 shows the results of the Johansson tests for the co -integration represented
in Trace. The result of the Trace test was that the number of vectors of integration
(r = 0) and significant at 5% and thus we reject the null hypothesis and we noticed
the presence of more 0 (R> 0) tend to be integrated, while the result of the null
hypothesis test, which assumes that there is a single integration vector at most (r ≤
1), is not significant. Thus, this hypothesis is accepted and we noticed the existence
of a single integration vector (r≤ 1). Therefore, we ensure that there is at least one
[image:10.595.96.534.65.260.2]co-integration vector between the model variables.
Table 4.3: Results of the co Integration Test according to Johansson method
The Result of the Study Model
The research shows a detailed presentation of the results of the statistical
estimation of the study model, which examines the relationship and effect of Trace Test Null Hypothesis Hypothesis Critical value Trace Statistics 5 %
𝑟 = 0 𝑟 > 0
69.82* 71.93
𝑟 ≤ 1 𝑟 > 1
47.86 44.78
𝑟 ≤ 2 𝑟 > 2
29.80 21.55
𝑟 ≤ 3 𝑟 > 3
15.49 9.43
[image:10.595.124.503.527.648.2]independent variables such as Subsidies and other transfers (current LCU), Debt
forgiveness grants (current US$), Grants and other revenue (% of revenue), Net
ODA received per capita (current US$), on the dependent variable which is
represented in Households and NPISHs Final consumption expenditure per capita
growth. Whereas the largest variable were used to estimates the effect of
independent variables in the previous years on the dependent variable in
subsequent years. The length of the lag periods was determined by one time
backward using the Akaike info criterion (AIC). According to that, the model was
estimated by one lag period for the independent variables and the dependent
variable, and then the insignificant limits were deleted and the model retained in its
best form. Table 4.4 below shows the results of the estimation. The table includes
the regression coefficients of the variables included in the model in their raw form
and due to the difficulty of being interpreted. The economic elasticity of all the
[image:11.595.95.536.376.535.2]variables was calculated and included in the table below.
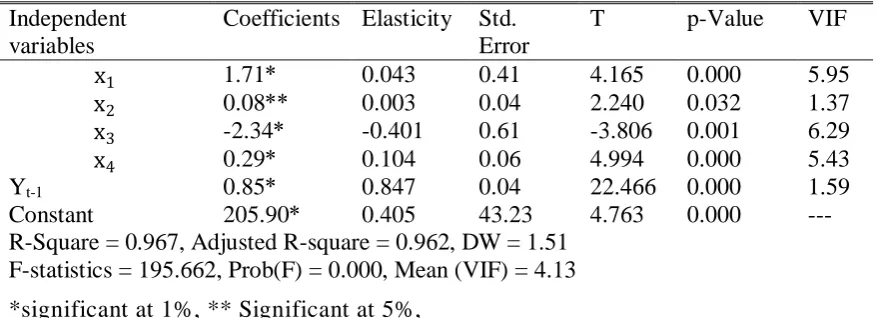
Table 04.4: Estimation of the regression model by the inclusion of lagged
variables (one lag period)
VIF p-Value T Std. Error Elasticity Coefficients Independent variables 5.95 0.000 4.165 0.41 0.043 1.71* x1 1.37 0.032 2.240 0.04 0.003 0.08** x2 6.29 0.001 -3.806 0.61 -0.401 -2.34* x3 5.43 0.000 4.994 0.06 0.104 0.29* x4 1.59 0.000 22.466 0.04 0.847 0.85* Yt-1 --- 0.000 4.763 43.23 0.405 205.90* Constant
R-Square = 0.967, Adjusted R-square = 0.962, DW = 1.51 F-statistics = 195.662, Prob(F) = 0.000, Mean (VIF) = 4.13
*significant at 1%, ** Significant at 5%,
It is clear from the results of the previous table that the value of the modified
limiting factor of the model was (0.962). This value means that the independent
variables included in the model accounted for 96.2% of the change in the
dependent variable (Households and NPISHs Final consumption expenditure per
capita growth) Or 96.2% of the changes in the dependent variable are due to the
independent variables included in the model in the table above. Concerning the
effect of subsidies and transfers, the results show a positive and statistically
economic elasticity (0.043), which means that the per capita response to the final
expenditure of household consumption for subsidies and transfers is positive So if
a 100% increase in the size of subsidies and transfers, this will result in a change
in the per capita per capita final expenditure of household consumption by 4.3%.
Concerning the effect of the debt forgiveness grant, the results indicate a positive
and statistically significant at 5% where the regression coefficient is 0.08 with a
positive economic elasticity of 0.003. This means that the final per capita
expenditure of household consumption to grant debt forgiveness is a positive
response, so if the value of granting debt forgiveness changed by increasing 100%,
the size of per capita final expenditure of household consumption would change by
this increasing by 0.3%.
Concerning the effect of grants and revenues, the results indicate a negative and
statistically significant at 1% where the regression coefficient is ( -2.34) with a
negative economic elasticity of (-0.401), which means that the per capita response
of the final expenditure of household consumption to grants and revenues is an
adverse response , So if the value of grants and revenues increased by 100%, this
would lead to a change in the size of per capita final expenditure of household
consumption decreased by 40.1%.
Regarding the Net ODA received per capita, the results show a positive and
statistically significant at 1% where the regression coefficient is 0.29 with a
positive economic elasticity of 0.104, which means that Net ODA received per
capita has a positive response, so if Net ODA received per capita increased by
100%, this would result in a 10.4% change in per capita final household
consumption expenditure
Finally, regarding the effect of per capita final expenditure of household
consumption, which is lagged for one period of time (three months), the results
showed a positive and statistically significant at 1%.whereas the regression
coefficient is 0.85 with positive economic elasticity 0.847 This means that the final
per capita expenditure of households' self-consumption after three months is a
positive response, so if the per capita value of the final expenditure of household
consumption changed by 100%, this would be increased by 10.4% after three
The Coefficient of Determination and the Significance of the Model
The Independence of error limits (residuals)
According to the Drabbon Watson test (DW), the test range is between 0 and 4, and
the closer it gets to zero there is a positive self-correlation, whereas if it gets closer
to 4 there is a negative correlation. When it gets closer to 2, there is no a
self-correlation (Diebold, 2018). In this model, the value of the measured test (1.51)
which is a close value to 2, which supports the acceptance of the research
hypothesis that there is no problem of self-correlation in the model residuals (see
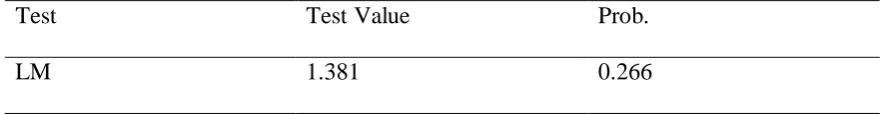
the results of the model estimate, Table 4.5). This confirms that the result of the
(LM) test that reached (1.381) with a probability of (0.266=P-value) and greater
than the level of 0.05 and it may confirm that there is no problem of
selfcorrelation in the model residuals. Table 5 shows the results of the LM test of self
[image:13.595.97.541.415.472.2]-correlation.
Table 04.5: LM test results of self-correlation
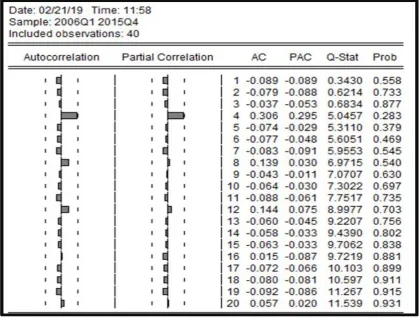
Autocorrelation test
As one of the main assumption of the OLS model, we need to check the errors and
find if the errors are independent to support our model and get sure about the
model, which has been selected for the research. The following Figure 4.6 shows
Test (Correlogram) for Residual, by drawing up the two attributes
(Autocorrelation) & (Partial Autocorrelation), All test coefficients were not
significant at level 0.05, This means that there is no Autocorrelation in model‟s
Residual.
Prob. Test Value
Test
0.266 1.381
Figure 4.6: Autocorrelation and Partial Autocorrelation result.
Results of the other Test for the StudyModel
Equal average error limits of zero
The mean of the error limits for zero was tested using the One Sample T -test. The
results indicated that the test value is equal to (T = 0.000) with a probability of
P-value = 1.000 which is greater than 0.05, which supports the acceptance of the null
hypothesis that states that the average of the error limits is zero. Table 4.7 shows
the test results.
Table 04.6: T-test results of the mean of the error limits of zero
Prob. Test Value
Test
1.000 0.000
[image:14.595.98.537.635.692.2]Normal distribution of the error:
By using the Jarque-Bera test, the results indicated that the test value was 3.993
with P-value = 0.136, which is greater than 0.05 indicating acceptance of the null
hypothesis which states that the random error limits are distributed naturally.
Homogeneity of error limits
The requirement of homogeneity of the error limits is intended to determine the
variability of the error limits. This was verified by using the white test. The results
indicated that the test value is equal to F = 0.871 with a probability of P-value =
0.619, which is greater than 0.05 indicating acceptance of the null hypothesis
which states that the error limits are homogeneous. Table (4.9) Shows the results of
[image:15.595.97.523.520.550.2]the Homogeneity of Error Limits test.
Table 4.7: White test results of the homogeneity of error limits.
Prob. Test Value
Test
0.619 0.871
CONCLUSION AND RECOMMENDATIONS
According to the findings of the research, the relationship between variables has been
approved as following:
The impact of Subsidies and other transfers on Households and NPISHs Final consumption
expenditure per capita growth is (1.71).
The impact of Debt forgiveness grants on Households and NPISHs Final consumption
expenditure per capita growth is (0.08).
The impact of Grants and other revenue on Households and NPISHs Final consumption
expenditure per capita growth is (-2.34).
The impact of Net ODA received per capita on Households and NPISHs Final consumption
expenditure per capita growth is (0.29).
Research finding shows that subsides and the other transfer, debt forgiveness grants,
grants and other revenue and Net ODA received per capita growth have positively
impacted Households and NPISHs Final consumption expend iture per capita growth.
The findings state that an increase in the size of aids will cause an increase in amount
of consumption in a society, while decrement in the size of aids have negative impact
on final consumption per capita in a society. Based on t he main finding of study, the
hypothesis H1, which shows a relationship between foreign aid and poverty reduction,
have been accepted, via positive impact of foreign aid on household final consumption
per capita growth.
United stated, the primary donor to Afghanistan, has donated $122 billion since 2001.4
However, the GDP growth rate was 2.5 percent in 2017 and slightly higher than 2.2
percent in 2016, while unemployment and poverty rate have increased and corruption
has risen.5 A survey done by (CS0.gov.af, 2016-2017) stated that poverty rates have
increased from 36 percent in 2012 to 39 percent in 2014. This means that around 1.3
million fell under the poverty line. Furthermore, the survey shows 1 percent increment
in unemployment rate over the last two years, which means the unemployment severe
4 Special Inspector General to Afghanistan Reconstruction, Private Sector Development and Economic Growth,
April 2018, p. 13, (Accessed) https://www.sigar.mil/pdf/lessonslearned/SIGAR-18-38-LL.pdf , 5 July 2018.
5
amongst illiterate and low-skilled workers have the greatest risk to be fell under the
poverty line as well. The problems have emerged from careless spending of aids, lack
of ownership by Afghanistan‟s government, fragmentations in donor programs and poor donor‟s adjustment to the country. The provided development assistances through
off-budget channels were more fragmented. To avoid these problems, firstly, the donors
should focus on development aid through on-budget channelsand let the government to
prioritize its own needs for sustainable development. Secondly, Afghanistan‟s
government should take a firm stance toward ownership of foreign aids to increase aids
effectiveness. As mentioned in previous chapter, the urban areas of Afghanistan are
struggling more with poverty. Therefore, a long-term efficient national development
strategy should be made by Afghanistan‟s government to lead both provinces and urban
arias for symmetric development. Additionally, Afghanist an must promote
anticorruptionpolicies as a key factor to aid‟s effectiveness, and national development
strategy should be thouroughly based on a mechanism where greater engagements of
ordinary citizens is encouraged. Finally, this research suggests for Future studies to
choose other indicators of poverty rather than consumption that may find out a better
aid-poverty relation. Furthermore, future studies should more focus on aid -corruption
relation to find out solution for decreasing corruption in Afghanistan.
REFERENCES
Alesina, A., & Weder, B. (1999). Do corrupt governments receive less foreign aid?. No. w7108: National bureau of economic research.
Easterly, W. (2005). Can foreign aid save Africa?
Easterly, W., & Levine, R. (1997). Africa's growth tragedy: policies and ethnic divisions. The quarterly journal of economics, 112(4), 1203-1250.
Guillaumont, P., & Wagner, L. (2014). Aid Effectiveness for Poverty Reduction: Lessons from Cross‑country Analyses, with a Special Focus on Vulnerable Countries. Revue d'économie du développement, 22(HS01), 217-261.
Gujarati, D. N., & Porter, D. C. (2004). Basic econometrics (ed.) McGraw-Hill. Irwin, a business.
Hjertholm, P., & White, H. (2000). Foreign aid in historical perspective.
Hoelscher, K. (2009). [Dead Aid: Why Aid Is Not Working and How There Is a Better Way
for Africa, Dambisa Moyo]. Journal of Peace Research, 46(5), 724-725.
Huq, M., Clunies-Ross, A., & Forsyth, D. (2009). Development economics: McGraw Hill.
Hurley, G. (2008). Eurodad charter on responsible financing: European Network on Debt and Development.
McGillivray, M., Feeny, S., Hermes, N., & Lensink, R. (2006). Controversies over the impact of development aid: it works; it doesn't; it can, but that depends…. Journal of International Development: The Journal of the Development Studies Association, 18(7), 1031-1050.
Mosley, P., Hudson, J., & Horrell, S. (1987). Aid, the public sector and the market in less developed countries. The Economic Journal, 97(387), 616-641.
Nurkse, R. (1953). Problems of capital formation in underveloped countries: Oxford University Press.
Tripathi, L. (1981). Soviet Aid and India's Economic Development: Aligarh: Manjushri Publications.