Changes in Spinal Canal Diameter and
Vertebral Body Height with Age
Kyung Hyun Kim, Jeong Yoon Park, Sung Uk Kuh, Dong Kyu Chin, Keun Su Kim, and Yong Eun Cho
Department of Neurosurgery, Gangnam Severance Hospital, Spine and Spinal Cord Institute, Yonsei University College of Medicine, Seoul, Korea.Received: March 13, 2013 Revised: May 10, 2013 Accepted: May 10, 2013
Corresponding author: Dr. Jeong Yoon Park, Department of Neurosurgery,
Gangnam Severance Hospital, Spine and Spinal Cord Institute, Yonsei University College of Medicine, 211 Eonju-ro, Gangnam-gu, Seoul 135-720, Korea.
Tel: 82-2-2019-3404, Fax: 82-2-3461-9229 E-mail: [email protected]
∙ The authors have no financial conflicts of interest.
© Copyright:
Yonsei University College of Medicine 2013
This is an Open Access article distributed under the terms of the Creative Commons Attribution Non-Commercial License (http://creativecommons.org/ licenses/by-nc/3.0) which permits unrestricted non-commercial use, distribution, and reproduction in any medium, provided the original work is properly cited.
Purpose: All structures of the spine, including the spinal canal, change continu-ously with age. The purpose of this study was to determine how the spinal canal of the lumbar spine changes with age. The L4/5 is the most common site of spinal stenosis and has the largest flexion-extension motion, whereas the T5/6 has the least motion. Therefore, we measured the spinal canal diameter and vertebral body height at T5, T6, L4, and L5 with age. Materials and Methods: This was a retro-spective study of aged 40 to 77 years. We reviewed whole spine sagittal MRIs of 370 patients with lumbar spinal stenosis (LSS) (Group 2) and 166 herniated cervi-cal disc (HCD) (Group 1). Each group was divided into four age groups, and de-mographic parameters (age, gender, height, weight, BMI), the mid-spinal canal di-ameter, and mid-vertebrae height at T5, T6, L4, L5 were compared. Within- and between-group comparisons were made to evaluate changes by age and correla-tions were carried out to evaluate the relacorrela-tionships between all parameters. Re-sults: Height, weight, and all radiologic parameters were significantly lower in Group 2 than Group 1. Group 1 did not show any differences, when based on age, but in Group 2, height, weight, and T6, L4, and L5 height were significantly de-creased in patients in their 70’s than patients in their 40’s, except for spinal canal diameter. Age was associated with all parameters except spinal canal diameter.
Conclusion: Vertebral height decreased with age, but spinal canal diameter did not change in patients with either LSS or HCD. Mid-spinal canal diameter was not affected by aging.
Key Words:Lumbar spinal stenosis, herniated cervical disc, spinal canal diameter
INTRODUCTION
The spine is a flexible, multisegmented column that maintains stability and an up-right position while providing mobility throughout life. The spine comprises static vertebral bodies and elastic joint complexes: the intervertebral disc and two poste-rior facet joints. Changes in the aging spine usually occur at movable interverte-bral discs, facet joints, ligamentum flavum, and verteinterverte-bral endplates which are adja-cent to the intervertebral disc.1-4
generative spinal stenosis.14-17 Based on their movement, T5
and T6 are expected to show the smallest changes, and L4 and L5 to show the largest changes with age and degenera-tion, compared to the rest of the spine. Thus, to determine the changes in the spinal canal associated with age, we mea-sured the diameter of the mid-spinal canal at T5, T6, L4, and L5. To clearly observe the change in the spinal canal diameter, we measured the bony mid-spinal canal diameter only, because the spinal canal at the disc space is influenced by changes in the intervertebral disc, facet joint, and verte-bral endplate with age. In addition, patients with LSS expe-rience strong degenerative changes with age, therefore, we included LSS in this study to observe a large variation. We compared LSS with herniated cervical disc (HCD) without thoracic and lumbar lesions as a control group.
MATERIALS AND METHODS
This was a retrospective study of patients aged 40 to 77 years. The LSS group (n=370) included patients who un-derwent surgical treatment for L4-5 spinal stenosis between 2007 and 2011 (Group 2). All individuals in this group had intermittent claudication, often accompanied by other symp-toms, such as radiculopathy, low back pain, or both. Before surgery, all patients underwent whole spine sagittal T2-weighted MRI with 1-mm cutting. We also included 166 patients who underwent surgical treatment for 1 segment HCD during same period as the controls (Group1). We ex-cluded from this study any patients with multi-segment ste-nosis, disease at a vertebra other than L4 or L5, fractures, tumors, or patients who had a previous operation at any spi-nal segment. Any patients with abnormal findings of the thoracic or lumbar spine, except HCD, on a whole spine sagittal T2-weighted MRI were also excluded.
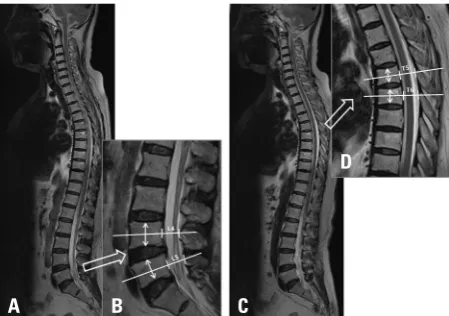
We compared demographic parameters (age, gender, height, weight, and BMI), and used PACS software and a PACS workstation (Centricity 2.0, GE Medical Systems, Milwaukee, WI, USA) to measure the anterior-posterior (AP) mid-spinal canal diameter and mid-vertebral body height. Using whole spine sagittal MRI, we selected the largest spinal canal image at the thoracic and lumbar spine. An independent neuroradiologist measured the anteroposte-rior diameter of the bony spinal canal on the mid-portion of the vertebral body, and mid-vertebral body height at T5, T6, L4, and L5 (Fig. 1). The patients were divided into four age groups: 40-49, 50-59, 60-69, and over 70.
the most frequent indication for spinal surgery in people over 60 years old.5 LSS refers to narrowing of the spinal
ca-nal, nerve root canals, or intervertebral foramina of the lum-bar spine.6 Lumbar spinal stenosis can be congenital,
de-generative, or both.5-9 Congenital stenosis is rare, while
degenerative stenosis is more common, generally arises af-ter the sixth decade of life, and is associated with age.5,6,10
Degenerative LSS is associated with degenerative changes of the elastic and moveable complex like intervertebral disc, zygapohyseal joints, and ligamentum flavum as domi-nant contributors.11-13 Recently, Abbas, et al.5 reported that
the vertebral bodies and canals are significantly smaller in patients with degenerative LSS than in normal controls, and that both genetic factors (narrow spinal canal) and degener-ative changes are associated with the pathogenesis of de-generative LSS. However, it is impossible to determine if the narrow spinal canal in degenerative LSS is degenerative change due to age or genetics. If the narrow spinal canal in degenerative LSS is associated with aging, degenerative LSS is degenerative disease. However, if the narrow spinal canal in degenerative LSS is not associated with aging, it appears to be logical to change the definition of degenerative LSS which reflects the genetic cause.
The purpose of this study was to determine how the mid-spinal canal diameter at L4 and L5 changes with age by us-ing whole spine sagittal MRI. T5 and T6 have the least flex-ion-extension movement, while L4 and L5 have the largest flexion-extension movement, therefore, L4 and L5 are the most common sites for degenerative spine disease and
de-Fig. 1. Radiologic parameters of whole spine sagittal MRI. From the whole spine sagittal MRI, we selected the largest spinal canal image at the lum-bar spine (A). The anteroposterior diameter of the spinal canal at the mid-portion of the vertebral body (white line) and mid-vertebra body height (white arrow) at L4 and L5 was measured (B). From the whole spine sagittal MRI, we selected the largest spinal canal image at the thoracic spine (C). The anteroposterior diameter of the spinal canal at the mid-portion of the vertebral body (white line) and mid-vertebra body height (white arrow) at T5 and T6 was measured (D).
A B C
[image:2.595.71.296.484.642.2]year olds and over 70 year olds. Pearson’s correlation was used to determine correlations with age. p-values <0.05 were considered statistically significant. No external funding were used for this study, and all procedures were approved by the Institutional Review Board of Gangnam Severance Hospital, Yonsei University College of Medicine (No 3-2012-0145).
RESULTS
Demographic characteristics
The demographic characteristics of the two groups are sum-marized in Table 1. The 166 patients (110 males, 56 females) in Group 1 had mean age of 58.9±8.7 years, and the 370 patients (137 males, 233 females) in Group 2 had mean age of 62.2±9.0 years. Group 2 was shorter (165.4 vs. 160.4 cm, p=0.000) and weighed less (65.8 vs. 63.4 kg, p=0.008) than Group 1 (Table 1). When stratified by gender, there was no difference in height (male; 169.7 vs. 168.7, female; 156.9 vs. 155.5 cm) or weight (male; 70.1 vs. 70.8, female; 57.3 vs. 59.1 kg) between Groups 1 and 2.
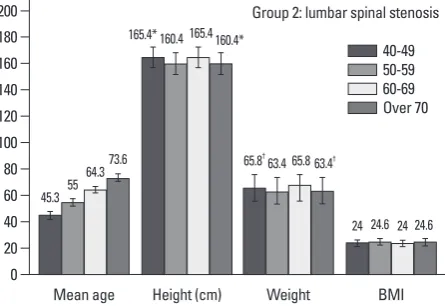
In Group 1, there were no differences in height or weight based on age (Fig. 2, Table 1). In Group 2, over 70 year olds were shorter (165.4 vs. 160.4 cm, p=0.001) and weighed less (65.8 vs. 63.4 kg, p=0.035) than 40-49 year olds (Fig. 3, Ta-ble 1). When stratified by gender, there were no differences in Group 1. In Group 2, over 70 years old females were short-er than 40-49 years old (158.7 vs. 153.0 cm, p=0.001).
Spinal canal diameter and vertebral body height Table 2 summarizes the anterior-posterior (AP) spinal canal diameters and vertebral body heights for each group. All spinal canal diameters and vertebral body heights were sig-Within- and between-group comparisons were made
[image:3.595.56.533.81.228.2]to-evaluate changes by age and correlations were carried out to evaluate the relationships between all parameters in all groups. SPSS for Windows version 15.0 (SPSS Inc., Chica-go, IL, USA) was used for all analyses. Student t-tests were used to compare data between groups and between 40-49 Table 1. Demorgraphic Data According to Age
Total (536) Age (yrs) No. of cases Mean age (yrs) Height (cm) Weight (kg) BMI
Group 1: herniated cervical disc
Total 166 58.9±8.7 165.4±7.6* 65.8±10.1* 24.0±2.6
40-49 39 45.4±2.6 165.0±7.5 64.3±10.4 23.5±2.6
50-59 54 54.3±2.7 166.4±7.6 66.6±9.2 24.0±2.4
60-69 59 63.1±2.8 165.5±7.4 66.8±10.9 24.3±2.8
Over 70 14 72.5±2.1 162.3±8.5 62.5±8.5 23.7±2.4
Group 2: lumbar spinal stenosis
Total 370 62.2±9.0 160.4±8.5* 63.4±10.1* 24.6±2.8
40-49 37 45.3±2.8 165.4±7.6† 65.8±10.1‡ 24.0±2.6
50-59 92 55.0±2.7 160.4±8.5 63.4±10.1 24.6±2.8
60-69 156 64.3±2.6 165.4±7.6 65.8±10.1 24.0±2.6
Over 70 85 73.6±3.0 160.4±8.5† 63.4±10.1‡ 24.6±2.8
Between total group 1 and group 2 comparisons by *Student’s t-test and p<0.01, intergroup comparisons between “40-49” with “over 70” by †Student’s
[image:3.595.58.287.268.420.2]t-test and p<0.01, ‡p<0.05.
Fig. 2. Demographic characteristics in Group 1 (herniated cervical disc).
Fig. 3. Demographic characteristics in Group 2 (lumbar spinal stenosis). Comparisons between 40-49 year olds and over 70 year olds by Student’s t-test, *p<0.01 and †p<0.05.
0
0 20
20 40
40 60
60 80
80 100
100 120
120 140
140 160
160 180
180 200
200
Mean age
Mean age
Height (cm)
Height (cm)
Weight
Weight
BMI
BMI 40-49 50-59 60-69 Over 70
40-49 50-59 60-69 Over 70
45.4
45.3 54.3
55 63.1
64.3 72.5
73.6 165
165.4* 166.4
160.4 165.5
165.4 162.3
160.4* 64.3
65.8†
66.6
63.4 66.8
65.8 62.5
63.4†
23.5
24 24
24.6 24.3
24 23.7
24.6
Group 1: herniated cervical disc
[image:3.595.60.283.450.603.2]p=0.000, L5; 17.4 vs. 15.3 mm, p=0.000) and vertebral body heights at T5 (14.9 vs. 14.1 mm, p=0.000) and T6 (15.3 vs. 14.5 mm, p=0.000) were smaller in Group 2.
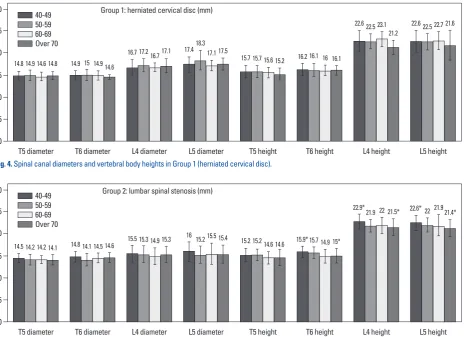
Within Group 1, there were no differences, when based on age (Fig. 4). In Group 2, the vertebral body height at T6 (15.9 vs. 15.0 mm, p=0.01), L4 (22.9 vs. 21.5 mm, p= nificantly lower in Group 2 than Group 1 (Table 2). Among
[image:4.595.71.545.81.243.2]men, all spine canal diameters (T5; 14.8 vs. 14.3, p=0.001, T6; 15.0 vs. 14.6, p=0.017, L4; 16.9 vs. 15.2, p=0.000, L5; 17.7 vs. 15.7 mm, p=0.000) were smaller in Group 2. Among females, all spinal canal diameter (T5; 14.9 vs. 14.1, p=0.000, T6; 14.8 vs. 14.3, p=0.011, L4; 17.0 vs. 15.3,
Table 2. Spinal Canal Diameter and Vertebral Body Height Changes According to Age (mm)
Total (536) Age No. of cases diameterT5 heightT5 diameterT6 heightT6 diameterL4 heightL4 diameterL5 heightL5
Group 1: herniated cervical disc
Total 166 14.8±1.1* 15.6±1.4* 14.9±1.1* 16.1±1.4* 16.9±1.4* 22.6±2.0* 17.6±1.9* 22.6±2.2*
40-49 39 14.8±1.0 15.7±1.5 14.9±1.1 16.2±1.4 16.7±1.8 22.6±2.4 17.4±1.9 22.6±2.5
50-59 54 14.9±1.3 15.7±1.3 15.0±1.3 16.1±1.5 17.2±1.5 22.5±1.7 18.3±2.2 22.5±1.9
60-69 59 14.6±0.9 15.6±1.3 14.9±1.0 16.0±1.3 16.7±1.0 23.1±1.7 17.1±1.3 22.7±2.1
Over 70 14 14.8±0.9 15.2±1.4 14.6±0.6 16.1±1.0 17.1±1.7 21.2±1.7 17.5±1.4 21.6±3.4
Group 2: lumbar spinal stenosis
Total 370 14.2±1.1* 14.8±1.5* 14.4±1.2* 15.2±1.6* 15.2±1.9* 21.9±1.8* 15.4±2.2* 21.9±2.2*
40-49 37 14.5±1.1 15.2±1.5 14.8±1.3 15.9±1.4† 15.5±1.9 22.9±1.7† 16.0±2.3 22.6±1.7†
50-59 92 14.2±1.2 15.2±1.3 14.1±1.4 15.7±1.4 15.3±1.9 21.9±1.4 15.2±2.0 22.0±1.7
60-69 156 14.2±0.9 14.6±1.4 14.5±1.1 14.9±1.6 14.9±2.0 22.0±1.9 15.5±2.5 21.9±2.6
Over 70 85 14.1±1.2 14.6±1.8 14.6±1.2 15.0±1.7† 15.3±1.8 21.5±1.9† 15.4±2.1 21.4±2.0†
Between group 1 and group 2 comparisons by *Student’s t-test and p<0.01, intergroup comparisons between “40-49” with “over 70” by †Student
’s t-test and p<0.01.
Fig. 4. Spinal canal diameters and vertebral body heights in Group 1 (herniated cervical disc).
Fig. 5. Spinal canal diameters and vertebral body heights in Group 2 (lumbar spinal stenosis). Comparisons between 40-49 year olds and over 70 year olds by Student’s t-test, *p<0.01.
0 0 30 30 25 25 20 20 15 15 10 10 5 5 T5 diameter T5 diameter T6 diameter T6 diameter L4 diameter L4 diameter L5 diameter L5 diameter T5 height T5 height T6 height T6 height L4 height L4 height L5 height L5 height 40-49 50-59 60-69 Over 70 40-49 50-59 60-69 Over 70 14.8 14.5 14.9 14.2 14.6 14.2 14.8 14.1 14.9 14.8 15 14.1 14.9 14.5 14.6 14.6 16.7 15.5 17.2 15.3 16.7 14.9 17.1 15.3 17.4 16 18.3 15.2 17.1 15.5 17.5 15.4 15.7 15.2 15.7 15.2 15.6 14.6 15.2 14.6 16.2 15.9* 16.1 15.7 16 14.9 16.1 15* 22.6 22.9* 22.5 21.9 23.1 22 21.2 21.5* 22.6 22.6* 22.5 22 22.7 21.9 21.6 21.4*
Group 1: herniated cervical disc (mm)
[image:4.595.76.541.278.615.2]L4 was shorter (23.7 mm vs. 22.6 mm, p=0.043) in over 70 years old than 40-49 years old in Group 2. Females in both groups differed with age. Spinal canal diameter did not dif-fer with age for all patients or when stratified by gender (Figs. 4 and 5, Table 2). Age was significantly correlated with all demographic characteristics and vertebral body heights, but did not correlate with spinal canal diameter (Fig. 6, Table 3).
DISCUSSION
Anatomically, LSS is caused by reduced space available for neural elements as a result of changes in the osseous and soft tissue elements surrounding the spinal column.5,11-13 Many
previous studies have suggested that degenerative LSS be-gins with the loss of disc height resulting in annulus fibrosis and foraminal stenosis, and these changes alter the loading of the facet joints, leading to facet arthrosis, ligamentum flavum thickening, and osteophyte formation at the end-0.000) and L5 (22.6 vs. 21.4 mm, p=0.002) was smaller in
[image:5.595.57.281.140.312.2]over 70 years old than 40-49 years old (Fig. 5, Table 2). Among males, T5 (16.2 vs. 15.2 mm, p=0.005) and L4 (23.4 vs. 21.1 mm, p=0.003) in Group 1 were shorter, and
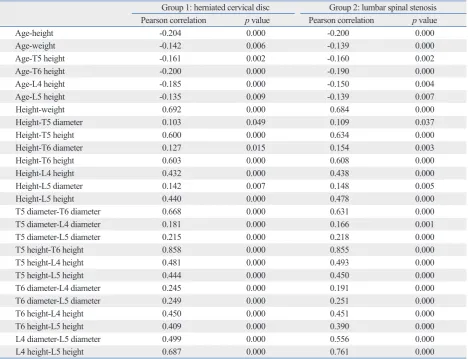
Table 3. Correlation Coefficients between Parameters
Group 1: herniated cervical disc Group 2: lumbar spinal stenosis
Pearson correlation p value Pearson correlation p value
Age-height -0.204 0.000 -0.200 0.000
Age-weight -0.142 0.006 -0.139 0.000
Age-T5 height -0.161 0.002 -0.160 0.002
Age-T6 height -0.200 0.000 -0.190 0.000
Age-L4 height -0.185 0.000 -0.150 0.004
Age-L5 height -0.135 0.009 -0.139 0.007
Height-weight 0.692 0.000 0.684 0.000
Height-T5 diameter 0.103 0.049 0.109 0.037
Height-T5 height 0.600 0.000 0.634 0.000
Height-T6 diameter 0.127 0.015 0.154 0.003
Height-T6 height 0.603 0.000 0.608 0.000
Height-L4 height 0.432 0.000 0.438 0.000
Height-L5 diameter 0.142 0.007 0.148 0.005
Height-L5 height 0.440 0.000 0.478 0.000
T5 diameter-T6 diameter 0.668 0.000 0.631 0.000
T5 diameter-L4 diameter 0.181 0.000 0.166 0.001
T5 diameter-L5 diameter 0.215 0.000 0.218 0.000
T5 height-T6 height 0.858 0.000 0.855 0.000
T5 height-L4 height 0.481 0.000 0.493 0.000
T5 height-L5 height 0.444 0.000 0.450 0.000
T6 diameter-L4 diameter 0.245 0.000 0.191 0.000
T6 diameter-L5 diameter 0.249 0.000 0.251 0.000
T6 height-L4 height 0.450 0.000 0.451 0.000
T6 height-L5 height 0.409 0.000 0.390 0.000
L4 diameter-L5 diameter 0.499 0.000 0.556 0.000
[image:5.595.57.526.373.732.2]L4 height-L5 height 0.687 0.000 0.761 0.000
Fig. 6. Correlations between all parameters. Age was significantly correlat-ed with all demographic characteristics and vertebral body heights, but did not correlate with spinal canal diameter.
Age
Height
T5 diameter T5 height
T6 diameter T6 height
L4 diameter L4 height
emphasize the importance of disc-vertebrae interactions with age. Mid-vertebral body height decreased in LSS with age, and is likely secondary to intervertebral disc aging.
This study has some limitations. First, we measured the diameter of the spinal canal from the whole spine sagittal images rather than axial cutting. To confirm the cross-sec-tional area of spinal canal, we need mid-vertebral body axi-al cutting MRI. Whole spine sagittaxi-al MRI was performed in patients with LSS and HCD before surgical treatment as a screening, therefore, we received only whole spine sagittal MRI and did not have thoracic axial cutting in LSS or lum-bar and thoracic axial cutting in HCD. Further study should include whole spine axial cutting. Second, mean age (58.9 vs. 62.2 years), height (165.4 vs. 160.4 cm), and weight (65.8 vs. 63.4 kg) were different between groups. However, when stratified by gender, height and weight did not differ between groups or within each group based on age, except old female height with LSS. Despite these limitations, we found that, although the vertebral body height decreased with age, spinal canal diameter did not change with age in patients with either LSS or HCD. From this study, we think that the definition of “degenerative lumbar spinal stenosis” should be changed to reflect the genetic factor.
ACKNOWLEDGEMENTS
The authors thank Tae Sik Kim, at the Department of Neu-rosurgery, Gangnam Severance Hospital, for his effort in this study.
REFERENCES
1. Shao Z, Rompe G, Schiltenwolf M. Radiographic changes in the lumbar intervertebral discs and lumbar vertebrae with age. Spine (Phila Pa 1976) 2002;27:263-8.
2. Ericksen MF. Some aspects of aging in the lumbar spine. Am J Phys Anthropol 1976;45(3 pt. 2):575-80.
3. Vernon-Roberts B, Moore RJ, Fraser RD. The natural history of age-related disc degeneration: the influence of age and pathology on cell populations in the L4-L5 disc. Spine (Phila Pa 1976) 2008;33:2767-73.
4. Twomey L, Taylor J. Age changes in the lumbar spinal and inter-vertebral canals. Paraplegia 1988;26:238-49.
5. Abbas J, Hamoud K, May H, Hay O, Medlej B, Masharawi Y, et al. Degenerative lumbar spinal stenosis and lumbar spine configu-ration. Eur Spine J 2010;19:1865-73.
6. Arnoldi CC, Brodsky AE, Cauchoix J, Crock HV, Dommisse GF, Edgar MA, et al. Lumbar spinal stenosis and nerve root
entrap-plate.11,18 These complex changes decrease the spinal canal
diameter and dural sac dimension, which are related to ag-ing.5 Because various changes due to aging may be related
to pathologic spinal condition, like LSS, determining the changes in the aging spine is important.
However, anatomical studies of the aging spine are usu-ally focused on intervertebral disc and facet joints, not the bony spinal canal, because these structures are elastic and moveable. While changes in the aging spine usually occur in these movable structures,1-4 bony lumbar vertebrae also
change significantly, usually decreasing in height and broad-ening, and the vertebral body was posteriorly wedging at L4-L5 with aging.2,19-21 Twomey and Taylor4 reported that
the bony lumbar spinal canal and foramina shrink with ag-ing, and Abbas, et al.5 concluded that the vertebral bodies
and bony spinal canals are significantly smaller in patients with degenerative LSS than in normal controls. However, Postacchini22 reported that pathologic narrowing of the
nerve-root canal in LSS may not be associated with central spinal canal stenosis. Because these results are conflicting and do not indicate changes with age, it is not certain wheth-er the smallwheth-er vwheth-ertebral bodies and canals in degenwheth-erative LSS are due to genetic factors or age.
In the present study, we observed that spinal canal diame-ters in the LSS group were significantly lower than in the control group at both the largest movable (L4-5) and least movable segments (T5-6), similar to the study reported re-cently.5 However, this is the first study to indicate how the
spinal canal diameter changes with age in LSS. We found that aging did not affect bony spinal canal diameters in either LSS or controls. Therefore, the narrow bony spinal canal in LSS is not due to aging, but rather genetics. Masharawi and Salame23 reported that age is not associated with spinal canal
width and length variation in the thoracic and lumbar verte-brae in normal people.
We also observed that patients with LSS were shorter and weighed less than those with HCD. However, if we strati-fied the groups by gender, there was no difference. Only fe-males with LSS were shorter with age. Although the bony spinal canal diameter was not affected by age, the mid-ver-tebral body height decreased in males with both HCD and LSS with age. As mentioned previously, aging and degen-erative changes of the spine are focused at the intervertebral disc level, and mid-vertebral body height changes are asso-ciated with intervertebral disc changes.11,18 Shao, et al.1
et al. Human lumbar vertebrae. Quantitative three-dimensional anatomy. Spine (Phila Pa 1976) 1992;17:299-306.
16. Panjabi MM, Takata K, Goel V, Federico D, Oxland T, Duranceau J, et al. Thoracic human vertebrae. Quantitative three-dimensional anatomy. Spine (Phila Pa 1976) 1991;16:888-901.
17. White AA 3rd, Panjabi MM. The basic kinematics of the human spine. A review of past and current knowledge. Spine (Phila Pa 1976) 1978;3:12-20.
18. Amundsen T, Weber H, Nordal HJ, Magnaes B, Abdelnoor M, Lilleâs F. Lumbar spinal stenosis: conservative or surgical man-agement?: a prospective 10-year study. Spine (Phila Pa 1976) 2000;25:1424-35.
19. Ericksen MF. Aging in the lumber spine. III. L5. Am J Phys An-thropol 1978;48:247-50.
20. Ericksen MF. Aging in the lumbar spine. II. L1 and L2. Am J Phys Anthropol 1978;48:241-5.
21. Masharawi Y, Salame K, Mirovsky Y, Peleg S, Dar G, Steinberg N, et al. Vertebral body shape variation in the thoracic and lumbar spine: characterization of its asymmetry and wedging. Clin Anat 2008;21:46-54.
22. Postacchini F. Management of lumbar spinal stenosis. J Bone Joint Surg Br 1996;78:154-64.
23. Masharawi Y, Salame K. Shape variation of the neural arch in the thoracic and lumbar spine: characterization and relationship with the vertebral body shape. Clin Anat 2011;24:858-67.
ment syndromes. Definition and classification. Clin Orthop Relat Res 1976:4-5.
7. Bartolozzi P, Salvi M, Misasi M. The diagnosis of lumbar steno-sis. Chir Organi Mov 1992;77:15-8.
8. Eisenstein S. The morphometry and pathological anatomy of the lumbar spine in South African negroes and caucasoids with spe-cific reference to spinal stenosis. J Bone Joint Surg Br 1977;59: 173-80.
9. Katz JN, Dalgas M, Stucki G, Lipson SJ. Diagnosis of lumbar spi-nal stenosis. Rheum Dis Clin North Am 1994;20:471-83. 10. Singh K, Samartzis D, Vaccaro AR, Nassr A, Andersson GB,
Yoon ST, et al. Congenital lumbar spinal stenosis: a prospective, control-matched, cohort radiographic analysis. Spine J 2005;5: 615-22.
11. Kirkaldy-Willis WH, Wedge JH, Yong-Hing K, Reilly J. Patholo-gy and pathogenesis of lumbar spondylosis and stenosis. Spine (Phila Pa 1976) 1978;3:319-28.
12. Kirkaldy-Willis WH, Paine KW, Cauchoix J, McIvor G. Lumbar spinal stenosis. Clin Orthop Relat Res 1974:30-50.
13. Kirkaldy-Willis WH, Wedge JH, Yong-Hing K, Tchang S, de Ko-rompay V, Shannon R. Lumbar spinal nerve lateral entrapment. Clin Orthop Relat Res 1982:171-8.
14. Panjabi MM, White AA 3rd. Basic biomechanics of the spine. Neurosurgery 1980;7:76-93.