2017 2nd International Conference on Artificial Intelligence and Engineering Applications (AIEA 2017)
ISBN: 978-1-60595-485-1
A High Resolution Method for Acoustic Localization
in Far-field Based on Sliding DFT Algorithm
JINGXUAN YANG, FENG LUAN and QIQI BAO
ABSTRACT
In order to accurate the time delay estimation and orientation localization, in this paper, we are aimed at finding a high resolution algorithm to improve the deviation in the far-field source localization. Compared with the traditional method based on the cross-correlation algorithm which often corresponds with the interpolation algorithm, the method of Sliding DFT is a novel time delay estimation approach based on the Sliding DFT analysis window, which is more comprehensive and accurate. The signal is specified into a singularity frequency signal and this algorithm of Sliding DFT uses the sample number at the maximum magnitude of the spectrum as the first estimation and utilize its corresponding phase offset for compensation with the aim to estimate the time delay of the signal, which is a rather new method applied to the acoustic localization field in this paper. The simulation includes a simple acoustic source with singularity frequency using the traditional cross-correlation algorithm and the improved Sliding DFT algorithm, accompanied with the matrix transformation method to compute the position of the assumed signal. After calculating and comparing the statistic of both algorithms, the improvement of the accuracy can be easily seen.
KEYWORDS
Acoustic source, Sliding DFT, high resolution.
INTRODUCTION
In this paper, firstly, we use the traditional cross-correlation algorithm [1] to get the time delay. Fill the matrix with the voltage information of the acoustic source collected by the eight microphones, then just like the method of convolution, we get the degree of the possibility or similarity between the sequences from different microphones, where the abscissa of the peak value is time delay. However, in this method, the abscissa must be transferred into integer to satisfy the algorithm, which causes some evitable error. To improve this, we choose the interpolation method to develop the accuracy without changing or increasing the sampling frequency [2]. Then, we propose a frequency-domain high-resolution time delay estimation technique based on the Sliding DFT [3] of a short sinusoidal pulse signal and the corresponding phase information. The Sliding DFT is a novel time delay estimation approach based on sliding the discrete Fourier transform analysis window [4].
_________________________________________
Unlike conventional methods, this approach obtains time delays with high resolution without the need to over-sample the signal or to interpolate between samples. Sliding DFT also solves this circumstance, where the sampling point has some deviation of phase when the time of arrival is not multiple of the sampling period. On the basis of the time delay, the distance differences between source and each microphone are gained by sliding the discrete Fourier transform (DFT) analysis window. Apply Sliding DFT in the simulation and assume the acoustic source is a sine wave with singularity frequency and place a round microphone array, which is far away from the acoustic source. Next, we use the corresponding phase offset to estimate the precise time delay further after getting the time delay.
In Section 2, we present the method of Sliding DFT and cross-correlation and introduce the different ways that Sliding DFT and cross-correlation use to accurate their calculation accuracy respectively, for Sliding DFT apply the phase to accurate the time delay while cross-correlation uses interpolation. In Section 3, we do a simulation and discuss the results given by two algorithms and do a comparison between those two methods.
METHODOLOGY
Estimate the Time Delay from Sliding DFT
In some signal processing applications, neither DFT nor FFT can link time and frequency at the same time. In this paper, we choose the method of Sliding DFT, through which we can link time and frequency together by inputting the shifted window by one position forward in time. At each instant, an N-point DFT transforms the N most recent samples of the input sequence.
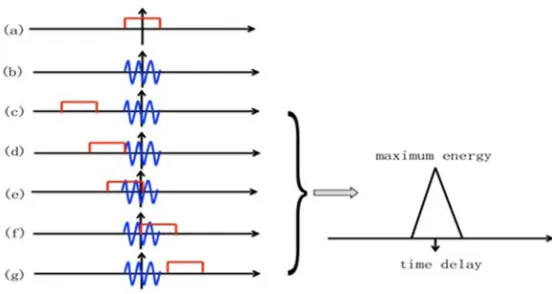
Fig.1 shows the theory to slide the window function from (a) to (g). The magnitude in the figure on the right hand shows the energy included in the window. The horizon coordinate corresponding to the maximum amplitude represents the time delay [5].
Given is a discrete-time signal, which composed of a sequence of n values in (1).
[image:2.612.158.434.516.663.2]X n = x 0 ,x 1 ,x 2 ……x n-2 ,x n 1 . (1)
In certain applications, we wish to analyze the signal using an N fixed-length sliding window and an n N times DFT operations are performed. X (m) (0 < m ≪ n N) is the magnitude of the Sliding DFT spectrum, and θ is the corresponding phase offset computed by Sliding DFT algorithm [6] [7].
In (2), f is the sampling frequency of the signal and m is the time sample corresponding to the maximum magnitude peak of X (m). In the algorithm of Sliding DFT [9], we can get the maximum magnitude of X m . And its corresponding m divided by fs represents the approximate time delay t .
Xmax m = max X0,X1,X2,……Xn-2 +N,Xn-1 +N, .
t0=m/f . (2)
We can also gain the information of the signal’s arrival time by the phase information θm of the arriving signal, which will help us make further step of operating a more precise time delay result. In (3), τ corresponds to the analyzed signal period. Besides, in order to convert the phase information to time delay t , the phase θ should be multiplied by the period of the acoustic source and divided by 360 degree.
t =t0 τ×θm/360. (3)
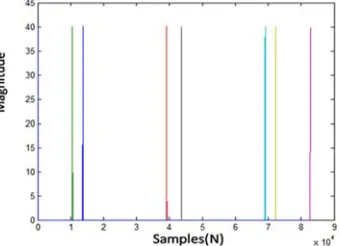
The signal in Fig.2 has some delay in time and this means that the time of arrival is not multiple of the sampling period and it is obviously located in between two successive samples. The time delay calculated by the signal shown in Fig.2, which can be reflected in the phase difference.
Estimate the Time Delay from Cross Correlation.
The cross correlation algorithm is the basic method of describing the similarity of two signals in the time domain. It describes the degree of correlation between the two time series at any different time. Since there is a certain correlation between the signals from the same source, it is possible to estimate the time difference by calculating the correlation between the signals received from the same signal source by different sensors.
Assume that two-time sequences x1 n , x2(n) from two microphones in different positions. Then the cross correlation algorithm of x1 n , x2 n is,
R12 τ =E x1 n x2 n τ . (4)
In (4), the corresponding τ represents the time delay between the two microphones when R12 τ gets the maximum value.
SIMULATIONS
The simulation with the method of cross correlation and Sliding DFT is operating with the same statistic and condition. Assuming that the acoustic source is a sine wave whose frequency is 2000 Hz and the sampling frequency is 1600000 Hz. The sine wave is sin (2πf∙n/fs) and n equals to 80 is the sampling number. Place eight microphones into a circle whose radius is R=1/(7×sin(2π/8)) and the plane of the microphones is 10 meters away from acoustic source and put the acoustic source in a three dimensions space.
Use Cross Correlation with One Acoustic Source
Then simulate 8 data x1 n , x2 n …x8 n from the microphones through MATLAB. Suppose the center of the microphones as a reference point. Use cross correlation algorithm with x n and 8 data from the microphones.
R01 τ E x0 n x1 n-τ . R02 τ E x0 n x2 n-τ .
R08 τ =E x0 n x8 n-τ . (5)
Find the maximum value of R in (5) and get the time delay τ. After time delay is calculated, the position of the acoustic source can get from geometric operations based on the signal array processing.
Use Sliding DFT with One Acoustic Source
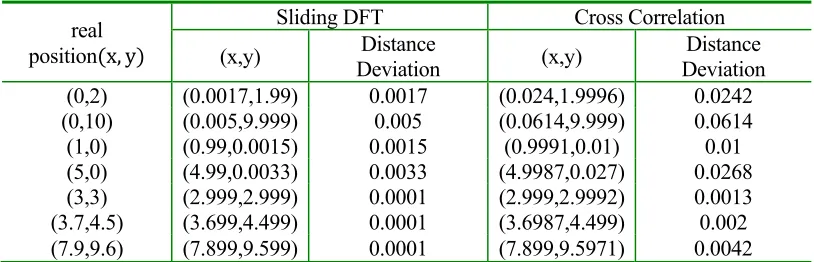
[image:4.612.212.382.578.701.2]TABLE 1. COMPARISON OF MEASURING VALUE AND ACTUAL VALUE BASED ON BOTH
SLIDING DFT AND CROSS CORRELATION SIMULATION AND ASSUME Z =10 IN EACH POSITION.
real position x, y
Sliding DFT Cross Correlation
(x,y) Deviation Distance (x,y) Deviation Distance
(0,2) (0.0017,1.99) 0.0017 (0.024,1.9996) 0.0242
(0,10) (0.005,9.999) 0.005 (0.0614,9.999) 0.0614
(1,0) (0.99,0.0015) 0.0015 (0.9991,0.01) 0.01
(5,0) (4.99,0.0033) 0.0033 (4.9987,0.027) 0.0268
(3,3) (2.999,2.999) 0.0001 (2.999,2.9992) 0.0013
(3.7,4.5) (3.699,4.499) 0.0001 (3.6987,4.499) 0.002
(7.9,9.6) (7.899,9.599) 0.0001 (7.899,9.5971) 0.0042
Simulation results with Sliding DFT and Cross Correlation
According to the Table 1, when x and y is becoming larger, the deviation of actual value and measuring value is also becoming larger. However, the deviation in cross correlation is bigger than that in Sliding DFT in most positions of the acoustic source as the distance is becoming larger. For example, when x equals to 3.7 meters and y equals to 4.5 meters, the distance deviation with the real position calculated by Sliding DFT is only 0.0001, while the difference is up to 0.0020 when using cross correlation. And comparing the distance deviation in the column in Sliding DFT and cross correlation, it can be seen that the overall error range calculated by cross correlation is much more inaccurate.
SUMMARY
In this paper, we have considered the problem of estimating the time delays based on the traditional cross-correlation algorithm and Sliding DFT, and compare the accuracy of both two methods. The maximum peak of the magnitude spectrum of the Sliding DFT is calculated as a first estimation of time delay, and by adjusting the slight error caused by the phase difference between two integers of the sampling point, a higher resolution time delay and orientation localization is achieved. Taking into account of the phase difference can better estimate the delay time, hence obtain better resolution. Focusing on the simulation, the deviation based on sliding DFT is much smaller than that based on cross correlation, which proves the high resolution of sliding DFT in the acoustic source localization field.
ACKNOWLEDGMENTS
Foundation for Returned Overseas Chinese Scholars, Ministry of Education, and China (No.50-4).
Corresponding author: Feng Luan, [email protected], School of Computer Science and Engineering, Northeastern University, Shenyang 110000, China.
REFERENCES
1. Z.G. Chu, Y. Yang, W.D. Wang, X.B. Xiao, Z.H. Jiang, Y.S. He, Identification of truck noise sources under pass by condition based on wave beam forming method, SHOCK VIB 31 (7) (2012) 66-70. 2. M. Wax, T. Kailath. Optimum localization of multiple sources by passive arrays, IEEE Transactions
on Acoustics Speech and Signal Processing, 1983, 31(5): 1210~1217.
3. Daniel Belega, Dario Petri, sine-wave parameter estimation by interpolated DFT method based on new cosine windows with high interference rejection capability, Digital Signal Processing, 2014, 33: 60-70.
4. L. Belostotski, T.L. Landecker, D. Routledge, Distance measurement with phase stable CW radio link using the Chinese remainder theorem, Electronics Letters, 2001, 37(8): 521-522.
5. E. Jacobsen, R. Lyons, The sliding DFT, Signal Processing Magazine IEEE, 2003, 20(2): 74-80 6. A.K.T. Lee, J. Lucas, L.E. Virr, Microcomputer-controlled acoustic range finding technique, Journal
of Physics E Scientific Instruments, 2000, 22(1): 52.