2017 International Conference on Computer Science and Application Engineering (CSAE 2017) ISBN: 978-1-60595-505-6
Radar Emitter Recognition based on Transfer Learning
Weigang Zhu*, Meng Li, Weigao Chen and Xiaohui Ran
Department of Photoelectric Equipment, Space Engineering University, 101400 Beijing, China
ABSTRACT
Radar emitter identification based on machine learning technology at present mostly assumes that the test set is identically distributed with and the training set, which causes the classification effect is not well when the database samples and the true distribution of the signals are biased. Thus, the theory of transfer learning is introduced into the identification system, and a radar emitter signal identification method based on structural discovery and re-balancing is proposed. By means of database data and target data clustering analysis and re-sampling, correct the distribution and put the new data to the Support Vector Machine (SVM) for training and identifying reconnaissance samples. The simulation results show that the classification performance of the Support Vector Machine model in the new training sample set has been greatly improved.
INTRODUCTION
The radar emitter recognition problem can be attributed to a pattern classification problem, that is, a classification process based on the extracted feature parameters combined with radar database. Machine Learning as a kind of intelligent data analysis tools, can simulate human learning behavior and improve the computer’s learning ability. It attracted wide attention of researchers in the field of radar emitter recognition [1].
From the 80s of the last century, the artificial neural network is introduced to the radiation source identification by the British Navy [2]. A lot of researchers continue to explore the application of machine learning in radar emitter recognition field, and have achieved good results in the Neural Network [3], Support Vector Machine Learning [4] and Ensemble Learning [5] etc. However, these experiments are based on the training set and the test set identically distribute. In practice, the detection sample can not reflect the real distribution of the signal because of limited time of reconnaissance, so that the recognition effect is greatly reduced.
new method based on the transfer learning algorithm, which the training sample is missing due to insufficient data. On the basis of theoretical analysis, the performance of the algorithm is verified by computer simulation in the third part. The fourth part is the conclusion ofthis paper.
RADAR EMITTER RECOGNITION MODEL
In the field of radar emitter recognition, the method of “one to one [6]” is used for
multiple classification. The character database of the radar emitter is
1 1 2 2
D , , , ,..., ,
S S
S S S S S S
S x y x y xN yN , where S
i S
x X is the feature vector of the
i-th sample of the database, ySj YS is the corresponding category label, and the data
amount is NS . D
1, 2,...,
T T T
T x x xNT is the sample data set to be identified, T
j
x
represents the feature vector of the j-th sample, the data amount is NT.
As an important aspect of artificial intelligence technology, machine learning studies rules from training data, and uses these laws to predict new data. A classifier based on machine learning is essentially a mapping c X': S YS.c x'( ) is an estimate of the true mapping c( )x , which is unknown. The sample form used to train the classifier
is(xiS,yiS). The purpose of machine learning is to construct a function c', so that it can
approach c as closely as possible, Then it will accurately predicts the attribute information of the source to be identified.
The known data samples xSi XS and corresponding label S S j
y Y are input into the classifier for training, and the characteristic of the signal to be identified is input into the trained classifier, so that the corresponding signal class and radiation source information can be obtained.
It is proved by the paper [3] that the normal vector of the optimal hyper-plane can be expressed as a linear combination of support vectors:
w i i i, 0
v y
x (1)Where V is the support vector set. It is shown that the support set fully describes the characters of the whole sample set, and has the same classification characteristic as the sample space. The optimal hyper-plane of the SVM is completely determined by the support vector. Based on it, although the standard SVM doesn’t have the enough ability of the real-time training, but it can be improved by online learning.
RADAR EMITTER RECOGNITION METHOD BASED ON TRANSFER LEARNING
The joint distribution of the two sources is different when the signal of the source to be identified is not in accordance with the radar database, i.e., P x yS
, P x yT
, .Since the database samples are different from the samples to be identified, the model '( )
the data distribution between the source domain and the target domain to train the classifier, so as to improve the generalization ability of the learning model in the target data set.
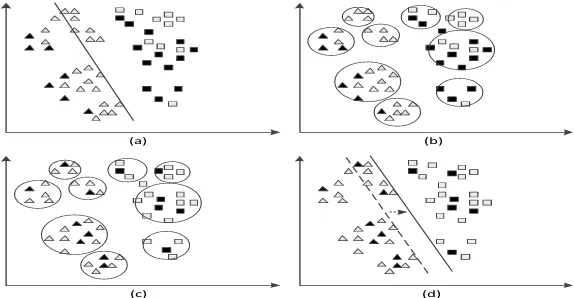
To facilitate understanding, an example of two dimensional data is used to demonstrate the basic idea of this method. As shown in Figure 1, the training sample is represented by a solid point. The sample to be identified is represented by a hollow point, and the triangle and square represent different classes. It can be seen from Figure 1 (a), when the training sample is biased against the sample to be identified, the learning model obtained by the training sample has poor recognition results for the recognition samples.
First, the structure information is found by clustering the entire data set (Figure 1 (b)). Secondly, through re-sampling process, a new training sample set with smaller deviation than the sample to be distributed is selected from each cluster in the same proportion. The training is carried out with this new training sample set (Figure 1 (c)). The newly trained learning model (Figure 1 (d)) has better classification results for recognition samples.
(a) (b)
[image:3.612.156.443.291.440.2](c) (d)
Figure 1. Schematic diagram of transfer learning based on structure discovery and re-balancing.
The data mark credibility is represented as:
1arg max ,
S
j S
i S
x X i j
Rl x
x x
(2)
When xi is the source domain data, to prevent x xi, Sj 0, make =1.0 10 3. If
i
x is an unlabeled sample to be identified, the ySj is used as the label of xSj which is the
nearest marked sample.
Data representation is represented as:
1,
i
i k
Rp x
x c
(3)
1 1 Ck
k
N
k l
l C
c x
N
stands for the center of the cluster Ck where xi is located. Toprevent xi from happening right in the center of Ck, x ci, k =0, make
3 =1.0 10
When clusters contain fewer samples, it is assumed that the internal data distribution is the same. It can be proved [11] that the new training sample selected from the same proportion in each cluster is consistent with the total data set without bias.
SIMULATION EXPERIMENT AND ANALYSIS
Validate the performance of the method according to the actual data of five types of radar emitter (including short-range search, medium-range search, remote search, missile guidance, tracking measurement). The characteristic parameters are shown in TABLE I. The signal samples are generated for a series of simulation.
TABLE I. PARAMETERS OF RADAR DATABASE.
Status RF
(MHz)
PRI (μs)
PW
(μs) PA
IBW (MHz)
Search 1 [2990,3280] [800,1000] [3.3,6.9] [16,31] [10.6,16]
Search 2 [2798,2898] [700,900] [5,14] [6,18] [24.6,33]
Search 3 [3198,3297] [4500,6000] [45,52] [10,56] [16.6,33]
Track 1 [2925,3105] [400,1200] [0.3,1.3] [5,38] [8.3,56]
Guide 1 [2850,2950] [200,500] [0.2,0.6] [3,12] [6.5,8.7]
According to the statistical characteristics of the signal, the samples are generated by simulation, and some samples are taken out in proportion, and the remaining samples are used as the original database (the deletion rate is the proportion of excluded samples to the total sample).
Because the Support Vector Machine has the advantages of simple structure and global optimum, it exhibits excellent performance in solving the small sample and nonlinear problems. So SVM is selected as classifier, and radial basis function
2
2 exp( x xi )
is used as the kernel the radial basis function is the core, and the
penalty factor is set C100.
The classic K-means and DBSCAN algorithms are used to cluster the data sets in this paper. There are large fluctuations although the K-means algorithm is the average of many experiments, and the clustering effect depends on the number of sub-classes. Since the prior information about the number of clusters of signals to be identified is less, it is considered that the K-means algorithm is not suitable for the clustering of radar emitter signals. The DBSCAN algorithm is a clustering algorithm based on density. It does not need to set the number of sub-classes, and can automatically discard the sample points which are recognized as noise. It is less affected by outliers, and the experimental results are relatively stable. So the distribution structure of radar signal samples is analyzed by using DBSCAN algorithm.
TABLE II. IDENTIFICATION RATE UNDER DIFFERENT MISSING AND ERROR.
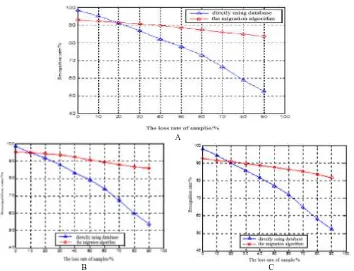
The variation trend of recognition rate under different errors is shown in Figure 2.
A
B C
Errors (%)
Missing (%)
0 10 20 30 40 50 60 70 80 90
0 98.16 97.52 97.44 96.72 93.12 90.32 85.44 80.10 74.32 68.51
95.67 94.89 94.11 93.33 92.52 91.27 89.48 88.52 88.81 87.23
2 95.08 94.47 93.01 92.61 88.71 87.60 83.25 76.17 70.02 63.57
94.36 94.11 92.36 93.35 90.47 88.30 87.36 86.06 82.83 83.41
4 91.16 90.90 89.82 88.34 85.92 82.60 78.40 73.22 66.76 59.35
90.36 89.76 89.36 88.66 88.36 86.56 85.36 85.06 82.76 81.96
6 87.11 87.02 85.99 83.31 82.14 77.62 74.46 70.04 64.11 57.85
84.78 85.07 84.67 83.97 83.76 82.57 81.45 80.30 78.57 77.63
8 83.85 83.66 83.21 82.69 78.88 75.47 70.86 68.12 62.34 55.05
77.61 76.87 77.05 75.78 74.21 73.61 71.88 71.04 70.69 68.15
10 76.08 75.84 76.46 74.12 72.32 71.12 67.93 64.38 59.45 50.12
71.25 70.71 70.45 68.31 65.66 65.31 62.41 59.96 57.31 57.01
12 72.47 72.31 71.88 70.42 67.54 64.33 62.26 60.27 55.37 46.46
63.33 64.02 62.67 60.31 57.27 55.63 52.70 50.14 48.30 46.84
14 68.68 67.55 68.12 66.30 65.21 62.46 57.84 55.11 48.22 40.34
D E
Figure 2. Comparison of identification results before and after improvement.
Respectively under 4%, 6%, 8% and 10% error conditions, the recognition results are compared before and after the transfer learning algorithm, as shown in Figure 2.
It can be seen that when the database samples are missing, the recognition rate of training samples directly using the database declined significantly in the loss rate of more than 30%; and the samples after equilibrium classifier recognition rate of training decreased slightly, but remained stable. The validity of the method is proved.
CONCLUSIONS
In this paper, a method of radar emitter recognition based on transfer learning is proposed to solve the problem of poor classification result when the radar database and the real signal distribution are biased. The method reduces the distribution error between training set and sample to be identified by finding the sample distribution structure, and effectively solves the problem of emitter identification when the training sample is missing due to insufficient data. In order to analyze the sample distribution, the method needs to cluster and analyze the signal, so that the recognition effect is not good when the measurement error is large, and how to improve the recognition rate under large error conditions will be the focus of the next phase of the study.
REFERENCES
1. You Qubo, and Wu Yaoyun. 2011. “Ensign and Application of Classifier for Emitter Recognition,”
J. Electronic Information Warfare Technology, 26(3): 20-24. (in Chinese)
2. Roe, J. and A. Pudner. 1994. “The real-time implementation of emitter identification for ESM,” J.
Proceedings of IEEE Colloquium on Signal Processing in Electronic Warfare, 16(7):1-6.
3. Wang Jianhua, Zhao Liping, and Yu Pingliang. 1999. “Radiator Identification of Navel Vessel
Carried Radar Based on Fuzzy Neural Networks,” J. Journal of Harbin University of Science and
Technology, 32(2): 67-69. (in Chinese)
4. Zhang Gexiang, Jin Weidong, and Hu Laizhao. 2004. “Radar emitter signal recognition based on
support vector machines,” presented at the 8th International Conference on Control, Automation, Robotics and Vision. 2004.
5. Chen Wei, Zhou Xiao, and Ye Fei. 2005. “The Application of AdaBoost–NN in Radar Signal
Recognition,” J. Electronic Warfare Technology, 28(1): 29-33. (in Chinese)
6. Long Mingsheng. 2014. “Transfer Learning: Problems and Methods,” Tsinghua University. (in
Chinese)
7. Zhuang F, Luo P, and Du C. 2014. “Triplex transfer learning: exploiting both shared and distinct
8. Patel, V. M, R. Gopalan, and L. Ruonan. 2015. “Visual domain adaptation: a survey of recent
advances,” J. IEEE Signal Processing Magazine, 32(3): 53-69.
9. Peter, F. 2012. “Machine Learning: The Art and Science of Algorithms that Make Sense of Data,”
Cambridge University, Cambridge.
10. Ren J.T, Shi X.X, and Fan W. 2008. “Type Independent Correction of Sample Selection Bias via
Structural Discovery and Re-balancing Proceedings of the SDM,” Auckland: ACM, pp: 565-576.
11. Liu Zhen, Yang Junan, and Liu Hui. 2016. “Transfer Learning with Fuzzy Neighborhood Density