International Journal of Emerging Technology and Advanced Engineering
Website: www.ijetae.com (ISSN 2250-2459, ISO 9001:2008 Certified Journal, Volume 3, Issue 7, July 2013)
70
Experimental and Software Analysis of Composite Plate Under
Shear loading
P. P. Kamble
1, Prof. N. K. Chhapkhane
2 1,2Department of Mechanical Engg. R.I.T. Sakharale
Abstract— This paper deals with an experimental and software analysis of composite plate under shear loading. Glass fiber is a light weight, extremely strong, and robust material. Although strength properties are some what lower than carbon fiber and it is less stiff, the material is typically far less brittle, and the raw materials are much less expensive. Its bulk strength and weight properties are also very favorable when compared to metals, and it can be easily formed using molding processes.
Keywords— Reflection Polariscope, Plastic coating sheet, composite plate, Abaqus software, Stress values.
I. INTRODUCTION
A composite material is a macroscopic combination of two or more distinct materials, having a recognizable interface between them. Composites are used not only for their structural properties, but also for electrical, thermal, tribological, and environmental applications. Modern composite materials are usually optimized to achieve a particular balance of properties for a given range of applications.
Glass reinforced plastic (also known as fiber glass), is a composite material that consists of strands of glass fiber suspended in a polymer matrix, i.e. resin; which results in a material that combines the compressive strength of plastic and the tensile strength of glass fiber, thus resulting in a composite material that can withstand compressive and tensile loads, but this strength can be further enhanced with the addition of reinforcements or more exotic fibers such as Kevlar or carbon fiber, both of these fires can be woven into a cloth with various fiber orientations such as, unidirectional, bi-axial, tri-axial, and quadaxial weaves, but these cloths are normally employed in more hi-end products like formula one racing cars etc.
II. MANUFACTURING OF COMPOSITE PLATE
There are two methods for manufacturing of composite plate
1. Hand layup technique
2. Vacuum bag molding technique
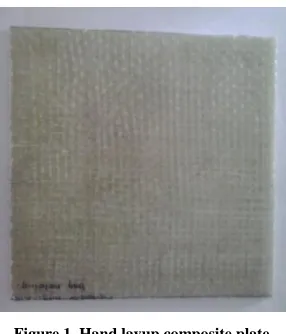
[image:1.612.373.516.217.384.2]Above two methods we use hand layup technique for manufacturing of composite plate.
Figure 1. Hand layup composite plate
First, take the glass plate and clean it with the help of
cloth.
Above that glass plate place the Mylar sheet.
Take 100ml epoxy resin, 10ml hardener.
Mix these three elements properly with the help of
mixing rod so that proper mixture will be take place.
Apply this mixture on the Mylar sheet gently with the
help of brush.
Place the first glass fiber sheet into the desired
orientation and move the dry brush on this first layer which will remove the air gap present inside the fiber sheet. Apply the pressure on this first layer with the help of Aluminium rod from middle to another ends of the sheet which will remove the excess resin.
Now, place the second glass fiber sheet into the
desired orientation and repeat the procedure given above.
With this process, we are able to place no. of layers of
glass fibers as per requirement.
Place the second Mylar sheet above the glass fiber
layers.
Remove the glass plate after 30 hours; because curing
International Journal of Emerging Technology and Advanced Engineering
Website: www.ijetae.com (ISSN 2250-2459, ISO 9001:2008 Certified Journal, Volume 3, Issue 7, July 2013)
71
Now, the composite plate is ready for further
machining and the experimentation.
III. CASTING AND CONTOURING PHOTOSTRESS SHEETS
The following procedures are used for casting and contouring Photostress sheets. The procedure can be divided into six principal steps:
Preparing the casting plate
Preparing and pouring the plastic resin and hardener
Polymerization cycle
Removing plastic sheet from the casting plate
Contouring the sheet to the test-part surface
Removing the cured sheet from the test part
Bonding Procedure for composite plate
1. Determining Amount of Resin and Hardener
The total amount (weight) of plastic is determined by:
W = d x A x t
Where:
W = total amount needed (in gm)
d = plastic density, [1.13 * gm/m3]
A = area of sheet to be cast (width x length)
t = desired thickness of sheet
W = 1.13 * * 180 * 180 * 2.5
W = 91.53 gm
The amount of hardener is indicated in ―parts per hundred,‖ or ―pph,‖ by weight. For example, 20 pph of hardener means 20 gm of hardener for 100 gm of resin. Refer above Coating Materials chart to determine the proper proportion of hardener to resin. Then, continuing with the above example, for a total of 73.224 gm of Type PL-1 plastic, the resin and hardener calculations are made as follows:
PL-1 Resin: 91.53 * = 76.27 gm
PLH-1 Hardener: 91.53 * = 15.25 gm
1. Calibration Measurements
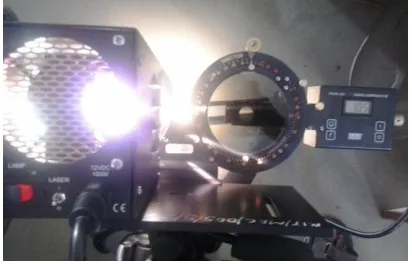
[image:2.612.342.546.134.280.2]i. Insert the beam all of the way into the mounting clamp, center the free end of the beam between the side rails of the calibrator, and clamp firmly in place (see figure 10).
Figure 10. Standard calibrator
ii. Using a fine-pointed grease pencil, marking pen, or scriber, mark the coating with a small cross + on the centreline of the beam and directly in line with the index lines on the side rails of the calibrator. This will be the calibration point.
Figure 11. Compensator fringe order value
iii. Set up the calibrator and LF/Z-2 Polariscope for
normal-incidence measurements. Observe the
coating at the calibration point while slowly rotating the micrometer head. When the spindle of the micrometer contacts the beam, slight birefringence will start to appear in the coating. Continue rotating until the micrometer reading reaches a convenient round number say, 0.05 inch (see figure 11).
iv. Accurately measure the fringe order at the premarked
[image:2.612.341.547.351.483.2]International Journal of Emerging Technology and Advanced Engineering
Website: www.ijetae.com (ISSN 2250-2459, ISO 9001:2008 Certified Journal, Volume 3, Issue 7, July 2013)
[image:3.612.66.272.147.537.2]72
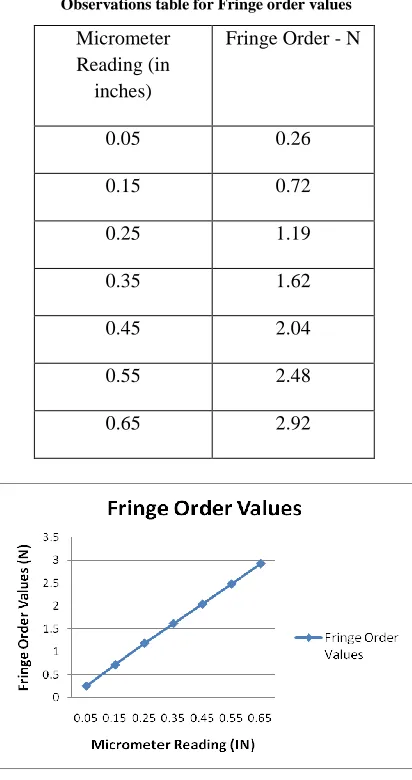
Table. 1
Observations table for Fringe order values
Micrometer Reading (in
inches)
Fringe Order - N
0.05 0.26
0.15 0.72
0.25 1.19
0.35 1.62
0.45 2.04
0.55 2.48
0.65 2.92
Graph 1. Fringe Order Vs Micrometer Reading
From chart we can find out the value of strain-optic coefficient K′ = 0.15
K= K′ [1+ ]
Where:
K′ = strain-optic coefficient
K = actual (corrected) strain-optic coefficient
= standard adhesive thickness (0.075 mm)
= actual adhesive thickness (0.87mm)
= beam thickness (6.35 mm)
= coating thickness (2mm)
Put these values in above equation no.1 then
We have
K = 0.15 [1+ ]
K = 0.1 * 0.8203
K = 0.1230
IV. EXPERIMENTAL ANALYSIS
i. The experimental analysis consists of shear load
testing, so the composite laminate panels are pulled for shear load testing. Also the load must be applied gradually in steps of kg. The composite laminate panel is fixed at one end and other end load applied under shear load testing (see figure 12). The main objective of experimental analysis is to find out stress values of composite panel with centrally located diagonal notch.
Figure 12. Attach test specimen on UTM
a. Place the polariscope on a table and adjust the height
of light source and test specimen will be same
.
Attachthe test specimen on the universal testing machine
about 2 meters away from the polariscope
.
Insure thatInternational Journal of Emerging Technology and Advanced Engineering
Website: www.ijetae.com (ISSN 2250-2459, ISO 9001:2008 Certified Journal, Volume 3, Issue 7, July 2013)
[image:4.612.93.241.121.337.2]73
Figure 12. Experimental setup
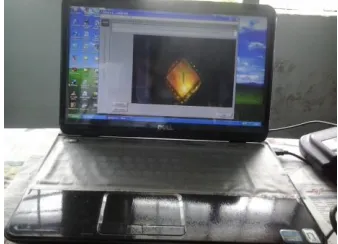
b.Lock the screw after alignment is done. Boot the
[image:4.612.341.545.135.253.2]computer and turn on the video camera by moving the power switch to the camera position.
Figure 13. Computer screen with PhotoStress color pattern
c. Double click the PS Calc software icon. Apply the
load on test specimen by using universal testing machine. The computer screen should show a pattern of color bands. Use the video camera zoom control to fill the computer screen with the PhotoStress color pattern (see figure 13)
.
d.The polariscope is set in the direction of the principal
stresses at the marked point,with respect to a vertical
reference between the polariscope and test specimen. When no load acting on test specimen (see figure 14).
Figure 14. No load acting on test specimen
e. Insure that the test specimen is under load and
stepwise load in kg is increasing on test specimen. While increasing load, change the color band on test specimen (see figure 15).
Figure 15. Color band, when load is 200 kg
Load (Kg) Fringe order values
(N)
50 0.81
100 1.70
150 2.60
200 3.48
[image:4.612.332.560.322.449.2] [image:4.612.83.252.386.508.2]International Journal of Emerging Technology and Advanced Engineering
Website: www.ijetae.com (ISSN 2250-2459, ISO 9001:2008 Certified Journal, Volume 3, Issue 7, July 2013)
74
1. Calculation for Experimental stress values
Where:
=calibration value of coating material
The calibration value may be obtained by
Where K is an optical constant (a number) of the
PhotoStress plastic and tcis the plastic thickness.
But we know that the principal stress perpendicular to the boundary is zero. When the Compensator is positioned tangent to the boundary and compensation can be made, we
[image:5.612.322.566.130.261.2] [image:5.612.324.585.341.493.2]solve for , and the sign is positive ( = 0).
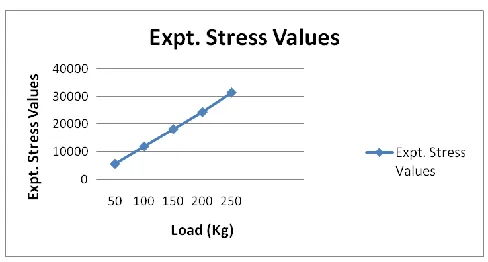
Table No. 7.2 Expt. Stress values (N/mm2)
Load (Kg) Experimental Stress
values (N/mm2)
50 5.6738*103
100 11.9019*103
150 18.2194*103
200 24.3763*103
250 31.3810*103
Graph 4. Expt. Stress values Vs Load (Kg)
V. FE ANALYSIS USING ABAQUS SOFTWARE
[image:5.612.333.554.525.685.2]Software analysis for stress values of composite plate with centrally located diagonal notch and subjected to in shear loading (see figure 16).
Figure 16. stress values, when load 150kg
Table No. 7.1 Software Stress values (N/mm2)
Load (Kg) Software Stress values
(N/mm2)
50 6.790*103
100 13.58*103
150 20.37*103
200 27.16*103
International Journal of Emerging Technology and Advanced Engineering
Website: www.ijetae.com (ISSN 2250-2459, ISO 9001:2008 Certified Journal, Volume 3, Issue 7, July 2013)
75
Graph 3. Software stress values Vs Load (Kg)
VI. CONCLUSION
Experimental and Software results from testing on
composite plate under shear loading containing the stress values are calculated.
The variation in results occurs may be because the
PhotoStress coating applied over the surface of composite structure takes some of the applied load.
By considering all results there are some error due to
some experimental and software problem but in each type of analysis it is observed that by increased load on composite plate, stress values of composite plate increase.
The errors between experimental result and FEA
result are in between 9-12 %.
REFERENCES
[1 ] Shukla A., Jain N. Dynamic damage growth in particle reinforced graded materials. International Journal of Impact Engineering 30 (2004) 777–803
[2 ] Nowak T. P., Jankowski L. J., Jasienko J. Application of photoelastic coating technique in tests of solid wooden beams reinforced with CFRP strips. Wroclaw University of Technology, Wybrzeze Wyspianskiego 27, 50-370 Wroclaw, Poland
[3 ] Ambur D. R., Jaunky N., Hilburger M. W. Progressive failure studies of stiffened panels subjected to shear loading, composite structures 65 (2004) 129-142
[4 ] Weijia Zhang, The Notched Strength of Angle-Ply Laminates, A thesis submitted in conformity with the requirements for the degree of Master of Applied Science Department of Chemical Engineering and Applied Chemistry University of Toronto. Toronto. Ontario. Canada
[5 ] Basu S., Waas A. M., Ambur D. R. Compressive failure of fiber composites under multi-axial loading. Journal of the Mechanics and Physics of Solids 54 (2006) 611–634