Journal of Chemical and Pharmaceutical Research, 2016, 8(3):841-848
Research Article
CODEN(USA) : JCPRC5
ISSN : 0975-7384
Development and validation of thin layer chromatography-densitometry
method for determination of glimepiride in tablets
Harrizul Rivai
1*, Vera Wahyuni Adha
2and Fitra Fauziah
21Faculty of Pharmacy, University of Andalas, Padang 25163, Indonesia 2College of Pharmacy, Jl. Tamansiswa No. 9, Padang 25132, Indonesia
_____________________________________________________________________________________________
ABSTRACT
A simple, selective and accurate thin layer chromatography (TLC)-densitometry method has been developed and validated for analysis of glimepiride in tablets. Glimepiride assay was performed by TLC-densitometry using silica gel 60 F254 plates as the stationary phase and a mixture of chloroform : methanol (9 : 1) as the best mobile phase.
Standard solution of glimepiride in the range of 100-500 ppm resulted in a regression equation y = 1221.03 + 17.9959x with r = 0.9973. Glimepiride detection limit was 44.10598 ppm and the limit of quantification of glimepiride was 133.6545 ppm. Accuracy was obtained percent recovery for glimepiride was 101.19 % ± 2.67 % for Metrix® (PT Kalbe Farma) and 100.86 % ± 1,83 % for generic tablet (PT Dexa Medica). Precision intraday and interday had good repeatability as RSD ≤ 2 %. The analysis showed levels of glimepiride on a generic tablet of 104.68 % ± 0.50 % and glimepiride tablets under the trade name of 104.49 % ± 0.60 %. The levels glimepiride obtained have suitably qualified Indonesian Pharmacopoeia edition V, i.e. 90-110 %.
Keywords: Glimepirida, thin layer chromatography, densitometry, validation
_____________________________________________________________________________________________
INTRODUCTION
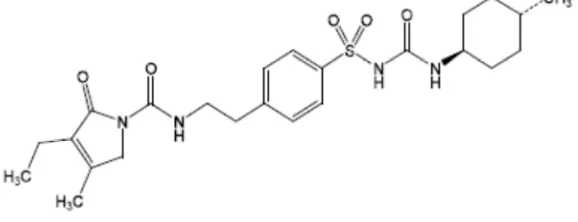
[image:1.595.165.454.610.721.2]Glimepiride (Fig. 1) is a derivative sulfonylurea class of drugs, with the chemical name 1-[[p-[2-(3-ethyl-4-methyl-2-oxo-3pyrolin-1-carboxamido) ethyl] phenyl] sulfonyl]-3-(trans-4-methyl-cyclohexyl) urea [1]. Metformin-glimepiride tablets resulted in significantly greater reductions in glycosylated hemoglobin and fasting plasma glucose compared with metformin plus glibenclamide in patients with type 2 diabetes mellitus [2]. Glimepiride monotherapy markedly improved a rapid homeostatic model assessment (HOMA-R) with moderate insulin stimulation, which may account for the difference in macro vascular disease development as compared with the group receiving glibenclamide [3].
Fig. 1: Chemical structure of glimepiride
life of 5 hours, allowing once-daily dosing. Therefore patient compliance using this medicine will be increased so that the use of this drug is very profitable. This drug becomes the first choice in patients with type II diabetes mellitus [4].
The assay of glimepiride in tablets is usually carried out by high performance liquid chromatography as Indonesian Pharmacopoeia [1]. Literature survey revealed that several methods were used to analysis of glimepiride in tablets. These methods either in single or multiple components include ultraviolet-visible spectrophotometer [5, 6, 7, 8, 9, 10, and 11], derivative ultraviolet spectrophotometer [12, 13], thin layer chromatographic–densitometry assay [14], and high performance liquid chromatography [15, 16].
The aim of this study is performing very simple method of TLC-densitometry in terms of mobile phase and program to analysis glimepiride in tablet, and validation of method in according to ICH guideline [17].
EXPERIMENTAL SECTION
Materials, chemicals and equipment
The materials used in this study were the glimepiride raw material obtained from PT Tatarasa Primatama. Generic tablet (PT Dexa Medica, No. Batch 4406377) containing 4 mg glimepiride and glimepiride tablets under the trade name Metrix® (PT Kalbe Farma, No. Batch BN 524020) containing 4 mg glimepiride were procured from local market. Methanol, chloroform, acetone and potassium hydroxide were procured from Merck Indonesia. The tools used in this research were the UV lamp 254 and 366 nm (Camag), TLC Scanner 4 with software Wincat (Camag), Capillary pipette 5 µ L size (Camag), Twin Chamber size 20 x 20 cm (Camag), silica gel plate 60 F254 250 µm (Merck) size 20 x 20 cm, sonicator, vacuum desiccators, digital analytical balance (ABJ 220-4M type), and a filter paper (Whatmann No. 41).
Preparation of standard solution
A total of 100 mg of glimepiride was weighed carefully and put in a 100 mL volumetric flask, then dissolved in methanol while stirring and added methanol to the mark. The glimepiride solution contains 1 mg/mL or 1,000 ppm.
Method Development
Glimepiride solution was prepared using chloroform as solvent. The TLC plates were pre washed with methanol and activated by keeping at 115 °C for about 30 minutes. Solutions of 5.0 µL were applied on the TLC plates as using Camag Nanomat 4. Application positions were at least 10 mm from the sides and 10 mm from the bottom of the plates. Mobile phase components were mixed prior to use and the development chamber was left to saturate with mobile phase vapor for 15 minutes before each run. Mobile phase components were listed in Table 1.
Table 1: Component of mobile phase used in TLC of glimepiride analysis
Component of mobile phase Ratio Rf
Chloroform : Methanol, plate was sprayed with KOH 0.1 N 9 : 1 0.28
Chloroform : Methanol 9 : 1 0.60
Chloroform : Methanol 8 : 2 0.86
Chloroform : Methanol 7 : 3 0.94
Acetone 10 0.78
Methanol 10 0.86
Development of the plates was carried out by the ascending technique to a migration distance of 8 cm. The plates were dried by hair dryer. Densitometry scanning was done in absorbance mode at 320 nm using a deuterium lamp. The slit dimensions were set at 6 x 0.30 mm, the scanning speed at 20 mm/s and data resolution at 100 m/step. Single wavelength detection was performed because we are dealing with main component analysis and not impurities determinations where scanning at the individual λ values would be preferred. These conditions were transferred to the TLC system and the results were evaluated with the aim of achieving an optimum separation between spots (Rs ≥ 2) and a migration of spots with Rf values between 0.2 and 0.8 in order to ensure separation reproducibility [18, 19].
Sample Preparation
Qualitative analysis of sample solution
TLC plate 10 x 4 cm was prepared and created a line of mark 1 cm from the bottom edge and 1 cm from the top. Standard solution, the generic samples and Metrix® each with a concentration of 400 ppm were spotted by 2 µ L with 3 spots on the start line with a distance spotting each 1 cm. The plate was inserted into the chamber that had been saturated with mobile phase. Chamber was closed and left so that the mobile phase moves until it reaches the top line. Chamber was opened, the TLC plate was taken and dried by the wind. Then the value of Rf was determined by using UV lamp at 254 nm.
Quantitative analysis of sample solution
Test solution with a concentration of 400 ppm of each sample was spotted as many as three spots with a volume of 5 µL at the start line with a spot distance of 1 cm from each other. The plates were put in a chamber that has been saturated with mobile phase. The chamber was closed and left so that the mobile phase moves until it reaches the top line. The chamber was opened; the TLC plate was taken and dried. Spotting was observed under 254 nm UV lamps. Then spotting was scanned with tools Camag TLC Scanner 4 with a wavelength of 228 nm in order to get the data area under curve of the test compound. The area was included in the regression equation, and then obtained compound content.
Method Validation Linearity
The glimepiride standard solution was pipette sequentially respectively 1, 2, 3, 4, and 5 mL in 10 mL volumetric flask and added methanol to mark boundaries in order to obtain a concentration of 100, 200, 300, 400, and 500 ppm. Glimepiride solutions were applied as much as 5 µL on a TLC plate silica gel 60 F254, then eluted with an eluent to mark boundaries above and dried at room temperature. The plates were analyzed using a densitometer, so that would be obtained area under curve (AUC) for each concentration. Linearity was determined by processing the concentration data (x) and wide area (y) of the calibration curve obtained using the linear regression equation, in order to obtain the value of the correlation coefficient. The regression equation can be used if the correlation factor of 0.99 ≤ r ≤ 1.The limits of detection and limits of quantization were calculated from a calibration curve statistically through linear line of the standard curve.
Precision
Testing was done by testing the repeatability as a variation in a day. The levels used in testing precision were 200, 400, and 500 ppm spotted on silica gel 60 F254 plates with a volume of 5 µ L and eluted with eluent and dried. Spotting the silica plate and then analyzed by a densitometer. AUC data obtained were then calculated the average value, standard deviation (SD) and the relative standard deviation (RSD). The precision was tested with intra-day precision for one day in the morning, noon and afternoon, while the precision inter-day was checked by repeating the research for three consecutive days. Glimepiride concentration in the sample was calculated by regression equation obtained from the calibration curve.
Accuracy
Recovery studies were performed to check the accuracy of this method. This sample contained 400 ppm glimepiride. Recovery experiments were performed by adding three different amounts of glimepiride, i.e. 80, 100 and 120 %. These levels were expected to represent the lowest and highest levels of standard curve used. Samples were spotted on a silica gel 60 F254 plates each 3 times application with application volume 5 µL and eluted with the eluent. Spotting the silica plate was then analyzed by densitometry and the data will be obtained in the form of AUC values of samples that have been added to the standard.
RESULTS AND DISCUSSION
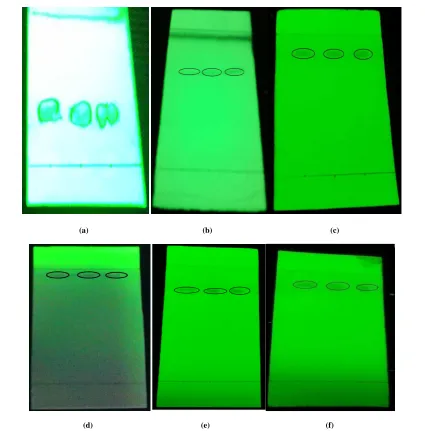
(a) (b) (c)
[image:4.595.95.520.65.496.2](d) (e) (f)
Fig. 1: Thin layer chromatogram of glimepiride with the mobile phase (a) chloroform : methanol (9 : 1, plate was sprayed with KOH 0.1 N); (b) chloroform : methanol (9 : 1); (c) chloroform : methanol (8 : 2); (d) chloroform: methanol (7 : 3); (e) methanol (10); (f) acetone
(10) seen under UV light at 254 nm. Left = Standard glimepiride; middle = Tablets generic glimepiride and right = glimepiride tablets under the trade name Metrix®
Validation of the method in this study, the correlation coefficient showed a linear (Fig. 2), because it meets the acceptance criteria that the correlation coefficient (r) ≤ 1 [17]. LOD and LOQ values can be determined from regression equations and standard deviation (Table 2). RSD value of precision obtained was about equal to 2 %, it can be said that this method has good repeatability value (Table 3 and Table 4).
Table 2: Results of method validation
Parameter Glimepiride
Linearity range 100 – 500 ppm Correlation coefficient 0.997331 Regression Equation Y = 1221.03 + 19.9959 X
LOD 44.10598 ppm
.
[image:5.595.169.445.368.646.2]Fig. 2: Calibration curve of glimepiride
Table 3: Evaluation of intra-day precision of glimepiride
Time AUC Concentration (ppm) Average (ppm) SD RSD
Morning
4892.8 204.03
202.37 3.36 1.66 4902.6 204.58
4793.3 198.50 8190.5 387.28
391.29 5.29 1.35 8370.6 397.29
8227.0 389.31 10143.5 495.81
496.09 1.54 0.31 10178.5 497.75
10123.8 494.71
Noon
4988.4 209.35
208.81 1.38 0.66 4950.6 207.25
4997.3 209.84 8225.0 389.20
387.84 1.18 0.31 8186.1 387.04
8190.5 387.28 10744.7 529.21
533.39 7.54 1.41 10738.5 528.87
10976.6 542.10
Afternoon
4755.3 196.39
196.33 2.36 1.20 4796.0 198.65
4711.1 193.94 8229.2 389.43
390.01 1.26 0.32 8265.7 391.46
8223.9 389.14 10478.9 514.44
516.09 1.72 0.33 10505.9 515.94
10540.7 517.88
The results of analysis with TLC Scanner method showed that the levels of generic glimepiride tablets and glimepiride tablets under the trade name Metrix® accordance with the provisions of Ministry of Health of the Republic of Indonesia (Table 5) [1]. Densitogram of generic glimepiride and Metrix® samples were shown in Figs. 3 and 4.
Table 4: Evaluation of inter-day precision of glimepiride
Day AUC Concentration (ppm) Average (ppm) SD RSD
1
4912.1 205.11
207.50 2.10 1.01
4983.0 209.05
4970.5 208.35
8389.2 398.32
400.29 6.65 1.66
8326.8 394.86
8558.0 407.70
10495.6 515.37
518.52 7.58 1.46
10453.2 513.02
10707.8 527.16
2
4912.1 205.11
207.51 2.11 1.02
4983.5 209.07
4970.5 208.35
8616.3 410.94
411.52 1.00 0.24
8616.3 410.94
8647.5 412.68
10495.6 515.37
520.53 6.03 1.16
10562.1 519.07
10707.8 527.16
3
4790.2 198.33
195.05 3.48 1.79
4737.7 195.42
4665.4 191.40
8525.5 405.90
408.57 3.20 0.78
8558.0 407.70
8637.5 412.12
11095.6 548.71
541.23 8.17 1.51
10983.3 542.47
[image:6.595.73.540.388.640.2]10804.1 532.51
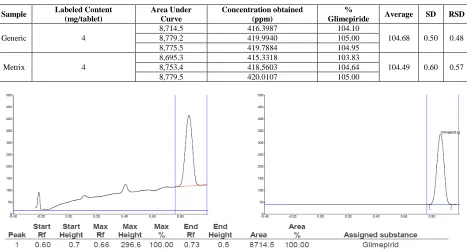
Table 5: The results of measurements of samples glimepiride
Sample Labeled Content (mg/tablet)
Area Under Curve
Concentration obtained (ppm)
%
Glimepiride Average SD RSD
Generic 4
8,714.5 416.3987 104.10
104.68 0.50 0.48
8,779.2 419.9940 105.00
8,775.5 419.7884 104.95
Metrix 4
8,695.3 415.3318 103.83
104.49 0.60 0.57
8,753.4 418.5603 104.64
8,779.5 420.0107 105.00
Fig. 4: Densitogram samples of Metrix 5 µL volume applications, mobile phase chloroform : methanol (9 : 1), at a wavelength of 228 nm
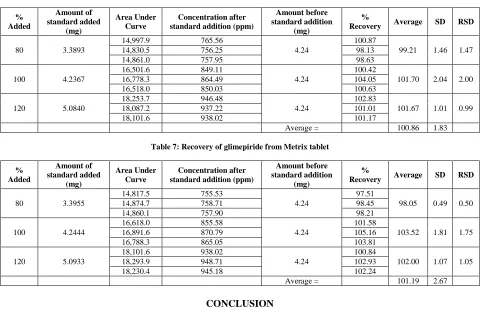
The test results show that the accuracy of glimepiride recoveries were in the range allowed (80-110 %). So this proves that this method gives accurate results (Table 6 and 7).
Table 6: Recovery of glimepiride from generic tablet
% Added Amount of standard added (mg) Area Under Curve Concentration after standard addition (ppm)
Amount before standard addition
(mg)
%
Recovery Average SD RSD
80 3.3893
14,997.9 765.56
4.24
100.87
99.21 1.46 1.47
14,830.5 756.25 98.13
14,861.0 757.95 98.63
100 4.2367
16,501.6 849.11
4.24
100.42
101.70 2.04 2.00
16,778.3 864.49 104.05
16,518.0 850.03 100.63
120 5.0840
18,253.7 946.48
4.24
102.83
101.67 1.01 0.99
18,087.2 937.22 101.01
18,101.6 938.02 101.17
[image:7.595.66.549.317.626.2]Average = 100.86 1.83
Table 7: Recovery of glimepiride from Metrix tablet
% Added Amount of standard added (mg) Area Under Curve Concentration after standard addition (ppm)
Amount before standard addition
(mg)
%
Recovery Average SD RSD
80 3.3955
14,817.5 755.53
4.24
97.51
98.05 0.49 0.50
14,874.7 758.71 98.45
14,860.1 757.90 98.21
100 4.2444
16,618.0 855.58
4.24
101.58
103.52 1.81 1.75
16,891.6 870.79 105.16
16,788.3 865.05 103.81
120 5.0933
18,101.6 938.02
4.24
100.84
102.00 1.07 1.05
18,293.9 948.71 102.93
18,230.4 945.18 102.24
Average = 101.19 2.67
CONCLUSION
In this work, TLC-densitometry technique was developed and validated for the analysis of glimepiride in pharmaceutical tablets. The proposed method was simple, accurate and highly selective for glimepiride. The satisfactory sensitivity and simplicity make the methods suitable for routine analysis of glimepiride in quality control laboratories.
Acknowledgements
REFERENCES
[1] Kementerian Kesehatan Repulik Indonesia. Farmakope Indonesia, Edisi 5, Kementerian Kesehatan RI, Jakarta, 2014, 492-495.
[2] RD Shimpi; PH Patil; VG Kuchake; PV Ingle1; S J Surana1; PN Dighore, International Journal of PharmTech
Research, 2009, 1(1), 50-61
[3] H Onuma; K Inukai; M Watanabe; Y Sumitani; T Hosaka; H Ishida, Journal of Diabetes Mellitus, 2014, 4(1), 33-37.
[4]BG Katzung (Ed.), Basic & Clinical Pharmacology, 9th Edition, Lange Medical Books, London, 2003.
[5]A Afroz; T Haque; MMU Talukder; SMA Islam, Asian J. Pharm. Ana., 2011, 1(4), 74-78
[6]S Bhargavi; G Suryasagar; DK Sowmya; K Ashok; S Nama, Int. J. Pharm. Sci. Rev. Res., 2013, 21(2), 131-133
[7]M Induri; B Raju; R Prasad; P Reddy, E-Journal of Chemistry, 2012, 9(2), 993-998
[8]S Naveed; H Qamar; W Jawaid; U Bokhari, Open Science Journal of Clinical Medicine, 2014; 2(4): 94-97 [9]AG Sumit; KN Tarkase; DB Mundhe; PP Hajare, Der Pharma Chemica, 2013, 5(3), 122-127
[10] GK Dyade; HA Joshi; RN Patil, Indo American Journal of Pharmaceutical Research, 2013, 3(1), 1381-1386 [11] BP Adithya; M Vijayalakshmi; UVR Krishna; KN Reddy, Inventi Rapid: Pharm Analysis & Quality Assurance,
2012, 2012(4), 1-5
[12] R Bonfilio; MB de Araújo; HRN Salgado, J. Braz. Chem. Soc., 2011, 22(2), 292-299
[13] S Altonoz; D Takeli, Journal of Pharmaceutical and Biomedical Analysis, 2001, 24(3), 507-515 [14] SM Dhole; PB Khedekar; ND Amnerkar, J. Chil. Chem. Soc., 2013, 58(2), 1663-1666
[15] BP Reddy; D Boopathy; B Mathew; M Prakash; P Peruma, Int. J. ChemTech Res., 2010, 2(1), 50-53 [16] K Neelima; YR Prasad, Pharmaceutical Methods, 2014, 5(1), 27-33
[17] International Conference on Harmonization (ICH). Validation of Analytical Procedures, Text and Methodology, Q2 (R1), 2005
[18] H Rivai; WK Putri; F Armin, J Chem Pharm Res., 2016, 8(1), 565-570