Factor Structure and Measurement Invariance of
the Self-discipline Model Using the Different-length
Questionnaires: Application of Multiple
Matrix Sampling
Suntonrapot Damrongpanit
Department of Educational Evaluation and Research, Faculty of Education, Chiang Mai University, Thailand
Copyright©2019 by authors, all rights reserved. Authors agree that this article remains permanently open access under the terms of the Creative Commons Attribution License 4.0 International License
Abstract
The purposes of this study were to test the structural validity and to test the parameters invariance of the self-discipline measurement model for good student citizenship among the models, using the data from the 1,047 complete questionnaires and the reducing length questionnaires with multiple matrix sampling technique. The sample size of this study was 1,047 bachelor’s degree students selected by means of a multi-stage sampling technique. A set of 5 rating scale and 89-item questionnaires, divided into two versions, 44 and 45 each. The data were analyzed by confirmatory factor analysis and multiple group analysis. The research findings were as follows: 1) the model can be used to confirm the self-discipline construct validity of 4 components as responsibility, honesty, compliance and patience with ambition and intention, and 2) patterns and parameters of the model were varied between the models using the data from the full questionnaire and the data that reduced the length of the questionnaire. However, the measurement model is consistent with the empirical data in both cases.Keywords
Multiple Matrix Sampling, Multiple Matrix Booklet Design, Questionnaire Length, Split Questionnaire, Questionnaire Design, Model Invariance1. Introduction
Research instrument development for measuring social science variables is likely to use the increasing length since the researcher's point of view needed to be explained, the relationship between the variables is highly complex and correlated with many variables. As a result, the concept of research is broader and more complex. Moreover, according to the principles of measurement and analysis of social science variables, the use of multiple questions will
not only help confirm the content validity of the abstract measurement. In addition, the instrument reliability increases with the number of items [41]. In practice; however, many of the problems followed by the use of instruments are beyond the scope of the respondent's attention, no matter what kind of data collection method [4].
Questionnaires and tests are popular tools used by researchers to collect data and often found that the design for development and structuring multiple questions is for measuring each variable completely. While the length is increased, it has limitation towards quality if data in various cases ([24]; [14]). For example, 1) the response rate is significantly reduced if the length of questionnaire is more than 4 pages [42]; 2) the willingness of the respondents decrease when they spend more than 20 minutes providing information [1]; 3) the return of the questionnaire is 30% when the questionnaire is 1 page long and it is gradually reduced if the number of pages of the questionnaire is added together with the question of attitudes and open-ended questions. [3]; 4) the return of short-length questionnaire with the probability is greater than the return of the long-length questionnaire ([17]; [33]); 5) the length of the questionnaire correlates with the intention to read and respond to the questionnaire completely; 6) the respondents are more likely to misrepresent the factual information and have a large amount of missing data when using long-length questionnaire. There are also opportunities for rejection in the entire questionnaire ([28]; [10]; [2]). Therefore, the longer the questionnaire is, more possible for missing of fact and more difficult to solve problems with statistical procedures (such as missing value replacement, converting data to quality based on statistical usage conditions). It is not the actual solution. However, reducing the number of items is an important way to address these limitations.
be the simplest way to go about controlling the question in the right amount. As a result, researchers can easily determine the number of appropriate items, ease to manage and spend no long time to integrate and analyze data. But there is limitation that is the defect in confirming content validity in the measurement of highly abstract and wide-ranging social science variables. While other scholars propose ways to reduce the number of items, the number of questions for each respondent decreases. But the scope of measurement is still covered by theoretical framework and research frameworks, also known as Multiple Matrix Sampling (MMS) ([36]; [27]; [9]; [10]). The concept was developed to reduce the limitations, was better than the first method and was in line with current research in social sciences specifically, the collection of data on quality measurement of educational standards of learners at the national level, with the scope of measurement of broad academic knowledge involving lots of content. Consequently, it is necessary to use the questions to be as representatives measuring the sufficiently covered content, such as TIMSS, PISA, PIRLS, NAEP ([10]; [13]).
Even the MMS technique has the advantage of collecting social data in the past, the application is still in the scope of massive survey [2] and large scale measurements of what the researchers are interested in. ([13]; [43]; [10]; [20]). The lack of development and validation of the effectiveness of MMS for the development of statistical techniques in the analysis of social science research data requires the use of research instruments with the long length especially, the structural equation model (SEM), which focuses on the study and measurement of variables, is called latent variable. It is derived from several common variables, called the measurement model and the analysis called factor analysis. Thereupon, the researcher would like to compare the results of using MMS technique to measure self-discipline variables for good citizenship. It is the scope with complex variables with many metrics and questions in order to prove that when using the MMS technique to collect data from a questionnaire, compared to using a full-length questionnaire, does the research result differ and how?
1.1. Multiple Matrix Sampling
Turnbull, Ebel, and Lord: researchers from the Education Assessment Service presented the first MMS concept in the early 1950s to collect and analyze national education data to estimate the norm [37]. The results showed that the mean of the population was the closest to the sample mean when the items were randomly selected for splitting questionnaire and assigned students to answer this randomized sub-questionnaire [43]. Later on American official units has started to apply MMS in 1970 [9], and the development of a statistical method to test the effect of MMS on a clearer basis. In particular, the work of Shoemaker [37], who studied and wrote documents on the
use of MMS, describes the statistical methodology, estimation, hypothesis testing, and guidelines of MMS application in the data integration. He described and gathered them; therefore, he became the first reference citation until now.
MMS is a technique used to split the items within the same questionnaire into randomly selected subgroups called sub-questionnaire (sometimes refers to as a booklet) to be used to gather data from sub-samples that are grouped from a single sample to provide only one copy. Therefore, each sample does not need to answer for all full frame items in a complete questionnaire, but all questionnaires are included in randomized complete subgroups ([27]; [25]). The questionnaire design is managed some questions to share for all subgroups of sample before the results are then sorted into a matrix of respondents' responses to show the relationship between respondents and each response received individually. The questions without answers are as the missing value called as Missing Completely At Random (MCAR). This means that the loss of data is independent from the responses in question, then the other complete data can be used and affect the few variation of conclusion ([30]; [9]), so it can bring the obtain data to statistical analysis for analyzing data.
The principles of splitting question set based on MMS are 1 ( the number of booklet sets (t) can be divided not more than the number of item to measure the sub-variables or observed variables with the least number of items such as the variable using the least questions measure basically on 3 items; therefore, the booklet can be divided not more than 3 sets 1) question per set), 2) setting the number of item in each set (k) should be equal or very similar. It can be calculated from the total number of questionnaires in the completed questionnaire (I) divided by the total number of booklets (k = I / t) such as there are 150 items for the complete questionnaire if setting 3 booklets; each has 50 items and 3) the number of respondents (n) can be calculated from the total number of samples (N) divided by the number of booklets (n = N / t). For example, there are 600 respondents with 3 booklets. Consequent, 200 respondents answer for a booklet (each questionnaire is randomized for each respondent ([39]; [16]) . Moreover, to manage the question sets to booklet, it can be done both having sharing questions and unsharring questions for all samples giving data [40] .The other questions can be randomly selected with either replacement technique or without replacement technique [23].
instrument [37], and 5) preventing the copier from answering the question if the tool is a national test designed using multiple booklets. The limitation are found that 1) the probability of receiving a booklet of samples is not independent of each other, 2) the management and use of the booklets is more complicated, 3) There is no accurate principles about the application of random pattern in real situation. It depends on the situation and suitability [27].
The knowledge gained from MMS research is well known in the early 1970s. Researchers focus on the effects of using MMS in various ways. The results of this study are summarized as follows: 1) splitting the questionnaire with many booklets produces better result than splatting with the least booklets since the number of questions in booklets is reduced and it affects the estimation of mean with stability [37]; 2) randomness of stratified random sampling based on the content and item difficulty level of the questionnaire on stability of mean estimation and variance is not significantly different from simple random sampling ([21]; [29]); 3) simple randomization may not be appropriate for use in the context of educational measurement because of the contextual differences and the purpose of measurement. Therefore, randomized block selection can be used with the purpose of the block to provide a subset of booklets, called Balanced Incomplete Block Design (BIB) [43]; 4) the use of MMS, there is the potential for a context effect when multiple tests are used by administrators for multiple and variant exams to test all students at the same time [37]. However, scholars also see that the context effect may have less chance and a little effect on measurement results, and 5) the application of MMS to compare the goodness of fit of SEM using the 2 and 3 sets of the MMS package, it was found that the sampling model for 3 booklet sets of without replacement items and unsharring questions has the correlation between the model and better fit with the empirical data than the mentioned model from the complete questionnaire [16] .However, research reports using MMS were also used to study the effect of the present small-scale equation model. The structural equation analysis technique is an analysis that can be split into many sub-techniques. If there is the serious study, it is useful to describe the phenomenon that researchers are more interested in corresponding to the conditions of the relationship of social science and confirm the accuracy of the measurement specifically; the variables that define the scope of the measurement are wildly and highly abstract.
1.2. The Hypothetical Model
Data used in the study of MMS, the researcher selected the self-discipline model analysis for good citizenship of undergraduate students. There are four main reasons for this: 1) it is a fundamental feature of human resource development that is an important force in society and nation ([34]; [11]). The scope of self-discipline still has the limitations is quite abstract and extensive, and modify
according to development by age, so the understanding of the self-discipline scope, 2) the results of the synthesis of documents related to the concept of the academic showed that there is the different description of the self-discipline characteristics, varied from five to twelve behaviors ([44]; [8]; [26]). According to the synthesized research report about self-discipline characteristics covered 40 researches among the primary level students to the university students, the majority of students as 22.50% defined self-discipline measurement as behaving based on the agreement to act as only one behavior. In addition, 13 different behaviors of disciplinary behaviors were found. There was a clear difference in understanding of the core features of self-discipline in Thailand, 3) higher education students is a product of development of self-discipline from the basic education system in the country for more than 14 years by law, which deserves to be equipped with self-discipline preconceptions before becoming a good citizen after graduation. It is not that incredible, disclosure of information on self-discipline and social discipline in such groups is ongoing such as traffic discipline, fake documents, and examination fraud. It also does not maintain enrollment time or enrollment for each semester, and 4) the abstraction of the measure with a large number of attributes makes it difficult, so it is essential to use a lot of questions for measurement and it affects the length of the instrument. Hence, it is appropriate to use MMS to test the results of the analysis of measurement models in Model Form and Parameters invariances.
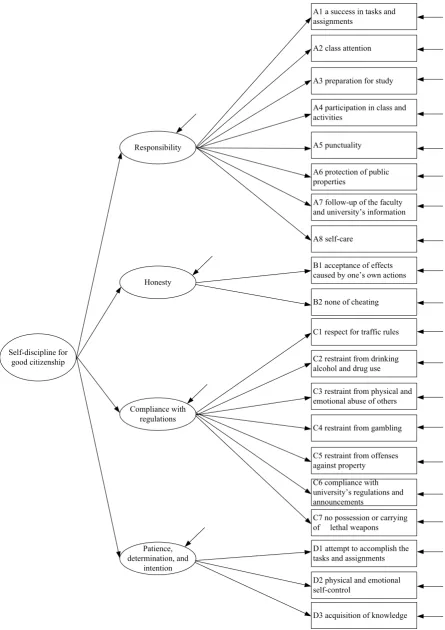
The researchers set up a framework for measuring and developing self-discipline measurement models for good citizenship. Based on the synthesis of variables from the concept above, the four components of disciplinary measurement are as follows: 1) Responsibility: RES, it is covering 8 indicators for measuring performance as 1.1) a success in tasks and assignments; 1.2) class attention; 1.3) preparation for study; 1.4) participation in class and activities held by the faculty and university; 1.5) punctuality; 1.6) protection of public properties; 1.7) follow-up of the faculty and university’s information; and 1.8) Self-care, 2) Honesty: HON is the measure of the 2 indicators that are 2.1) acceptance of effects caused by one’s own actions and 2.2) none of cheating, 3) Compliance with regulations: COM means 7 indicators as 3.1) respect for traffic rules; 3.2) restraint from drinking alcohol and drug use; 3.3) restraint from physical and emotional abuse of others; 3.4) restraint from gambling; 3.5) restraint from offenses against property; 3.6) compliance with university’s regulations and announcements; 3.7) no possession or carrying of lethal weapons; and 4) Patience, determination, and intention: PAT covers 3 indicators as 4.1) attempt to accomplish the tasks and assignments; 4.2) physical and emotional self-control; 4.3) acquisition of knowledge.
students indicates the relationship as the measurement
model illustrated in Figure 1 .The researcher uses it the hypothesis model in this study.
Self-discipline for good citizenship
Honesty Responsibility
Compliance with regulations
Patience, determination, and
intention
A1 a success in tasks and assignments
A2 class attention
A3 preparation for study
A4 participation in class and activities
A5 punctuality
A6 protection of public properties
A7 follow-up of the faculty and university’s information
A8 self-care
B1 acceptance of effects caused by one’s own actions
B2 none of cheating
C1 respect for traffic rules
C2 restraint from drinking alcohol and drug use
C3 restraint from physical and emotional abuse of others
C4 restraint from gambling
C5 restraint from offenses against property C6 compliance with university’s regulations and announcements
C7 no possession or carrying of lethal weapons
D1 attempt to accomplish the tasks and assignments
D2 physical and emotional self-control
D3 acquisition of knowledge
[image:4.595.72.518.109.740.2]
2. Research Methodology
2.1. Research Objectives
The research aims to study two aspects: 1) to test model validation of the self-discipline for good citizenship. Since the model has been reviewed, new components and indicators are released as a result of the review of relevant literature and research including extending the scope of measurement for identifying features in higher education students. The group of students is strong in the body and mind. This scope is compliance with the field of self-discipline metrics covering all synthesized indicators, and 2) to test the differences model form and estimated parameters in the self-discipline model from the MMS application between a full questionnaire and a split questionnaire.
2.2. Samples and Data Collection
Research samples included 1,047 undergraduate students of Chiang Mai University; 585 (41.578%) males and 822 (58.422%) females. They were randomly selected by stratified random sampling from a population of 25,152
in 22 faculties. The sample size estimation was 15 times of parameters in the hypothetical mode of the self-discipline measurement with 67 values, more than 10 times as suggested by the use of equation modeling techniques ([22]; [12]) because the design of multiple group analysis, the Pearson’s correlation of proportion between population and sample in each faculty was 0.743. It implied that the research sample represented for the population in good level.
The instrument used in the research was Self-Discipline Measurement (89 items), 4 pages in length, and 5 rating – scale items (1 = least practice, 5 = best practice). It measure the components of responsibility (39 items), honesty (8 items), compliance with regulations (23 items), and patience, determination, and intention (17 items). Each item was subjected to a content validity check from a specialist before attempting a tryout with 120 similar characteristics of samples. Then, the results of the questionnaire brought to calculate the value of discrimination by Item-Total Correlation. The finding was found to be positive between 0.219 and 0.896 and reliability (α) using the Cronbach's Alpha Coefficient formula to measure the 20 indicators, ranged from 0.547 to 0.908 (Table 1).
Table1. Structure of Variables and Quality Measurements of Self-Discipline Measurement of Students, Indicators and Components Latent
Variables Observed Variables items discrimination Reliability From 1 From 2
RES α ( =0.920)
A1 a success in tasks and assignments 1-3 0.530-0.692 0.779 2,3 1
A2 class attention 4-9 0.219-0.621 0.708 5,6,9 4,7,8
A3 preparation for study 10-12 0.383-0.663 0.727 10 11,12
A4 participation in class and activities
held by the faculty and university 13-18 0.438-0.535 0.761 16,17,18 13,14,15
A5 punctuality 19-21 0.312-0.592 0.638 20,21 19
A6 protection of public properties 22-26 0.487-0.595 0.767 24,25 22,23,26
A7 follow-up of the faculty and
university’s information 27-28 0.376-0.376 0.547 28 27
A8 self-care 29-39 0.330-0.605 0.812 31,32,33,34,35 29,30,36,37,38,39
HON α ( =0.826)
B1 acceptance of effects caused by one’s
own actions 40-42 0.511-0.636 0.745 40,42 41
B2 none of cheating 43-47 0.319-0.712 0.769 43,44,47 45,46
COM α ( =0.946)
C1 respect for traffic rules 48-49 0.444-0.444 0.611 49 48
C2 restraint from drinking alcohol and
drug use 50-51 0.697-0.697 0.822 51 50
C3 restraint from physical and emotional
abuse of others 52-54 0.791-0.863 0.907 54 52,53
C4 restraint from gambling 55-56 0.732-0.732 0.844 55 56
C5 restraint from offenses against
property 57-59 0.772-0.896 0.908 57 58,59
C6 compliance with university’s
regulations and announcements 60-69 0.373-0.718 0.863 61,62,63,66,68 60,64,65,67,69 C7 no possession or carrying of lethal
weapons 70-72 0.599-0.654 0.780 70,72 71
PAT α ( =0.901)
D1 attempt to accomplish the tasks and
assignments 73-76 0.549-0.640 0.781 73.74 75,76
D2 physical and emotional self-control 77-87 0.394-0.633 0.857 79,80,83,85,86 77,78,81,82,84,87
D3 acquisition of knowledge 88-89 0.746-0.746 0.855 88 89
Total 44 45
The researcher collected the questionnaire along with the data of students in each faculty who were the samples by clarifying the objectives and free timing for answering process. It was found that students were able to read and write data for 45-30minutes, then returned the completed questionnaire, checked the completeness and recorded the data for analysis in two cases. The first case is using the data from the complete questionnaire to check the accuracy of model validation and the second case uses the data from the complete questionnaire combined with the obtained data dividing the booklets by MMS. With the MMS, the questionnaire was split into two issues by the recommendation of Van Der Linden and other [34]. They proposed to conduct stratified random sampling through the block, using the components to study as block or the strata in random. In this case, the researcher selected the observable variable as a block or stratified random for managing the questionnaire and random each booklet in each observable variable. There was one variable left and then it was gathers in to one set randomly. This was because the number of questions in the least variable in the measurement of the observation variable was fivevariables: A7, C1, C2, C4, and D3are two variables, resulting in no more than two sets of questions. The total of 44items, two pages, the reliability of 0.937, and the second questionnaire were 45items with twopages. The reliability was 0.913.
2.3. Data Analysis
The researcher applied the results of the disciplinary approach that was considered for the completeness and prepared the results as matrix of the relationship between the students’ responses and 89 questions individually. After that there was the mean from each item for 20 observable variables in order to analyze data based on each objective.
According to the first objective, the researcher used the data to prepare the mean of each observed variables from the full questionnaire to analyze by Second-order Confirmatory Factor Analysis (2nd CFA) for the validity of the hypothesis model with empirical data using Mplus 7.4 with the maximum likelihood estimation method (ML). It was used to determine the correlation between the model and the empirical data comprising of the relative chi-square or the proportion between chi-square and degree of freedom that should not exceed 2[35]. The p-value showed no statistically significance at . 05 )p-value ≥ .05) In addition, the Comparative Fit Index (CFI) and the Tucker-Lewis Index (TLI) should be more than 0.90
)
if more than 0.95is very good). The Root Mean Square Error of Approximation (RMSEA) and the Standardized Root Mean Square Residual (SRMR) index should be below 0.08 if less than 0.05, it is very consistent) ([15]; [19])
.The second objective is to study the differences in model form and parameter estimation between models using the data from the full complete questionnaire and the split questionnaire. Based on the MMS concept, the researchers used a multiple group confirmatory factor
analysis (MGCFA) to test the invariance of the model form and the parameters in the measurement model [5]
.
Considering the statistical significance of the chi-square relative value from the set condition, the parameter setting between the groups was the same value. It started from setting the strict condition in each part: hypothesis test for parameter invariance test of measurement errors of observed variables (H1-H4) and, in addition, hypothesis test for measurement errors of latent variables (H5-H6). Then, hypothesis makes a test for factor loadings of observable variables (H7-H10) and latent variables (H11), respectively ([18]; [7]). To assess the consistency of the model and empirical data for multiple group analysis, the change of CFI, TLI, and RMSEA [6] were used to determine. If it was found the change after setting the condition of CFI that was not higher than 0.01 (ΔCFI ≤ 0.01) and the TLI value was not higher than 0.50 (ΔTLI ≤ 0.50) including RMSEA values, they would be not statistically significant.3. Findings
3.1. The Model Validation Test of the Self-discipline for Good Citizenship
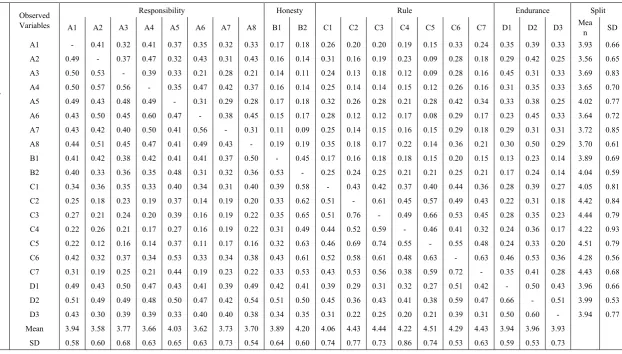
In preliminary data, each observable variable had the mean value between 3.58 (A2) to 4.45 (C5) and SD between0.53 (C6, D2) to0.86 (C4) and the value of KMO was 0.949. Bartlett's test of sphericity showed the rejection of the null hypothesis at the significant level as .01 (χ2=
16221.757, df = 190, p-value = 0.000). It indicated that the observable variables had the significant correlation towards component analysis (detailed correlation coefficients were shown in the lower diagonal correlation matrix in Appendix). The results of the second-order CFA analysis showed that the hypothesis model was consistent with the empirical data at a good levelwith the consistent index asχ2= 187.931, df = 161, p-value = 0.0720 indicated
that acceptance of the null hypothesis (H0) was with CFI = 0.998, TLI = 0.998, RMSEA = 0.011 and SRMR = 0.032. With this value, the model had the congruence with the empirical data as the setting criteria. Additionally, the results of parameter estimation showed that the weight values of all components in the model were significantly different from those of the statistically significant ones with the level of significance at .01.
indicators in the standard score ranged from 0.672 (D3) -0.877 (D2) to 0.452 - 0.769. The second component, all components had the weight in standard scores at very high level in all the components. The component of patience, determination, and intention (END) had the highest weight as 0.909, followed by responsibility (RES) as 0.885, honesty (HON) as 0.876, and compliance with regulations (RUL) as 0.684. The r-square was between 0.481-0.820.
3.2. The Comparison of the Model Form and
Parameters between Full-length Questionnaire and Split Questionnaire Multiple Matrix Sampling Technique
For each variable, the data was analyzed by means of MMS with the Mean value ranged from 3.56 (A2) to 4.44 (C3) and SD between 0.53 (D2) to 0.85 (A7). KMO = 0.919. As the Bartlett's test of sphericity rejected the null hypothesis at .01 significance level (χ2= 10225.691, df =
190, p-value = 0.000) indicated that observable variables were sufficiently correlated to component analysis. (Details of correlation coefficients are shown in the upper diagonal correlation matrix in Appendix).
The results of the model form invariance testing, there were no constrained parameter between groups (Unconditional model), it showed that the model had change between groups considered from the consistency as χ2(352)=1084.317, Contribution Chi-square of full/MMS data = 939.511/144.805, CFI = 0.962, TLI = 0.959, RMSEA = 0.038, SRMR = 0.057. After the model was adjusted, the model was consistent with empirical data. The consistency index before testing, the variability of the parameters within the model was χ2(348)=350.073, Contribution Chi-square of full and split data = 201.273/148.800, p-value=0.459, CFI=1.000, TLI=1.000,
RMSEA=0.002, SRMR=0.031. The parameters invariance test in the model started with 1) the H 1- H4 conditions (the measurement errors of 20 observable variables), it revealed that the values of Δχ2=449.465 , Δdf=20 rejected H
0. This meant that from the measurement observable variable had the variation across two cases of data except for variables A5 and B2 2) H5-H6 conditions (increased measurement error of 5 latent variables) was found to be Δχ2=157.935 , Δdf=5, which rejected H0 and when considering in each components, it indicated that three measurement errors of latent variables were varied: Responsibility, Honesty and Self-discipline. 3) H7--H 10 conditions (increased the test of 16 first-order factor loadings), was found to be Δχ2= 217.532, Δdf=16 rejected H0. Considering in each component, it showed that most of them were observable variables from the measurement of Responsibility as A3 A5 A6 and A8, followed by Compliance with regulations as C4 and C5, Honesty and Patience, determination, and intention had the least number of components, one of which was B 2 and D2, respectively. The weights of all components were positive value had the standard score was between 0.963-0.526 for the complete data model and between 0.506-0.894 for MMS, and 4) H11 condition (increased the test of 3 second-order factor loadings), it showed the values of Δχ2=92.185 , Δdf=3 which rejected null hypothesis. Each component revealed that all weight values from Honesty and Rule had the variation and the weight of component was positive with the standard score was 0.909-0.684 for the actual model with complete data and had the value 0.940-0.456 for split questionnaire. However, all 11 hypothesis testing conditions were consistent with the empirical data because the values of ΔCFI and ΔTLI from testing in each condition in the defined level. The details are in Table 2 and Figure 2.
Table 2. Result of multiple group confirmatory factor analysis
Invariance testing χ2 (df) CFI ΔCFI TLI ΔTLI RMSEA (90% CI) Δχ2 Δdf Varianced
Parameter Unconditional
model 350.07 (348) 1.00 - 1.00 - 0.00 - - -
H1: 8 ME of RES 749.36 (356) 0.98 0.02 0.98 0.02 0.03 (0.03-0.03) 45.43* 8 A1 A2 A3 A4 A6 A7 A8
H2: 2 ME of HON 757.49 (358) 0.98 0.00 0.98 0.00 0.03 (0.03-0.03) 7.77* 2 B1
H3: 7 ME of COM 1099.65 (365) 0.97 0.01 0.97 0.01 0.04 (0.03-0.04) 252.16* 7 C1 C2 C3 C4 C5 C6 C7
H4: 3 ME of PAT 1153.76 (368) 0.96 0.01 0.96 0.01 0.04 (0.04-0.04) 144.11* 3 D1 D2 D3
H5: 4 1st-order
FVAR 1293.77 (372) 0.95 0.01 0.95 0.01 0.04 (0.04-0.04) 140.01* 4 RES, HON
H6: DIS variance 1311.69 (373) 0.95 0.00 0.95 0.00 0.04 (0.04-0.05) 17.93* 1 DIS
H7: 7 FLO of RES 1405.36 (380) 0.95 0.01 0.95 0.00 0.04 (0.04-0.05) 93.67* 7a A3 A5 A6 A8
H8: 1 FLO of
HON 1432.33 (381) 0.95 0.00 0.95 0.00 0.04 (0.04-0.05) 26.97* 1a B2
H9: 6 FLO of
COM 1523.63 (387) 0.94 0.01 0.94 0.00 0.05 (0.04-0.05) 91.29* 6a C4 C5
H10: 2 FLO of
PAT 1529.22 (389) 0.94 0.00 0.94 -0.00 0.05 (0.04-0.05) 5.60* 2a D2
H11: 3 2nd DIS
FLO 1621.41 (392) 0.94 0.00 0.94 0.00 0.05 (0.05-0.05) 92.19* 3a HON, COM
Self-discipline
Honesty Responsibility
Compliance with regulations
Patience, determintion, and intention
A1
A2
A3
A4
A5
A6
A7
A8
B1
B2
C1
C2
C3
C4
C5
C6
C7
D1
D2
D3 (R2 =0.784/0.580 )
0.885**/0.762**
0.876**/0.453**
0.684**/0.731**
0.909**/0.940**
0.708 **/0.640
**
0.702 **/0.609
**
0.693**/0 .530**
0.707**/0.576**
0.697**/0.809**
0.679**/0.723**
0.601 **/0.506** 0.702
**/0.619 **
0.748**/0.618**
0.705**/0.714**
0.834**/0 .695**
0.602**/0 .564**
0.623**/0.608**
0.526**/0.781**
0.609**/0.581**
0.963 **/0.894** 0.909
**/ 0.728
**
0.746**/0.586**
0.885**/0.845**
0.667 **/0.589**
0.161**/0.256**
0.183**/0.268**
0.235**/0.495**
0.197**/0.326**
0.218**/0.204**
0.212**/0.246**
0.336**/0.529**
0.146**/0.228**
0.179**/0.291**
0.179**/0.172**
0.165**/0.341**
0.368**/0.485**
0.316**/0.395**
0.527**/0.340**
0.328**/0.410**
0.020*/0.062**
0.108**/0.218**
0.154**/0.289**
0.059**/0.081**
0.295**/0.385** 0.216**/0.420**
0.232**/0.795**
0.531**/0.465**
0.174**/0.117** (R2 =0.768/0.205 )
(R2 =0.469/0.535 )
(R2 =0.826/0.883 )
Note: 1 (** p < .01, * p < .05, 2) R2 = reliability, 3) Standardized coefficients are shown in the model, 4) Numeric order: Full Questionnaire Model/Split
Questionnaire Model 4. Conclusion and Recommendations
The objectives of this study were to validate self-discipline for good citizenship measurement model and to test model form and parameters invariance between the models using the data from the full questionnaire and the model using the MMS length reduction questionnaire. The findings showed that measurement model is congruence with empirical data and some parameters were different or variance across both of model form and parameters in the model.
The findings indicate that the measurement model is still explained by four key components, based on twenty observable variables. These together form the bigger measurement structure and they have the construct validity whether consider the long-length questionnaire or the reduced short-length questionnaire in accordance with MMS technique. Moreover, the data analysis revealed the significance of MMS technique application to reduce the length of questionnaire.
Based on the observations of the parameters invariance test with the factor loadings as the first step shows that seven transformational parameters occur when the questionnaire is split into two types: 1) two values are invariance occurring when using measuring only one item per one observable variable (balanced 1:1); 2) the remaining invariance values occurring in the case of use more than one item per an observed variable and employ unequal items or unbalanced item to measure one observed variable, such as 1:2, 2:1, or 3:2, 2:3. The two sets of questions have the greatest variability. There are no variants of 2:2 matching sets of item, as well as unequal sets in case there are more than three sets, such as 5:6.
The important reasons that can be used to explain the causes of parameter variation, but ultimately the measurement model is still consistent are: (i) the reduction of questions is to decrease ability of the instrument to measure reliability. Paynr [31] describes the use of questionnaires to collect a small amount of data affecting inconstant the parameter estimation, (ii) splitting the set of questions that combine to measure variables according to the same definitions is separate to each other. As a result, there is the same observable variable in measurement, but it is a different issue, particularly the observed variables with the fewer questions for measuring. Wiesma and Jurs [41] argue that the design of measurement questions with similar semantic meanings results in an increased trend of reliability value,
(
iii) stratified random sampling of questions contributes to the distribution of items in the hypothesis model in both sets of data. Each set contains data for all observable variables even there are different issues, but it is still in the same definition of terminology in line with the recommendations of van De Linden et al [43], which describes the use of BIBs to collect educational data. It should be emphasized that random block design should be used for querying booklets. The number of blocks should be assigned to each booklet. The number of booklets should be assigned to each block aswell. However, this research is different from the van Der Linden et al.’s concept that there is no design of the questions’ number between the questionnaire and the block equally. Because of the definition of observable variables has a different scope. As a result, each block is created in a different number of questions. The questionnaire may be divided into the same numbers or not. It also refers to as the Unbalanced Incomplete Block Design (UIB), which is unique and suitable for use in reducing the length of the questions in the SEM research with the use of latent variables, (iv) using the MMS technique to split the questions is a technique to reduce the number of questions that differ from the method of dividing the questionnaire based on parallel form. Although the number of questions is decreased, the data returned will not merge answers to analyze based on the hypothesis. There are 4 mentioned reasons for this. As a result, there is the variation of the parameters even the hypothetical model still fits into the empirical data. However, some of the predicted answers lacked support from other research, as the number of studies in the MMS application in the analysis of the structural equations model is still limited.
The conclusion of this study has not had the context effect and boredom effect suggested by Shoemaker [37], Rolstad et al [33], and Sinder et al [38] since there was no difference between the data collectors and the length of the questionnaire among each student. The set of answers was organized after the complete information before using the data obtained randomly. Although most of the results of parameter estimation from data model based on full questionnaire had higher than the model gaining the data from MMS, both of models the form of using or not using the answers of each data provider is random. Although the majority of the parameter estimation results from the data model from the complete questionnaire were higher than those using MMS data, both models obtained consistent and statistically significant results. Moreover, most of the gained values were slightly different from the estimation results. If the gained parameters are brought to study the relationship, it will show that the correlation coefficient between the parameter estimation results from the inter-group model was positively correlated at the high level
(
rxy=0.996). Significantly, the major variation in the measurement parameters was found in the estimation of measurement errors (H1-H6) rather than in the estimate of factor loadings showing half of variation (H7-11) of the total number of parameters has been estimated.analysis context. It had the proof with the consistency that the model analyzed by MMS technique had the better validity than the complete questionnaire [16]. It can be observed from the contribution of Chi-square in accordance with the model of MMS model which was lower than that of traditional model from the analysis before and after modifying. This difference is expected to be clearer If the question form is completely used before the actual data is collected and when the questionnaire is longer than this including open questions in the questionnaire because of the chance of fatigue effect or boredom occurrence truly. In consequence, the use of MMS for data collection for research has begun to provide more evidence of efficacy. There are still some aspects that are still waiting for proof in the future. However, there is a weight to consider when compared to the use of the full-length tool, which results in failure to recover or to obtain inaccurate information. This leads to the conclusion of the research that is incorrect.
In conclusion, the results of MMS research can be used to collect data in the SEM research. The important process is to design a questionnaire to measure two or more observable variables after the booklet is made. It should be divided into balanced items. The use of data is more similar to the use of data from the complete questionnaire. For example, in the questionnaire divided into three booklets should use the number of items for the measurement of each observable variable including six
items (2: 2: 2 or two for each booklet). The researchers may use the number of questions to measure unbalanced items in the case of the remaining number of questions. After setting each booklet, there are more than three items in each issue (eg 3: 4: 3 or 4: 4 : 5), but should not have too many numbers. Moreover, questions should be organized into booklets with the use of stratified random sampling by using strata of observed variables, it will increase the probability distribution of the content of the variables according to the conceptual framework of the research.
The researcher reiterated that the knowledge about the application of MMS in the SEM research is still limited in a present day. The results of this study are only some part of knowledge in the scope of study and explain the measurement of large scale structure. It is not intended to predict or study the influence of variables. With, structural equation modeling, there are also many types of data analysis techniques with the specific data for specific data that can be tested efficacy in the future.
Acknowledgements
Appendix
Table 3. Descriptive statistics and correlation matrix of observed variables
Factors Observed Variables Responsibility Honesty Rule Endurance Split
A1 A2 A3 A4 A5 A6 A7 A8 B1 B2 C1 C2 C3 C4 C5 C6 C7 D1 D2 D3 Mean SD
Responsibility
A1 - 0.41 0.32 0.41 0.37 0.35 0.32 0.33 0.17 0.18 0.26 0.20 0.20 0.19 0.15 0.33 0.24 0.35 0.39 0.33 3.93 0.66
A2 0.49 - 0.37 0.47 0.32 0.43 0.31 0.43 0.16 0.14 0.31 0.16 0.19 0.23 0.09 0.28 0.18 0.29 0.42 0.25 3.56 0.65
A3 0.50 0.53 - 0.39 0.33 0.21 0.28 0.21 0.14 0.11 0.24 0.13 0.18 0.12 0.09 0.28 0.16 0.45 0.31 0.33 3.69 0.83
A4 0.50 0.57 0.56 - 0.35 0.47 0.42 0.37 0.16 0.14 0.25 0.14 0.14 0.15 0.12 0.26 0.16 0.31 0.35 0.33 3.65 0.70
A5 0.49 0.43 0.48 0.49 - 0.31 0.29 0.28 0.17 0.18 0.32 0.26 0.28 0.21 0.28 0.42 0.34 0.33 0.38 0.25 4.02 0.77
A6 0.43 0.50 0.45 0.60 0.47 - 0.38 0.45 0.15 0.17 0.28 0.12 0.12 0.17 0.08 0.29 0.17 0.23 0.45 0.33 3.64 0.72
A7 0.43 0.42 0.40 0.50 0.41 0.56 - 0.31 0.11 0.09 0.25 0.14 0.15 0.16 0.15 0.29 0.18 0.29 0.31 0.31 3.72 0.85
A8 0.44 0.51 0.45 0.47 0.41 0.49 0.43 - 0.19 0.19 0.35 0.18 0.17 0.22 0.14 0.36 0.21 0.30 0.50 0.29 3.70 0.61
Honesty B1 0.41 0.42 0.38 0.42 0.41 0.41 0.37 0.50 - 0.45 0.17 0.16 0.18 0.18 0.15 0.20 0.15 0.13 0.23 0.14 3.89 0.69
B2 0.40 0.33 0.36 0.35 0.48 0.31 0.32 0.36 0.53 - 0.25 0.24 0.25 0.21 0.21 0.25 0.21 0.17 0.24 0.14 4.04 0.59
Rule
C1 0.34 0.36 0.35 0.33 0.40 0.34 0.31 0.40 0.39 0.58 - 0.43 0.42 0.37 0.40 0.44 0.36 0.28 0.39 0.27 4.05 0.81
C2 0.25 0.18 0.23 0.19 0.37 0.14 0.19 0.20 0.33 0.62 0.51 - 0.61 0.45 0.57 0.49 0.43 0.22 0.31 0.18 4.42 0.84
C3 0.27 0.21 0.24 0.20 0.39 0.16 0.19 0.22 0.35 0.65 0.51 0.76 - 0.49 0.66 0.53 0.45 0.28 0.35 0.23 4.44 0.79
C4 0.22 0.26 0.21 0.17 0.27 0.16 0.19 0.22 0.31 0.49 0.44 0.52 0.59 - 0.46 0.41 0.32 0.24 0.36 0.17 4.22 0.93
C5 0.22 0.12 0.16 0.14 0.37 0.11 0.17 0.16 0.32 0.63 0.46 0.69 0.74 0.55 - 0.55 0.48 0.24 0.33 0.20 4.51 0.79
C6 0.42 0.32 0.37 0.34 0.53 0.33 0.34 0.38 0.43 0.61 0.52 0.58 0.61 0.48 0.63 - 0.63 0.46 0.53 0.36 4.28 0.56
C7 0.31 0.19 0.25 0.21 0.44 0.19 0.23 0.22 0.33 0.53 0.43 0.53 0.56 0.38 0.59 0.72 - 0.35 0.41 0.28 4.43 0.68
Endurance
D1 0.49 0.43 0.50 0.47 0.43 0.41 0.39 0.49 0.42 0.41 0.39 0.29 0.31 0.32 0.27 0.51 0.42 - 0.50 0.43 3.96 0.66
D2 0.51 0.49 0.49 0.48 0.50 0.47 0.42 0.54 0.51 0.50 0.45 0.36 0.43 0.41 0.38 0.59 0.47 0.66 - 0.51 3.99 0.53
D3 0.43 0.30 0.39 0.39 0.33 0.40 0.40 0.38 0.34 0.35 0.31 0.22 0.25 0.20 0.21 0.39 0.31 0.50 0.60 - 3.94 0.77
Full Mean 3.94 3.58 3.77 3.66 4.03 3.62 3.73 3.70 3.89 4.20 4.06 4.43 4.44 4.22 4.51 4.29 4.43 3.94 3.96 3.93
REFERENCES
[1] F. Adigüzel, M. Wedel. Split Questionnaire Design. Working paper Number 966. Retrieved on July 17 2017 from http://ssrn.com/abstract=911267, 2005.
[2] F. Adigüzel, M. Wedel. Split questionnaire design for massive survey. Paper presented in The 59th ISI World Statistics Congress, 25-30 August 2013, Hong Kong. [3] H. H. Blumberg, C. Fuller, A. P. Hare. Response rates in
postal surveys. Public Opinion Quarterly, 38, 113-123, 1974.
[4] K. Bogen. The effect of questionnaire length on response rates–A review of the literature. Proceedings of the Section on Survey Research Methods, American Statistical Association, 1020–1025, 1996.
[5] B. M. Bryne. Structural Equation Modeling with Mplus. New York: Routledge, 2012.
[6] G. W., Cheung, R. B. Rensvold. Evaluating goodness of fit indexes for testing measurement invariance. Structural Equation Modeling, 9, 233-255, 2002.
[7] C. Geiser. Data Analysis with Mplus. New York: The Guilford Press, 2010.
[8] M
.
S.
Gilliom, D.
S.
Beck, J.
A.
Schonberg, A.
Michael, E.
L.
Lukon. Anger Regulation in disadvantaged preschool boys:
Strategies, antecedents and the development of self-
control.
Development Psychology 2002.
Mar, 38(2),
222-
35, 2002. [9] J. M. Gonzalez. J. L. Eltinge. Multiple matrix sampling: Areview. Proceedings of the Section on Survey Research Methods, American Statistical Association, 3069–3075, 2007.
[10]E. Gonzalez, L. Rutkowski. Principles of multiple matrix booklet designs and parameter recovery in large-scale assessments. IERI Monograph Series: Issues and Methodologies in Large-Scale Assessments, 3, 125-156, 2010.
[11]A. Gorbunovs, A. Kapenieks, S. Cakula. Self-discipline as a key indicator to improve learning outcomes in e-learning environment. Procedia–Social and Behavioral Sciences, 231, 256-262, 2016.
[12]J. F. Hair, W. C. Black, B. J. Babin, R. E. Anderson. Multivariate Data Analysis: A Global Perspective (7th ed). NJ: Pearson Education Inc, 2010.
[13]M. Hecht, S. Weirich, T. Siegle, A. Frey. Modeling booklet effects for nonequivalent group designs in large-scale assessment. Educational and Psychological Measurement, 75(4), 568-584, 2015.
[14]R. A. Herzog, J. G. Bachman. Effects of questionnaire length on response quality.The Public Opinion Quarterly, 45(4), 549-559, 1981.
[15]L. Hu, P. M. Bentler. Cutoff criteria for fit indexes in covariance structure analysis: Conventional criteria versus new alternatives. Structural Equation Modeling, 6, 1-55, 1999.
[16]P. Jaikaew, S. Damrongpanit. Effects of reducing the length of questionnaire by multiple matrix sampling on the validity of structural equation modeling for factor affecting job morale. Universal Journal of Educational Research, 6(7), 1546-1562, 2018.
[17]C. Jenkinson, A. Coulter, R. Reeves. Properties of the Picker Patient Experience questionnaire in a randomized controlled trial of long versus short form survey instruments. Journal Public Health Med, 25, 197–201, 2003.
[18]K. G. Jöreskog. Simultaneous factor analysis in several populations. Psychometrika, 36, 409-426, 1971.
[19]E. K. Kelloway. Using Mplus for Structural equation modeling: A researcher’s Guide (2nd ed.). CA: Sage Publication, 2015.
[20]B. J. Kelly, T. K. Fraze, R. C. Hornik. Response rates to a mailed survey of a representative sample of cancer patients randomly drawn from the Pennsylvania Cancer Registry: a randomized trial of incentive and length effects. BMC Med Res Methodol, 10- 65, 2010.
[21]D. Kleinke. The accuracy of estimated total test statistics. Washington, DC: National Center for Educational Research and Development, 1972.
[22]R. B. Kline. Principles and Practice of Structural Equation Modeling (3rd ed). New York: The Guilford Press, 2011. [23]R. L. Kohr. An Evaluation of a multiple matrix sampling
procedure for a state assessment program. Paper presented at the Annual Meeting of the National Council on Measurement in Education, San Francisco, California, 1976. [24]A. I. Kraut, A. D. Wolfson, A. Rothenberg. Some effects of position on opinion survey items. Journal of Applied Pyschology, 60, 774–776, 1975.
[25]X. Liang. An Empirical examination of a modified matrix sampling procedure as an evaluation tool for grades 7 to 12 in a midwestern school district. Evaluation & Research in Education, 17(1), 1-5, 2003.
[26]A. Lohbeck, J. Schultheiß, U. Petermann, F. Patermann. Factor structure and measurement invariance of the students’ self-report checklist of social and learning behavior. Learning and Individual Differences, 51, 314-321, 2016. [27]E. R. Misanchuk. Multiple matrix sampling applied to needs
analysis: An introduction and assessment of efficiency. Paper presented at the Adult Education Research Conference, Minneapolis, Minnesota, 1977.
[28]J. M. Mond, B. Rodgers, P. J. Hay, C. Owen, P. J. V. Beumont. Mode of delivery, but not questionnaires length, affected response in an epidemiological study of eating-disordered behavior. Journal of Clinical Epidemiology, 57(11), 1167-1171, 2004.
[29]N. J. Myerberg. The effect of item stratification in multiple-matrix sampling. Paper presented at the annual meeting of the American Educational Research Association, Washington, DC, 1975.
[30]T, D. Pigott. A review of methods for missing data. Educational Research and Evaluation, 7(4), 353-383, 2001. [31]D. A. Payne. Measuring and Evaluating Educational
[32]N. M. C. Rodrigues, K. I. Beltrão. A split questionnaire survey design applied to Brazilian census. Paper presented at International Union for the Scientific Study of Population, XXV International Population Conference Tour, France, July 18-23, 2005.
[33]S. Rolstad, J. Adler, A. Rydén. Response burden and questionnaire length: Is shorter better? A review and meta-analysis. Journal of Value in Health, 14,1101-1108, 2011.
[34]R. Rothstein. Towards a composite index of school performance. The Componentary School Teacher, 100(5): 409–441, 2000.
[35]R. E. Schumacker. R. G. Lomax. A Beginer’s Guide to Structural Equation Modeling (3rd ed.)
.
NY: Routledge, 2010.[36]D. M. Shoemaker. Principles and Procedures of Multiple Matrix Sampling (Report No. SWRL-TR-34). Inglewood, CA: Southwest Regional Educational Lab, 1971.
[37]D. M. Shoemaker. Principles and Procedures of Multiple Matrix Sampling. Cambridge, MA: Ballinger Publishing, 1973.
[38]R. Sindre, A. John, R. Anna. Response Burden and Questionnaire Length: Is Shorter Better? A Review and Meta-analysis. Value in health, 14(8), 1101-1108, 2011. [39]N. Smits, H. C. M. Vorst. Reducing the length of
questionnaires through structurally incomplete design: An illustration. Learning and Individual Differences, 17(4), 25-34, 2007.
[40]N. Thomas, T. E. Raghunathan, N. Schenker, M. J. Katzoff, C. L. Jhonson. An evaluation matrix sampling methods using data from the national health and nutrition examination survey. Survey Methodology, 32, 217-231, 2006.
[41]W. Wiersma, S. G. Jurs. Educational Measurement and Testing. MA: Allyn and Bacon, 1985.
[42]F. J. Yammarino, S. J. Skinner, T. L. Childers. Understanding mail survey response behavior: A meta-analysis. Public Opinion Quarterly, 55, 613-639, 1991. [43]W. J. van der Linden, B. P. Veldkamp, J. E. Carson. Optimizing balanced incomplete block designs for educational assessments. Applied Psychological Measurement, 28, 317-331, 2004.