OPTIMISATION OF PROCESSING CONDITION USING TAGUCHI
METHOD ON STRENGTH OF HDPE- NATURAL FIBRES MICRO
COMPOSITE
M.H.I. Ibrahim
1, a *,
M.Z.R. Zainol
1,b *,
M.H. Othman
1,c,A.M. Amin
1, d,
R. Asmawi
1,e, N. Sa’ude
1,f,
1
Faculty of Mechanical & Manufacturing Engineering, Universiti Tun Hussein Onn Malaysia (UTHM), Batu Pahat, Malaysia
a
*[email protected], [email protected], [email protected], d
[email protected], [email protected], [email protected]
Keywords: Taguchi Method, processing condition, strength, natural fibres.
Abstract. Injection molding is probably the most important method of processing of consumer and industrial goods, and is performed everywhere in the world. In this paper, Taguchi Methods was used to define the optimization of process parameter for an injection molding machine to produce a dumbbell product from High-density Polyethylene (HDPE) + natural fiber (Kenaf). Taguchi Methods with L9-34 approaches will be used in this work where two different formulation of material will be tested to find the best formulation and its parameter setting. Here, an orthogonal array (OA) and signal-to-noise (S/N) ratio are employed to analyze the effect of injection molding parameter. The significant of formulation and parameter setting from injection molding will be evaluated through the strength value of the specimen. Standard ISO R527-2 test method will be used. Results show that changes in the parameter setting will give different tensile strength value. The optimum parameter setting was set based on the S/N ratio. For each formulation, optimum parameter setting has been achieved by using highest mean S/N ratio and it can be calculated manually or by using Minitab software.
Introduction
Experiment
[image:2.595.194.418.147.272.2]This experiment will consist of quality of part and the optimum parameter setting by determining their S/N ratio and their percentage of contribution. To find the percentage of contribution is by using ANOVA. The injection moulding machine used for this experiment is Nissei NP7-1F type as displayed in Figure 1.
Figure 1: Injection moulding machine Nissei NP7-1F type
Material Selection
The material used in this research was High Density Polyethylene (HDPE). The second material is kenaf. HDPE and kenaf will be mix together. Table 1 shows the general properties of HDPE.
Table 1 : Properties of HDPE
Properties
Hardness, Shore D
Tensile Strength, Ultimate Tensile Strength, Yield
Elongation at Break Melting Point
Vicat Softening Point
Brittleness Temperature Density
62 30 MPa 21.9 MPa 840 130°C 120°C -86.2°C 0.948 g/cc
Selection of Cavity Shape
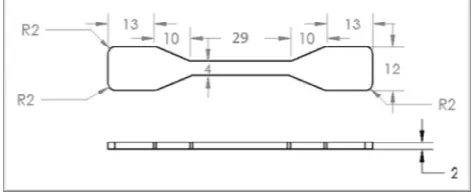
The shape chosen for the mould cavity in this research was dumbbell shape. Figure 2 shows the dumbbell shape and its dimension based on International Organization for Standardization, ISO R527-2.
Figure 2: Cavity of dumbbell (dimension in mm)
Selection of Factors and Levels. [image:2.595.183.420.619.716.2]
Table 2 : Factor and level selection
Factors Level 1 Level 2 Level 3 Melt Temperature (˚C) 135 163 190 Injection Speed (%) 20 40 60 Injection Pressure (%) 30 50 70
Cooling Time (s) 3 5 7
[image:3.595.83.511.175.355.2]
Table 3 : Values of Orthogonal Array
Factor
Experiment
Injection Moulding Parameter Level
A B C D
Melting Temperature, °C Injection Speed, % Injection Pressure, %
Cooling Time, s
1 135 20 30 3
2 135 40 50 5
3 135 60 70 7
4 163 20 50 7
5 163 40 70 3
6 163 60 30 5
7 190 20 70 5
8 190 40 30 7
9 190 60 50 3
Measuring Strength
The strength of specimens was measured by using Universal Testing Machine (UTM). It has 10kN capacity and its crosshead speed range is 1000mm/min. The procedure for measuring tensile test of injection-moulded parts was according to ISO R527-2 test method. The strength for every experimental specimen was defines by record the readings of ultimate tensile strength or maximum stress values [5].
Result and Discussion
In the result, it is focusing in the strength of the specimen for each parameter and formulation. Using S/N ratio, the quality of the specimen can be determined [1]. In this result, the correlation of the parameter and the S/N ratio value was plotted in a Figure 3. For the analysis, the most contribution parameter can be determined. The contribution of the parameter was base on the higher percentage of contribution. This percentage contribution was calculated for all formulation. The analysis of tensile strength shows significant changes & robustness. The interaction between each parameter also show significant correlation as it intersects between the line. The S/N ratio was calculated to see the parameter level that have significant value in order to get the optimization parameter.
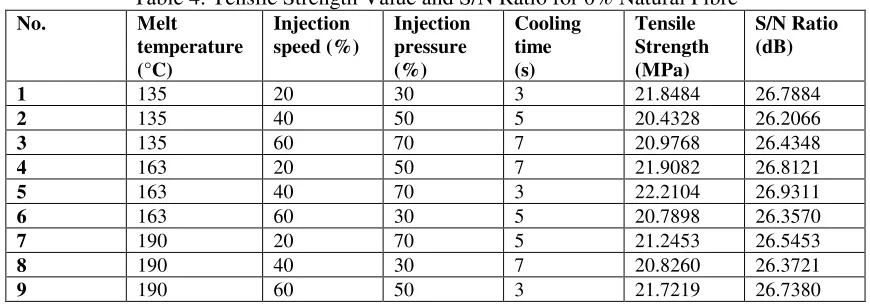
Table 4: Tensile Strength Value and S/N Ratio for 0% Natural Fibre
No. Melt temperature (°C) Injection speed (%) Injection pressure (%) Cooling time (s) Tensile Strength (MPa) S/N Ratio (dB)
1 135 20 30 3 21.8484 26.7884
2 135 40 50 5 20.4328 26.2066
3 135 60 70 7 20.9768 26.4348
4 163 20 50 7 21.9082 26.8121
5 163 40 70 3 22.2104 26.9311
6 163 60 30 5 20.7898 26.3570
7 190 20 70 5 21.2453 26.5453
8 190 40 30 7 20.8260 26.3721
[image:3.595.80.515.640.792.2]Table 5: Tensile Strength Value and S/N Ratio for 3% Natural Fibre
No. Melt temperature (°C)
Injection speed (%)
Injection pressure (%)
Cooling time (s)
Tensile Strength (MPa)
S/N Ratio (dB)
1 135 20 30 3 20.9229 26.4124
2 135 40 50 5 21.6140 26.6947
3 135 60 70 7 22.4190 27.0123
4 163 20 50 7 21.3013 26.5681
5 163 40 70 3 22.4497 27.0242
6 163 60 30 5 20.9577 26.4269
7 190 20 70 5 20.7557 26.3427
8 190 40 30 7 20.6375 26.2931
9 190 60 50 3 21.8869 26.8037
Based from Table 4 and 5, it show a small different value of S/N ratio between 0% and 5% kenaf. Probably it happened because the kenaf fibre has been blend and crush in order to make it injectable. Hence, the strength of kenaf is decreasing as it did not contains long fiber for reinforcement. The different was illustrated in the graph for average S/N ratio versus the level of parameter for four different parameters.
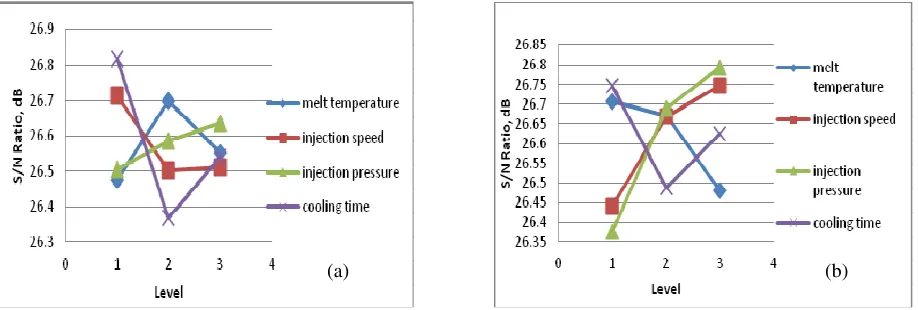
[image:4.595.71.530.332.487.2]
Figure 3: Graph Average S/N Ratio vs Parameter Level for Strength for 0%(a) & 3%(b) of natural kenaf fibre
The S/N ratio of each interaction in Figure 3 is come from Table 4 and 5 where it clearly shows that A2 B1 C3 D1 and A1 B3 C3 D1 were the highest mean S/N ratio. Hence, the optimum
[image:4.595.155.442.657.713.2]performance parameter can be achieved as it comes from the highest mean S/N ratio[6,7]. .From Figure 3, the optimum parameter for each formulation can be determined based from the highest mean S/N ratio. Table 6 shows the optimum parameter for green strength for each formulation.
Table 6 : Optimum Parameter for Strength
Percentage of natural fiber Optimize parameter
setting
0% A2 B1 C3 D1
3% A1 B3 C3 D1
From the results, the value of strength was increasing moderately with the percentage of kenaf fibre. The higher prediction value of S/N ratio of strength is 27.1431dB which is at 3% formulation of kenaf fibre with the optimum parameter setting is A1 B3 C3 D1.
Conclusion
Taguchi’s orthogonal array is designed to improve the quality of products and very helpful in determining the importance of variables when optimising a quality characteristics, in this case the green strength. From the analysis, the parameters that shows significant are melt temperature (A), injection speed (B), injection pressure (C) and cooling time(D). The most significant parameter is melt temperature as it contributes the highest contribution percentage followed with injection pressure. From the results, it shows that increasing the percentage of kenaf fibre will not give better shape retention and strength value as the different is too small compare with 100% HDPE or in other words 0% kenaf fibre.
References
[1] M.H.I. Ibrahim, N. Muhamad,A.B. Sulong . “Rheological characterization of water atomised stainless steel SS316L for micro MIM”. Advanced Materials Research (2011)264-265,pp129-134 [2] Kamaruddin. S., Zahid A. K., Wan K.S (2004). The Use of Taguchi Method in Determining the Optimum Plastic Injection Moulding Parameters for the Product of a Consumer Product. Jurnal Mekanikal, 18. Page 98-110.
[3] M.H.I. Ibrahim, N. Muhamad,A.B. Sulong,N.H.M. Nor. “Optimization of micro metal injection molding with multiple performance characteristics using grey relational grade” Chiang Mai Journal of Science(2011) 38(2), pp231.
[4] Naurah (2005). Injection Moulding Parameter and Performance of Rice Husk-High Density Polyethylene Composite. Universiti Teknologi Malaysia. Master theses.
[5] Druta C. (2003). Tensile Strength and Bonding Characteristics of Self-Compacting Concrete. Louisiana State University. Master theses.