AN ANALYTIC HIERARCHY PROCESS APPROACH
FOR SUPPLIER SELECTION: A CASE STUDY
Rohaizan Ramlan and Lee Wen Qiang
Department of Production and Operation Management, Universiti Tun Hussein Onn Malaysia
86400 Batu Pahat, MALAYSIA.
Abstract :Supplier selection is a complex problem involving qualitative and quantitative multi-criteria. A trade-off between these tangible and intangible factors is essential in selecting the best supplier. In this study, an AHP-based supplier selection model applied to improve and assist decision making to resolve the supplier selection problem in choosing the optimal supplier combination. There are four criteria in determining an optimal supplier, which are price, quality, logistic, and service. Information is obtained from the interview, interpreted into simple form and analysed using Microsoft Excel. These data calculated using Pairwise comparison. It is considered to be adequately consistent if the corresponding consistency ratio (CR) is less than 0.1 (<10%) A value of less than 0.1 is good, but the threshold of 0.1 is the rule of thumb. Among three suppliers, supplier C has the highest performance of overall attributes, followed by supplier B and supplier A. Supplier C perform best on two criteria logistic and service, supplier B perform best towards price and supplier A perform best on price.
Keywords: Analytic Hierarchy Process (AHP), Supplier Selection.
1. Introduction
nt to the success of any manufacturing organization to create and increase competitive advantages (Liu and Hai, 2005), One of the strategies preferred is a strategy of few dedicated suppliers that have a long-run communication (Chandra and Kumar, 2000). Advantages for having few relative suppliers can create value to the buyer and be able to produce both lower transaction and production costs (Koh et al., 2007).
Choosing the right supply chain and synchronizing through collaborative design are critical factors to achieve supply chain effectiveness and efficiency (Anderson, D. L. and Lee, 2000). Often, selecting the suitable supplier is always hard for buyers. Suppliers have varied strengths and weaknesses, which require careful assessment by the purchasers before ranking, can be given to them. Usually the considerable aspect of the purchasing function is supplier selection criteria. Vendor selection process could be simple if and only if one criterion was used in the decision making process. However in many situations, purchasers have to into consideration of a range of criteria in making their decisions. If few criteria are used then it is necessary to determine how far for each criterion influences the decision making process, whether if all are to be equally weighted or by chances the influence varies accordingly to the type of criteria (Yahya & Kingsman, 1999). Seamlessly, the lack of metrics or inappropriate metrics for evaluating performances may hinder further improvement of supply chain performance.
A short interview with the company revealed that, the company is often troubled with which supplier to select. There are a lot of decision to reconsider upon receiving a project from customer, different suppliers has different value to the company. Careful assessment had to be given to make sure both party comes to a win-win situation. Any wrong choices will influence the decision making, misleading the company to bad reputation and financial damage. Thus this research is to identify potential supplier for various outsourced components to meet its supplier selection criteria based on AHP.
2.
Material and Methods
This study has used the data collected from a manufacturing factory specialized in factory automation facilities, conveyor systems, lifting equipment, automatic warehousing, and automatic sorting systems. Currently the company has been exporting to Singapore, Indonesia, Thailand, Vietnam and Philippines. There are a lot of products produced from the company. The study focused on sensor product only.
In the operations management, major in supply chain management literatures, the majority of studies focus on the purchasing of manufactured goods or raw materials (Ellram et al., 2004). Generally, one important stage in the decision making process for organizational purchasing is to determine the decision criteria against which of the potential service providers to be assessed.
2.1 Supplier Development
Studies of academic literature shows in this area of concern have a way long history in North America. Doctoral dissertation concerning this domain has published as early as back 1965 (Leenders, 1965). Soon after Leenders (1966) article reports on the supplier development activities in Canada industrial firm, years later when the business environment starting to pay more attention on quality management issues, supplier development appears as a prominent method.
Krause, et al. (1998) described it into a collective of ten-step approach from identification of critical commodities for development to the systematic and continuous improvement. Direct supplier development involves activities such as on-site consultation, education and training programs, temporary capital (Krause, 1997; Krause et al., 2000; Monczka et al., 1993). Despite, direct supplier development still posit problems concerning the potential for opportunistic behavior on behalf of the supplier. Thus, the firm must defend its investment-specific supplier by establishing long-term relationships.
2.2 Supplier Selection
For the last few decades, supplier performance measurement has been an important research area for researchers as well as practitioners (Giannakis, 2007; Ryu et al., 2009). In the current business nature, suppliers are playing an important role in improving the competitiveness and efficiency of supply chains (Park et al., 2010).
Formerly, buyers used to evaluate the performance of suppliers (Slobodow et al., 2008). But things were different, now the evaluation of supplier alone is not sufficient enough to improve the performance and to build a long-term relationship (Cousins et al., 2008). Essig and Amann (2009) have mentioned that without measuring supplier selection, it is very difficult to maintain successful buyer-suppliers relationships.
source is accepted in, requests for quotations are sent out, negotiations conducted, and specific suppliers percentage of purchased materials becomes vast (Benton and McHenry, 2010).
2.3 Analytic hierarchy process: a tool for multi-criteria decision analysis
(Pamerol & Romero, 2000). One if the most widely used MCDM approaches is the AHP and it has been successfully applied to many practical problems (Saaty, 2003). It also provides a well-founded and comprehensible solution which makes decisions creadible especially in teams or groups decision making
in supplier selection (Politis, et.al2010).
Essentially, AHP allows decision makers to measure the consistency in each judgment. Instead of requiring perfect consistency in judgment, AHP provides an acceptance tolerance level for the degree of inconsistency. This is especially suitable for complicated decision issues in which the large number of information (technical, social, environmental) aspects must be taken into consideration. It ascertains that the decision maker is reliable in rating the relative importance of the criteria.
AHP is used to determine the relative priorities weights to be assigned to different criteria and alternatives that characterize a decision (Lin and Yang, 1996). This method divides a complicated system under study into a constructive hierarchical system of elements. To proceed with this method, first it is necessary for the researcher to identify the qualitative and quantitative criteria of the company mainly focused on. With the available criterion next, the respondent weights each criterion using a rating
-ts of the criteria were determined using pairwise comparisons. Last, the optimal supplier will be selected after a stage of evaluation.
Although AHP has been used in many applications of the public and private sectors, Hartwich (1999) noted several limitations. One, AHP was criticized for not providing sufficient guidance about structuring the problem to be solved, forming the levels of the hierarchy for criteria and alternatives, and aggregating group opinions when team members are geographically dispersed or are subject to time constraints. Team members may carry out rating items individually or as a group. As the levels of hierarchy increase, so does the difficulty and time it takes to synthesize weights.
2.4 AHP model for Supplier Selection
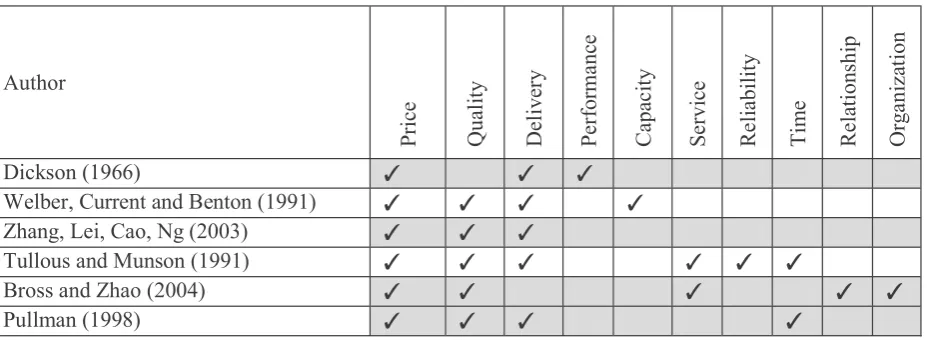
Various factors have been used as criteria for supplier selection including price, delivery performance, reputation in the industry, size of capacity, geographical location, quality, environmental compliance, lead-time, packaging, transportation storage, and product development. The details of the
[image:3.595.54.518.530.700.2]assessment criteria based on previous study are provided in Table 1.
Table 1 : Previous study on criteria for supplier selection
Meanwhile, the criteria that company applied for supplier selection is price, quality, logistic and service. Although the criteria selected is limited, it is important to purchasers have to take into account of a range of criteria in making their decisions (Farzad et. al., 2008). If limited criteria used, it is necessary
Author Pr ice Qu al ity De liv er y Pe rfo rm an ce Ca pa cit y Se rv ice Re lia bi lit y Ti m e Re lat io ns hi p Or ga ni za tio n Dickson (1966)
Welber, Current and Benton (1991) Zhang, Lei, Cao, Ng (2003)
to determine how far for each criterion influences the decision making process, whether if all are to be equally weighted or by chances the influence varies accordingly to the type of criteria (Yahya & Kingsman, 1999).
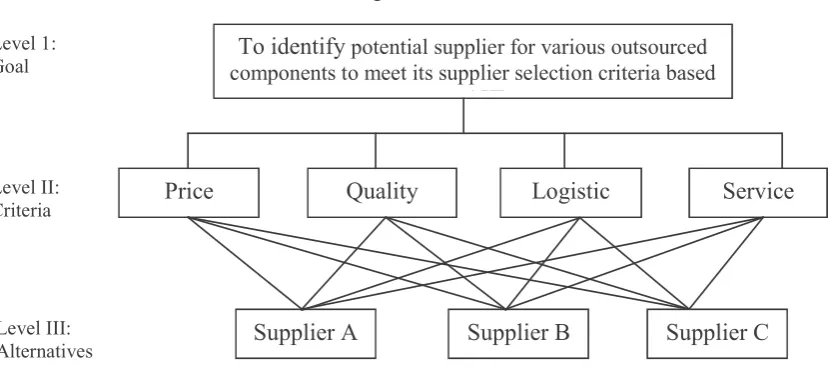
Figure 1 : AHP model
Figure 1 shows AHP model for this study that consists of there levels. At the top level is the goal of the model followed by criteria at level two, while various suppliers at the level three is an alternatives.
The goal of this study is to identify potential supplier for various outsourced components to meet its
supplier selection criteria based. The four criteria selected are price, quality, logistic and service. At the alternatives level, there are three suppliers to be evaluated in order to select best supplier.
2.5 Methodology
Interviews are one of the main instruments in this research where conversation is triggered between two or more people to obtain information from the interview. After the interview is conducted, all data are then analyzed using Microsoft Excel. All the primary data collected through the interview are then interpreted into understandable, easy and simple form. These data will be calculated using Pairwise comparison. It is considered to be adequately consistent if the corresponding consistency ratio (CR) is less than 0.1 (<10%) (Saaty, 1980) A value of less than 0.1 is good, but the threshold of 0.1 is the rule of thumb.
3. Result and Discussion
A four-point rating scale was designed, and priority weights of the criteria were determined using pairwise comparisons. The AHP evaluation process was conducted after interviewing two department managers of purchasing and engineering. A program written in Microsoft Excel has been
To identify potential supplier for various outsourced components to meet its supplier selection criteria based
on AHP
Price Quality Logistic Service
Supplier A Supplier B Supplier C
Level 1: Goal
Level II: Criteria
Table 2: Pairwise comparison matrix
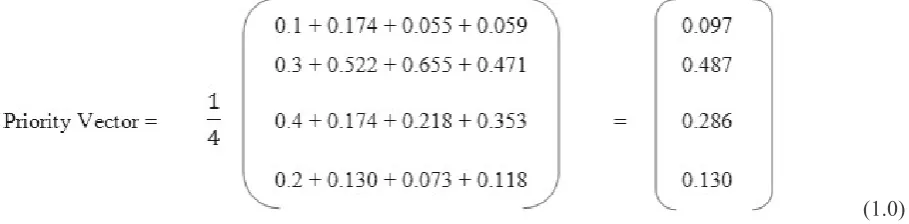
After obtaining the pair-wise judgments in table 2, the next step is the computation of a vector of priorities or weighting of elements in the matrix. In terms of matrix algebra, this consists of calculating the priority vector (eigenvector) of the matrix by adding the members of each column to find the total. In order to normalize each column to sum to 1.0 or 100%, divide elements of that column by the total of the column and sum them up.
Table 3: Normalized matrix
Finally, add the elements in each resulting row and divide this sum by the number of elements in the row to get the average. The results (priority vectors) are that the attributes have the following approximate priority weights: Price (0.097), Service (0.487), Quality (0.286), and Logistic (0.130) as shown in calculation 1.0.
(1.0)
The consistency ratio (Cr) is vital to test the level of acceptance. Using existing data in table 1
and priority vector calculation (1.0), the calculation of weighted sum for the four priority criterion is shown. Estimating the consistency ratio (Cr) as shown in calculation 1.1
[image:5.595.49.456.666.746.2]Lambda Max ( max) is the maximum eigenvalue of the matrix and it is needed in order to
calculate Consistency Index (CI). To find Lambda Max ( max), first dividing all the elements of the
weighted sum matrices by priority vector for each criteria.
(1.2)
Then compute the average of these values to obtain max
(1.3)
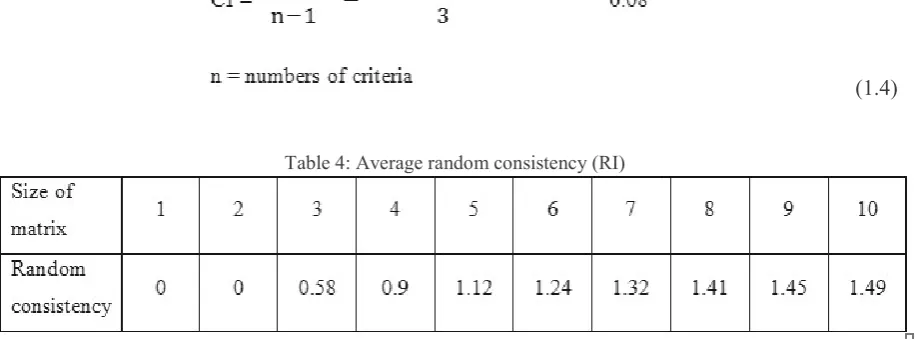
Due to the fact that pairwise comparisons are done in a subjective way, it is important that a consistency check is done. The calculation of the Consistency Index (CI) includes following calculation
[image:6.595.85.543.407.577.2](1.4)
Table 4: Average random consistency (RI)
Selecting an appropriate value of random consistency ratio (RI), for a matrix size (numbers of
criteria) of four using Table 4, R1 =0.9. Therefore the consistency ratio Cris as follows
(1.5)
As the value of Cris less than 0.1, the judgment is acceptable.
Evaluating the alternative suppliers according to the used model to select the best supplier is the next step. The pairwise comparison matrix of each alternative can be obtained through multiplying the global weights by the local weights of each alternative. The calculations of the global weights in relative to cost
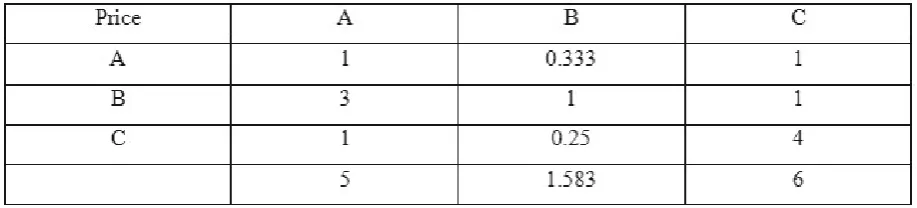
Table 5: Pairwise comparison matrix of three suppliers with respect to price
[image:7.595.54.513.265.369.2]Table 6 shows the weighted sum of pairwise comparison matrix indicated in Table 5. For example the weighted sum of column one is 5 follow by 1.583 and 6.
Table 6: Synthesizing judgments
In order to normalize each column to 1.0 or 100%, divide elements of that column by the total of the column and sum it up. Table 7 shows the normalized judgments of supplier A,B, and C.
Table 7: Normalized judgments
As shown before in evaluating the criterion, priority vector is necessary after normalization to calculate the weighting of elements in the matrix. Calculation is shown below:
Priority vector for the suppliers respect to price
Supplier A = (0.2 + 0.210 + 0.167) ÷ 3 = 0.192 Supplier B = (0.6 + 0.632 + 0.667) ÷ 3 = 0.633
Supplier C = (0.2 + 0.158 + 0.167) ÷ 3 = 0.175 (1.6)
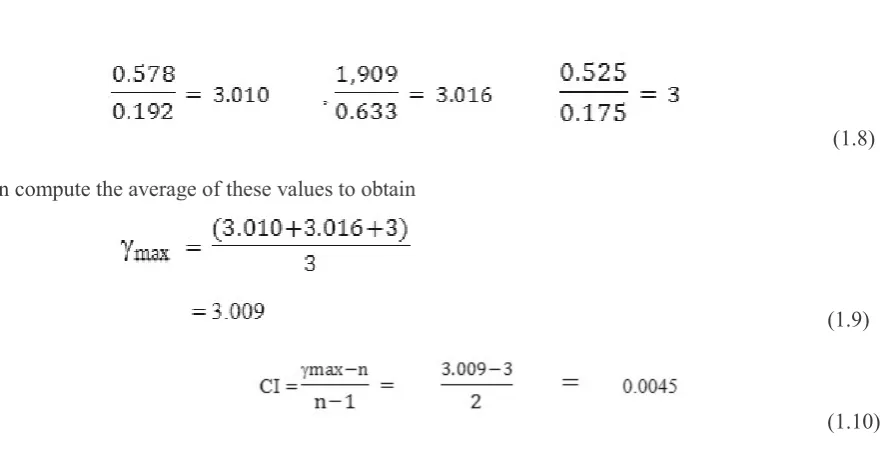
Estimating the consistency ratio (Cr)
(1.7)
(1.8) Then compute the average of these values to obtain
(1.9)
(1.10)
RI=0.58 for a matrix size of three, Consistency ratio (Cr) as follow
(1.11)
As the value of Cris less than 0.1, the judgments are therefore acceptable.
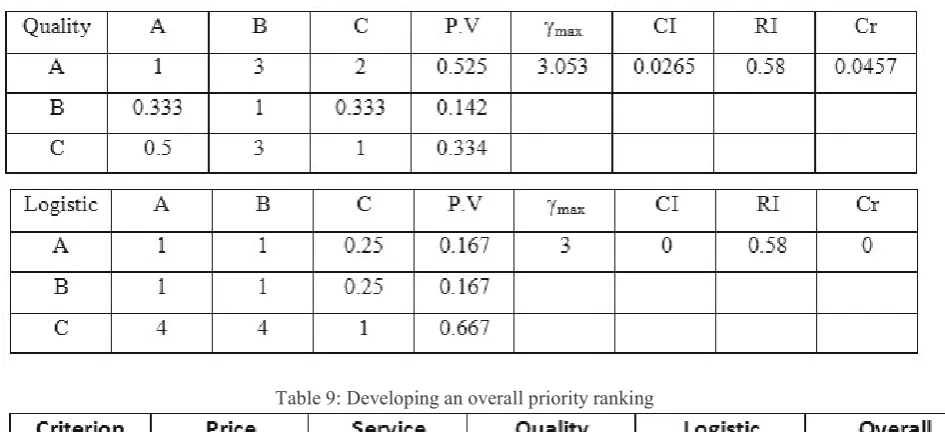
[image:8.595.99.542.77.305.2]Table 8 illustrates the priority of four criterion with respect to supplier A, B, and C.
Table 9: Developing an overall priority ranking
Based on global priority, weights of each alternative can be evaluated and summarized. The summaries of overall attributes are shown in Table 9. According to the AHP tools developed in this (0.203305).
Further analysis in Figure 2, shows details on each criteria performances. Supplier A perform best on price, supplier B perform best towards price and supplier C perform best on two criteria logistic and service. There is no suppliers that perform equally well on all four criteria.
[image:9.595.154.412.483.699.2]4. Conclusion
This study is to identify potential supplier for various outsourced components to meet its supplier selection criteria based on AHP. The criterias selected are; price, quality, logistic and service. There are three suppliers for the product Z. The finding shows none of the supplier perform equally well on all four criteria. Supplier A perform best on price, supplier B perform best towards price and supplier C perform best on two criteria logistic and service.
The main contribution of the work was the identification of the important criteria for the supplier selection process. Then a multi-criteria decision model for evaluating and selecting a supplier was developed. Once the criterias is identified, selection the right supplier will be much more convincing. This is because AHP makes smaller adjustment a decision maker may not consider. A small break-through may mislead the company to make wrong decision.
Acknowledgement
This research is supported by Ministry of Higher Education of Malaysia (MOHE), under Exploratory Research Grant Scheme (ERGS) to the Office of Research, Innovation, Commercialization and Consultancy (ORRIC), Universiti Tun Hussein Onn Malaysia. Grant number 045/phase I 2013.
References
Chandra, C. and Kumar, S. (2000). Supply chain management in theory and practice: a passing fad or a fundamental change?,
Industrial Management & Data Systems,100(3), 100-113.
Chua, Y. P. (2006). Research Method, Malaysia: McGraw-Hill Companies.
Ellram, L.M., Tate, W.L. and Billington, C. (2004). Understanding and Managing the Services Supply Chain, The Journal of Supply Chain Management: A Global Review of Purchasing and Supply, 40 (4), 17-32.
Farzad, T., Rasid, O., M., Aidy, A., Rosnah, M., Y., Alireza, E. (2008). AHP Approach for Supplier Evaluation and Selection in a Steel Manufacturing Company, Journal of Industrial Engineering and Management, 1(2), 53-76.
Giannakis, M. (2007). Performance Measurement of Supplier Relationships, Supply Chain Management: An International Journal, 12 (6), 400-411.
s
http://www.uni-hohenheim.de/i490a/dps/1999/09-99/dp99-09.pdf, accessed 15/11/2013).
Janker, C. G. (2008). Multivariate supplier assessment, Empirically based concept of a qualifying rating system, 2nd edition, Wiesbaden, p. 5.
Koh, S.C.L., Demirbag, M., Bayraktar, E., Tatoglu, E. and Zaim, S. (2007). The impact of supply chain management practices on performance of SMEs, Industrial Management & Data Systems, 107(1), 103-24.
Krause, D.R., Scannell, T.V. and Calantone, R.J. (2000). A structural Analysis of the Effectiveness of Buying F to Improve Supplier Performance, Decision Sciences, 31 (1), 33-55.
Lin, Z. and Yang, C. (1996). Evaluation of machine selection by the AHP method, Journal of Materials Processing Technology, Vol 57, 253-258
Liu, F.H. and Hai, H.L. (2005). The voting analytic hierarchy process method for selecting suppliers, International Journal of Production Economics, 97(1), 308-317.
Politis, S.,Klumpp, M. and , Celebi, D. (2010). Analytical Hierarchy Process in Supplier Evaluation, 16th International Working
Seminar on Production Economics, Conference Proceedings, Innsbruck 01.-05.03.2010, Innsbruck (Eigenverlag), Vol. 3, p. 411-424
Ryu, I., So, S. and Koo, C. (2009). The Role of Partnership in Supply Chain Performance, Industrial Management & Data Systems, 109 (4), 496-514.
Saaty, T.L. (1986). Axiomatic Foundations of the Analytic Hierarchy Process, Management Science, 32 (7), 841-855.
Sekaran, U. (2003). Research Methods for Business: A Skill Building Approach, New York: John Wiley and Sons Incorporated, 4(1), 327.
Tan, W. (2007). Practical Research Methods, Pearson Education South Asia.
Tam, Maggie, Tummala, R. (2001) An Application of the AHP in vendor selection of a telecommunications system. Omega 29(2), p. 171-82.
Wang, G., Huang, S.H. and Dismukes, J.P. (2005). Manufacturing Supply Chain Design and Evaluation, International Journal of Advanced Manufacturing Technology, 25 (1), 93-100.
Yahya, S. and Kingsman, B. (1999). Vendor Rating for an Entrepreneur Development Programmed: A Case Study Using the Analytical Hierarchy Process Method, Journal of the Operational Research Society, 55, 916-930.
Yin, R.K. (2003). Case study research: designs and methods, California: Sage Publications, 3(1).