Efficient Feature Selection Using a Hybrid
Algorithm for the Task of Epileptic Seizure Detection
Kee Huong Lai
a, Zarita Zainuddin
aand Pauline Ong
baSchool of Mathematical Sciences, Universiti Sains Malaysia,11800 USM, Penang, Malaysia bFaculty of Mechanical and Manufacturing Engineering, Universiti Tun Hussein Onn Malaysia,
86400 Parit Raja, Batu Pahat, Johor, Malaysia
Abstract. Feature selection is a very important aspect in the field of machine learning. It entails the search of an optimal subset from a very large data set with high dimensional feature space. Apart from eliminating redundant features and reducing computational cost, a good selection of feature also leads to higher prediction and classification accuracy. In this paper, an efficient feature selection technique is introduced in the task of epileptic seizure detection. The raw data are electroencephalography (EEG) signals. Using discrete wavelet transform, the biomedical signals were decomposed into several sets of wavelet coefficients. To reduce the dimension of these wavelet coefficients, a feature selection method that combines the strength of both filter and wrapper methods is proposed. Principal component analysis (PCA) is used as part of the filter method. As for wrapper method, the evolutionary harmony search (HS) algorithm is employed. This metaheuristic method aims at finding the best discriminating set of features from the original data. The obtained features were then used as input for an automated classifier, namely wavelet neural networks (WNNs). The WNNs model was trained to perform a binary classification task, that is, to determine whether a given EEG signal was normal or epileptic. For comparison purposes, different sets of features were also used as input. Simulation results showed that the WNNs that used the features chosen by the hybrid algorithm achieved the highest overall classification accuracy.
Keywords: Feature selection, principal component analysis, harmony search, wavelet neural networks, seizure detection
PACS: 07.05.Mh
INTRODUCTION
Epilepsy is a chronic disease that affects people of all ages. The disease is caused by abnormal neuronal activities in the brain. It manifests itself in the form of recurrent seizures. Approximately 1% of the world population suffers from this neurological disorder [1]. This figure translates into 70 million people. This astronomical number of patients diagnosed with the disease shows that the research in the field of epilepsy seizure is of utmost importance.
In general, the use of mathematical models in the discipline of epilepsy seizure falls into two broad categories, namely seizure detection [2] and seizure prediction [3]. In seizure detection, an expert system which is able to differentiate between interictal (normal) and ictal (epileptic) EEG signals is highly desirable. Visual inspection of the long-term EEG recordings is a very tedious and time consuming process. Therefore, an automated classifier will not only save time, but also medical expenditure. On the other hand, seizure prediction can also be viewed as a binary classification problem, where a trained mathematical model will be used to differentiate between interictal and pre-ictal EEG signals. A therapeutic intervention, based on seizure warning algorithms, can be developed to predict the onset of impending seizures.
The use of different types of machine learning classifiers in the task of epileptic seizure classification and prediction has been investigated by many researchers and reported in the literature. Among the machine learning classifiers that are used include extreme learning machine (ELM) [2], support vector machine (SVM) [3], and different types of models of artificial neural networks (ANNs), such as probabilistic neural networks (PNNs) [4], radial basis neural networks (RBNNs) [5], and recurrent neural networks (RNNs) [6]. Each of the classifiers differs in network architecture.
In addition, different feature extraction methods were reported. For example, spectral power features, statistical moments, Hjorth parameter, spectral edge power, wavelet coefficients, Lyapunov exponent, and others [3, 7].
combines principal component analysis (PCA) and harmony search (HS) algorithm, is proposed to find the most discriminating features derived from EEG signals. The proposed algorithm is tested on the EEG classification problem.
The remaining of this paper is organized as follows. Section 2 discusses the feature selection methods. Section 3 introduces the architecture and learning algorithm of wavelet neural networks (WNNS). Section 4 studies the task of epileptic seizure detection. Section 5 presents the result and discussion. Section 6 concludes the paper.
FEATURE SELECTION
Feature selection plays an important role in reducing the dimension of input data, and subsequently, the computational cost. In general, feature selection algorithms can be divided into two categories, namely the filter methods and the wrapper methods. The filter methods use a pre-determined evaluation metric to rank the features. Since these methods do not acquire feedback from classifiers, they are less computationally intensive and hence, can be performed very quickly.
On the contrary, the wrapper methods, which are classifier-dependent, have high computational cost, because for each of the selected feature subsets, the classifier needs to be trained. Nevertheless, wrapper methods use the classification accuracy reported by the specified classifiers as their final criterion. Hence, these methods are able to find the best set of feature specifically catered for the particular classifiers.
Considering the pros and cons of both the filter and wrapper methods, this paper proposes a hybrid feature selection algorithm, that employs principal component analysis (PCA), as part of its filter method, and the metaheuristic harmony search (HS) algorithm, as part of the wrapper method.
Principal Component Analysis
PCA is a statistical method that is used to convert an original set of feature into another set of new set of feature of lower dimension. The new set of feature is obtained from the linear combination of the original variables. The transformation is accomplished in such a way that the first axis, or principal component, contributes the highest variance of the data. The second component, which is orthogonal to the first component, contributes the second largest variance of the data. The remaining components are defined in similar way.
A brief description how PCA works is provided as follows. LetX [xmn] be the data matrix with m rows and n columns. First, the covariance matrix C is calculated by using the following equation:
1 1
( )( ) , 1
n
T
x i i
i
x x x x
n
¦
C (1)
where xis the mean ofX. Second, the eigenvaluesO O1, ,...,2 Onand the corresponding eigenvectors are calculated. Third, the eigenvalues are sorted in descending order. A new set of principal component is then created by choosing the first k principal components, wherek n . The first k components that contain most of the variation in the original data are retained, and the rest of the components are eliminated. As such, the dimension of the data is reduced without losing much of the significant information embedded in the original data. The number of components to be chosen is given by the following equation:
1 2
1 2
...
100. ...
k n
p O O O
O O O
u
(2)
When the value of p exceeds a certain percentage, the first few k components are chosen for the new data set. A common value of p used is 90.
Harmony Search
audience’s esthetics is analogous to the quality of the solutions found via local and global search during optimization.
The HS algorithm demonstrates several attractive advantages [12]. First, it imposes only a few mathematical requirements. Second, the algorithm is not sensitive to the initial value settings because the values of entire search space will be considered when generating a new candidate solution. Third, the derivative information of the algorithm is not necessary as the algorithm employs stochastic random searches. Fourth, while genetic algorithm (GA) only consider two parent vectors when generating a new solution, HS produces a new solution based on the values of all the solutions stored in harmony memory. In general, 10 sets of solutions are stored.
The algorithm proceeds as follows[10]:
Step 1: Initialize parameters – HMS, HMCR, PAR BW, NI. Step 2: Initialize HM.
Step 3: Improvise a new harmony from HM. Step 4: Update HM if a better solution is found. Step 5: Repeat steps 3 and 4 until NI is reached.
The five parameters in step 1 are as follows: Harmony memory size (HMS) refers to the number of sets of solutions that are stored in the harmony memory (HM). Harmony memory consideration rate (HMCR) and pitch adjusting rate (PAR) are the parameters used to find a new candidate solution. The values of HMCR and PAR are chosen from the interval [0,1]. The best set of values is determined empirically. Distance bandwidth (BW) is the step size, which is found by multiplying a small value, usually 0.001, with the range xU – xL, where xUis the upper bound and xL is the lower bound of each of the decision variables. Number of improvisations (NI) is the stopping criterion used for the algorithm, which is the predefined maximum number of iteration.
The Hybrid Feature Selection Algorithm
For the first half of the hybrid algorithm, the PCA reduces the number of dimension of the data from n to k. Meanwhile, for the second half of the algorithm, the HS algorithm is employed, where its objective is to find thel features, wherel nd , that will maximize the overall classification accuracy of the classifier used.
Notice that the features selected using the filter method might or might not be included later in the wrapper method. The discardedn k features from the filter method might be included again during the wrapper method. The discarded individual feature might not contribute much variation of the original data, but a linear combination of their subset might provide more useful information.
In order to find the optimal subset of all the given features, an exhaustive method might be used, but it is very impractical as it is computationally expensive and time consuming to search through all the 2q combination of
subsets, where qis the number of features.
To tackle the feature selection problem using the HS algorithm, two ideas were outlined [13]. The first idea is the horizontal approach, where each feature is coded in binary values. The code 1 implies that the feature is included in the feature subset, whereas the code 0 signifies that the feature is excluded in the feature subset. The harmony is represented by a series of bits. The second idea is the vertical approach, where a pre-determined number of musicians are selected. Each musician can choose one feature or no feature at all, and some of the musicians might choose the same feature. The features are labeled with indices. The harmony is represented by a series of numbers, where some of the numbers might be the same, referring to the same feature. In this paper, the vertical approach is adopted. The features that have been selected using the filter method are included in the initial harmony memory as part of the initialization process.
The main steps of the hybrid feature selection algorithm are explained as follows:
During the first step, the optimization problem is formalized and the parameters are initialized. The cost function to be maximized is the overall classification accuracy of the WNNs model. The solution vectors refer to the subset of features to be included. All four parameters are initialized. The values of the parameters are based on the empirical suggestions[14], where HMS = 10, HMCR = 0.8, BW = 0.001, and NI = 10000. The PAR parameter has been excluded because the features are coded using indices and there is no relation between each feature and its neighbors [15], unlike in the case of optimization problem where the decision variables are real numbers.
1 2
1
1 1 1
1 2
2
2 2 2
1 2
HMS
HMS HMS HMS
( ) ( ) , ( ) N N N f
x x x
f
x x x
HM
f
x x x
ª º « » « » « » « » « » ¬ ¼ x x x " " # # # % # " (3)
where the subscript of x denotes the set of solution, whereas the superscript of x denotes the decision variable. The function f is the cost function.
During the third step, a new harmony is generated from the existing HM. Let 0 r 1be a random number, for each of the decision variables, a new value x' is generated via the following two methods:
(i) If rHMCR, x' will be chosen from one of the values in the same column in HM. (ii) Else, x'will be generated randomly from the entire solution space.
During the fourth step, the harmony memory is updated. If the new solution is found to be better, that is, a higher classification accuracy is obtained, then it will replace the worst solution in the HM.
The last step is related to the stopping criterion. The algorithm terminates when it reaches the maximum iteration (NI). The best solution vector that gives the greatest value of cost function, that is, the highest classification accuracy, will be presented.
WAVELET NEURAL NETWORKS
Network Architecture
Introduced by Zhang and Benveniste, wavelet neural networks (WNNs) [16] model is another promising mathematical modeling tool that has been used in a wide range of applications. WNNs have more compact topologies and faster learning speed compared with other ANNs. Unlike multiplayer perceptrons (MLPs) that utilize global sigmoidal functions as activation functions, WNNs employ local wavelet activation functions, which have finite support.
WNNs are feedforward neural networks that consist of three layers, namely the input layer, the hidden layer, and the output layer. The input layer receives input data and transmits them to the hidden layer that consists of localized wavelet functions, such as Gaussian wavelet, Mexican Hat wavelet, and Morlet wavelet. This layer performs the nonlinear mapping on the data before propagating them to the final output layer, where a linear combination operation is performed.
A typical WNN is modeled by the following equation:
1
( ) p i ,
ij i
y w b
d \§ ¨ ·¸
© ¹
¦
x tx (4)
where y is the output, x is the input data, p is the number of hidden nodes, wij is the weight matrix, \ is the wavelet activation function, t is the translation vector, d is the dilation parameter, and b is the bias term. The architecture of WNNs is shown in FIGURE 1.
Learning Algorithm
After the translation vectors and dilation parameters are initialized, the wavelet activation function in the hidden nodes will receive input data from the input layer. The values obtained will be the input for the output layer. The weight valueswijin the weight matrixWare computed by solving a system of linear equations.
Eq. 4 can be written in the following compact compact formY GW, where Y is the output, W [wij] is the weight matrix, and G is the matrix that stores the values of the output of the activation function. The equationW G Y* is used when solving for the values in the weight matrix W. The formula for the pseudoinverse
*
FIGURE 1. Network architecture of WNNs with d input nodes, p hidden nodes, and L output nodes.
EPILEPTIC SEIZURE DETECTION
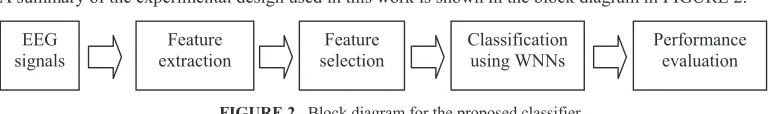
A summary of the experimental design used in this work is shown in the block diagram in FIGURE 2.
FIGURE 2. Block diagram for the proposed classifier.
The data used in this study were acquired from a publicly available benchmark dataset [17]. The five sets of data, labeled A to E, were recorded under different conditions. Set A was recorded from healthy subjects with their eyes open. Set B was recorded from the same group of people, but with their eyes closed. Set C to E were obtained from epileptic patients. Set C was recorded from the hippocampal formation of the opposite hemisphere of the brain, whereas set D was obtained from within the epileptogenic zone. The last set of data, set E, contains epileptic signals that were recorded when the patients experienced seizure. In summary, set A to D represent normal EEG signals, whereas set E represents epileptic EEG signals. Each EEG signal was recorded for 23.6 s at a sampling rate of 173.61 Hz, to give a time series of 4097 data points.
For feature extraction, the Daubechies wavelet of order 4 (db4) was used to analyze the EEG signals. A four-level decomposition scheme was employed, which produced five frequency subbands - d1 (43.4 – 86.8 Hz), d2 (21.7 – 43.4 Hz), d3 (10.8 – 21.7 Hz), d4 (5.4 – 10.8 Hz), and a4 (0 – 5.4 Hz). For each signal, a set of 40 summary statistics were computed from the generated detail and approximation wavelet coefficients. A total of 8 different statistics were derived from each of the five subbands. They are: (i) maximum, (ii), minimum, (iii) 90th percentile,
(iv) 10th percentile, (v) mean, (vi) standard deviation, (vii) skewness, and (viii) kurtosis of the wavelet coefficients.
The Morlet wavelet was used as the activation function of WNNs. A 10-fold cross validation was adopted in this study. The results were reported in three performance metrics, namely sensitivity, specificity, and overall classification accuracy.
RESULTS AND DISCUSSION
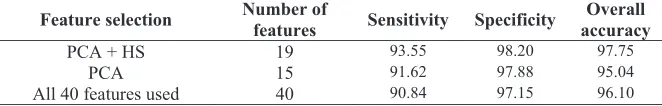
The initial number of feature is 40. After applying the PCA, it was found that the first 15 components contributed approximately 90% of the variations of the data. These 15 features were used in the second step of the HS algorithm. An additional 10 musicians were added, making the total number of musicians in HM 25. Columns number 1 to 15 of the 10 solutions in HM were labeled with the features selected from the filter method. The remaining 10 columns were given random indices. At the end of the HS algorithm, the best set of feature that gave the highest classification accuracy was the one that contained 19 features. Out of these 19 features, 13 of them matched the features that were selected by the filter method.
For comparison purposes, different subsets of input features were also considered. The performance metrics obtained from the simulation are shown in TABLE 1.
EEG signals
Feature extraction
Feature selection
Classification using WNNs
[image:5.612.105.489.287.344.2]TABLE (1). Performance metrics for the EEG classification problem.
Feature selection Number of features Sensitivity Specificity accuracyOverall
PCA + HS 19 93.55 98.20 97.75
PCA 15 91.62 97.88 95.04
All 40 features used 40 90.84 97.15 96.10
From Table 1, the WNNs that used the hybrid algorithm in the feature selection stage achieved the highest classification accuracy, at 97.75%. This is followed by the WNNs that used all the 40 features as input, at 96.10%. The WNNs that used the features that were chosen by PCA gave the lowest overall classification accuracy, at 95.04%. The redundant features in the original 40 features extracted added complexity to the learning algorithm. In addition, the inclusion of these irrelevant features had degraded the performance of the classifier.
The PCA algorithm chose only the first 15 features that have the greatest values of eigenvalues. Out of the 19 features selected by the hybrid feature selection algorithm, 13 of them were the same features chosen by the PCA. The remaining 6 were the features that were not selected by PCA. This illustrates that PCA is able to find most of the optimal and discriminating features. Nevertheless, some of the eliminated features, when combined, might provide more useful insight. It is here that the HS algorithm plays its part by finding the remaining features.
When coupled with PCA, HS proves to be a powerful tool as it is able to find a number of additional features to be included in the new feature subset. The high classification accuracy obtained is credited to the fast computation of the PC method, as well as the HS algorithm, where it looks for the sub-optimal solutions from a record of all the good historical solutions stored in harmony memory.
CONCLUSIONS
In this paper, a hybrid feature selection algorithm is proposed. The algorithm uses PCA as part of the filter method, and HS as part of the wrapper method. The algorithm addresses the issue of finding the most relevant and optimal subset of input features specifically catered for the WNNs model. The problem of epileptic seizure is studied. Based on the high overall classification accuracy obtained, it is found that the proposed hybrid algorithm is able to find a good subset of input features derived from the wavelet coefficients of EEG signals.
ACKNOWLEDGMENTS
The authors gratefully acknowledge the financial assistance provided by the Ministry of Higher Education, Malaysia, under the FRGS research grant scheme, and Universiti Sains Malaysia, under the USM Fellowship Scheme.
REFERENCES
1. L. D. Iasemidis, D. S. Shiau, W. Chaovalitwongse, J. C. Sackellares, P. M. Pardalos, J. C. Principe, P. R. Carney, A. Prasad, B. Veeramani, K. Tsakalis, IEEE Trans. Biomed. Eng. 50, 616-627 (2003).
2. Y. Song and J. Zhang, Expert Syst. Appl. 40, 5477-5489 (2013).
3. P. R. Carney, S. Myers, and J. D. Geyer, Epilepsy Behav. 22, 94-101 (2011). 4. E.D. Übeyli, Expert Syst. Appl. 37, 985-992 (2010).
5. S. Ghosh-Dastidar, H. Adeli, and N. Dadmehr, IEEE Trans. Biomed. Eng. 55, 512-518 (2008). 6. V. Srinivasan, C. Eswaran, and N. Sriraam, J. Med. Syst. 29, 647–660 (2005).
7. J. Rasekhi, M. R. K. Mollaei, M. Bandarabadi, C. A. Teixeira, and A. Dourado, J. Neurosci. Meth. 217, 9-16 (2013). 8. I. GĦler and E.D. Übeyli, J. Neurosci. Meth. 148, 113-121 (2005).
9. Y. Liu and Y. F. Zheng, Pattern Recog. 39, 1333-1345 (2006).
10. Z. W. Geem, J. H. Kim, and G. V. Loganathan, Simulation 76, 60-68 (2001). 11. S. Kulluk, L. Ozbakir, A. Baykasoglu, Eng. Appl. Artif. Intel. 25, 11-19 (2012). 12. K. S. Lee and Z. W. Geem, Comput. Meth. Appl. Mech. Eng. 194, 3902–3933 (2004).
13. R. Diao and Q. Shen, “Two New Approaches to Feature Selection with Harmony Search”, WCCI 2010 IEEE World Congress on Computational Intelligence, 2010, pp. 3161-3167.
14. S. K. Lee and Z. W. Geem, Eng. Optimiz. 37, 663-684 (2005). 15. R. Diao and Q. Shen, IEEE T. Syst. Man. Cy. B 42, 1509-1523 (2012). 16. Q. Zhang and A. Benveniste, IEEE T. Neural Networ. 3, 889-898 (1992).
[image:6.612.141.472.111.164.2]