Journal of Chemical and Pharmaceutical Research, 2014, 6(5):204-209
Research Article
CODEN(USA) : JCPRC5
ISSN : 0975-7384
The calculation method of small-scale water injection multiple in
water drive reservoirs
Cui Chuanzhi
1, Li Kaikai
1, Guo Jincheng
2, Cao Gang
2and Zhang Chuanbao
21
College of Petroleum Engineering, China University of Petroleum, Qingdao, China
2Research Institute of Geology and Science of Shengli Oilfield, SINOPEC, China
____________________________________________________________________________________________ABSTRACT
The water injection pore volume multiple in conventional core displacement experiment is inconsistent with that in the entire reservoir, which results in the difficulty in the application of the results of core displacement experiment to the calculation of reservoir development. Therefore, it is required to know the distribution of water injection pore volume multiple in the formation which is consistent with that in the core displacement experiment. In this study the case of the Five-spot Well Pattern was used to determine the streamline distribution in the formation. Fluids flow one-dimensionally along the streamline and each streamline can be seen as the connection of a number of cores. The flowing resistance on each streamline was measured to determine the water injection rate of each streamline. According to the theory of one-dimensional oil-water two phase flow, the water injection pore volume multiple of each core in the streamline could be calculated. Thus, the consistence would be achieved between the multiple of water injection in core displacement experiment and that in the formation. The research results was of high theoretical and practical significance to the application of the results of core displacement experiment to the research of reservoir development.
Key words: Pore volume multiple; Streamline; Displacement experiment; Water drive reservoir; Rock Core. ____________________________________________________________________________________________
INTRODUCTION
Generally, water injection pore volume multiple refers to the ratio between cumulative water injection and the total pore volume of reservoir. When the oilfield development reaches an ultra-high water cut stage, the cumulative water injection pore volume multiple of the entire reservoir is generally less than 5 [1-2].
Core displacement experiment is a conventional and commonly used experimental method. A large amount of useful information can be obtained through this kind of experiments, such as the displacement efficiency and the variations of reservoir permeability corresponding to different water injection pore volume multiples. However, enormous difficulty arises in the application of such information to actual reservoirs, because the water injection pore volume multiple obtained in conventional core displacement experiment usually reach several tens or hundreds [3-5], far greater than that of actual reservoirs, i.e., the water injection pore volume multiple in core displacement experiment is not the water injection pore volume multiple of the entire reservoir in a conventional sense. In this study the water injection pore volume multiple obtained in core displacement experiment was defined as small-scale water injection pore volume multiple in order to distinguish it from that of the entire reservoir.
calculating the ratio of the total volume of inflow water to the pore volume of the grid. However, the small-scale water injection pore volume multiple is greatly affected by the size of pore volume of the grid, and is still inconsistent with that in core displacement experiments.
The case of the Five-spot Well Pattern was studied to investigate the calculation method of small-scale water injection pore volume multiple in the formation which was consistent with that in core displacement experiment.
1. STREAMLINE DISTRIBUTION OF FIVE-SPOT WELL PATTERN
In the Five-spot Well Pattern, the potential function in the formation could be obtained according to the principle of superposition of potential. The stream function could be acquired according to Cauchy-Riemann conditions, and the stream function could be used in the determination of the streamline distribution in the formation.
1.1. Potential function of five-spot well pattern
For a point source or point sink, the potential expression at any point in the formation is shown as below:
( )
1
ln
2
j
q
r
C
π
Φ = −
+
(1)In the above formula, j = 2 for production wells, j = 1 for injection wells.
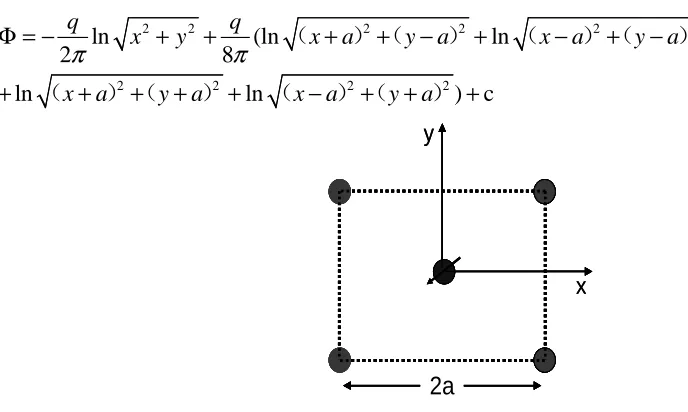
When there was only one Five-spot well pattern in the formation (as shown in Fig.1), according to the principle of superposition of potential, the expression of potential function in the formation is as follows:
2 2 2 2 2 2
2 2 2 2
ln
(ln
ln
2
8
ln
ln
)
c
q
q
x
y
x
a
y
a
x
a
y
a
x
a
y
a
x
a
y
a
π
π
Φ = −
+
+
+
+ −
+
−
+ −
+
+
+ +
+
−
+ +
+
(
)
(
)
(
)
(
)
(
)
(
)
(
)
(
)
(2)
2a
2a
x
y
2a
2a
2a
2a
x
y
Figure 1. Schematic diagram of Five-spot Well Pattern
1.2. Stream function and streamline of five-spot well pattern
Cauchy - Riemann conditions is satisfied between stream function and potential function, i.e.:
x
y
y
x
ϕ
ϕ
∂Φ ∂
=
∂
∂
∂Φ
∂
= −
∂
∂
(3)
According to Cauchy-Riemann conditions, the stream function of Five-spot Well Pattern can be obtained through the derivation from potential function expression (2):
2
q
arctg
(arctg
arctg
arctg
arctg
)
2
8
y
q
y
a
y
a
y
a
y
a
c
x
x
a
x
a
x
a
x
a
ϕ
π
π
−
−
+
+
= −
+
+
+
+
+
[image:2.595.75.419.321.527.2]+
−
+
−
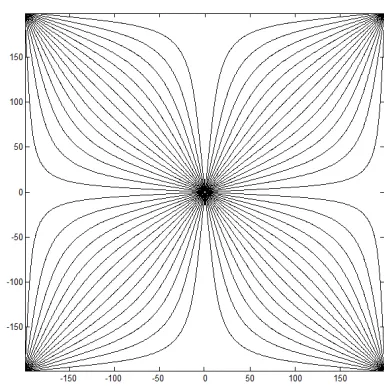
(4)Figure 2. The streamline distribution schematic diagram of Five-spot Well Pattern
2. CALCULATION OF SMALL-SCALE WATER INJECTION PORE VOLUME MULTIPLE
Fluids flow one-dimensionally along the streamline. Under the condition of oil-water two-phase flow, the water saturation distribution along the streamline could be calculated according to the theory of one-dimensional oil-water two phase flow. Each streamline in the formation could be seen as the connection of a number of cores, and the determination of the distribution of small-scale water injection pore volume multiple in the entire formation was achieved through the calculation of the water injection pore volume multiple of each core in the streamline.
2.1. Calculation of the derivative of water cut
According to Darcy's law, the water cut equation could be obtained without taking capillary pressure and gravity into consideration:
1
1 f w
k ro w k rw o
µ µ
=
+ ⋅
(5)
Due to the satisfaction of the following relationship between the ratio of relative permeability of oil-water two phase and water saturation:
2
1 W
k ro e b S k rw
b
−
= ⋅ (6)
Thus, the water cut equation could be expressed as below:
2 1
1 1
1 1 W
f w
k ro w b e b S w
k rw o o
µ µ
µ µ
= =
−
+ ⋅ + ⋅ ⋅
(7)
The derivative of water cut could be obtained through the derivation of
S
win the above equation, i.e., the increasing rate of water cut:
+
=
∂
∂
− w −bSwo w bS
o w w
w
b
b
e
b
e
S
f
1 1
2
1
µ
µ
µ
µ
(8)
With given oil-water viscosity and relative permeability curve, the water cut and increasing rate of water cut corresponding to different water saturation could be obtained according to equations (5)-(8).
2.2. Calculation of water saturation along the streamline
( )
w wQ t
df
dx
dt
=
φ
A
⋅
dS
(9)The result after integration is shown as follows:
( )
t ( ) w wo
f
x Q t dt
A
s
φ
′
= ⋅
∫
(10)According to Equation (10), the derivative of water cut could be obtained at any location (x) in the streamline at a
specific time (
t
). The water saturation (S
w) and water cut (f
w) could be obtained with knowledge of the relationship between the derivative of water cut and water saturation.2.3. Calculation of small-scale water injection pore volume multiple
A segment was selected along a certain streamline and its length should be equivalent to that of the core in the displacement experiment. Thus, the small-scale water injection pore volume multiple of this section could be obtained at the time
T
:0
( )
t T
w t
dt
AL
Q
t f
v
φ
=
=
=
∫
(11)The calculation of water injection pore volume multiple of each “core” along the streamline was conducted in order to determine the distribution of small-scale water injection pore volume multiple of the entire formation.
2.4. Calculation of the allocation of water injection rate on each streamline
For each well group, the water injection rate of each streamline could be determined with given total water injection rate, according to the streamline number flowed from the water well and the flowing resistance of each streamline.
The numbers of cores of each streamline varies with its length. It was assumed that N streamlines flowed from the water well, of which k -th streamline was formed by connection of
k
m
cores. If1
k
ro rw
k kj
j o w
kj
m
kk
kk
R
h
µ
µ
=
=
∑
+
(12)Then, the water injection rate of k-th streamline was as follows:
1
k
N inj tk
j j
R
Q
Q
R
=
=
⋅
∑
(13)
Where
Q
inj represents the total water injection rate of water well.According to the mobility of oil phase and water phase at the exit of k-th streamline, the oil production rate and water production rate of this streamline could be calculated respectively, i.e.:
o
ok tk
o w k
Q
λ
Q
λ λ
=
+
,Q
wk=
Q
tk−
Q
ok (14)The flowing resistance of each streamline varied with water saturation, which meant the allocated water injection rate of each streamline was different at different time.
3. APPLICATION AND EXAMPLE
permeability, and10 mPa.s and 0.5 mPa.s in oil and water viscosity respectively. In the core displacement experiment, the core was 8 cm in length, while 1 cm in radius and 0.08 cm3/s in water injecting rate. Fig.3 shows the relative permeability curve adopted in the calculation.
0 0. 1 0. 2 0. 3 0. 4 0. 5 0. 6 0. 7 0. 8 0. 9 1
0 0 . 2 0. 4 0 .6 0 . 8 1
S w
K
r
K r o
[image:5.595.176.437.117.257.2]K r w
[image:5.595.196.417.359.590.2]Figure 3. The relative permeability curve
Fig.4 is the contour map of the calculated small-scale water injection pore volume multiple in the formation with the recovery percent of reserves of 20%. This map is one quarter of one Five-spot well pattern. It can be seen that the distribution of small-scale water injection pore volume multiple in the formation along the mainstream between the water well and oil well was greater. The small-scale water injection pore volume multiple adjacent to the water well is greater than that in the else region of the formation and gradually decreased from the mainstream to the flanks with even non-existence in certain regions among the oil wells.
Water well
Oil well
Figure 4. The contour map of the small-scale water injection pore volume multiple
CONCLUSION
Based on the distribution of streamlines and the results of core displacement experiment, the calculation method of small-scale water injection pore volume multiple in the formation which was consistent with that in core displacement experiment was established in this study, which was of great practical significance to the application of the results of core displacement experiment to the research of reservoir development.
NOMENCLATURE
a half the distance between two oil wells, cm A the section area of streamline, cm2
1 2
w
f water cut
H
reservoir thickness, cmk
absolute permeability of reservoir, µm2ro
k
oil phase relative permeabilityrw
k
water phase relative permeabilityL
core length, cmq the production rate with one unit thickness, cm3
/s
inj
Q
water injection rate of one water well, cm3/so
Q
oil production rate, cm3/sw
Q
water production rate, cm3/s ( )Q t water injection rate of one streamline, cm3/s r the distance from any point to point sink, cm
R
flowing resistance, µm2⋅
cm
mPa s
⋅
v
small-scale water injection pore volume multiple x ,y the coordinateΦ potential function
ϕ
stream functionφ
porosityo
µ
oil viscosity, mPa⋅
sw
µ
water viscosity, mPa⋅
sAcknowledgement
This work was Supported by Program for Changjiang Scholars and Innovative Research Team in University (IRT1294) and China National Science and Technology Major Projects (Topic name: The technology to improve oil recovery at high water cut period in Shengli oilfield, Topic number: 2011ZX05011).
REFERENCES
[1] SUN Huan-quan., OGRT, 2000,7(1):33-37.
[2] HUANG Tian-kun; CHEN Jun-bin; WANG Zhi-hua, West-China Exploration Engineering, 2008,20(11):85-87. [3] DENG Rui-jian, Journal of Jianghan Petroleum Institute,2003,25(3),111-113.