Champion Determining System: Do Playoffs Work?
Mark Swanstrom
*, Charlie Penrod
School of Business, Northwestern State University of Louisiana, Natchitoches, 71497, Louisiana, United States *Corresponding Author: [email protected]
Copyright © 2013 Horizon Research Publishing All rights reserved
Abstract
Almost everyone -- including fans, analysts, and politicians -- seems to complain about the Bowl Championship Series (BCS) and its method for determining the national champion of college football. While people clamor to let teams win it “on the field” in a playoff system, the reality is that upsets happen and sometimes the best team doesn’t win. This paper examines the results of a hypothetical league where each team is randomly assigned a power score so that the “best” team is known. It then simulates games using the teams’ power scores to determine the odds of winning each game. The actual winner and margin of victory of each game is randomly determined based on the odds for each game. This process is followed to create an entire season of games and one hundred seasons are simulated in this paper. The champion for each season is determined using both a quantitative formula and a playoff. The performance of the different methods is determined by how well it does in choosing the “best” team as the champion. Results indicate that a quantitative formula does a better job of choosing the best team as the champion than does the playoff system.Keywords
Sports Economics, BCS, Playoffs, Competition, Quantitative Analysis1. Introduction
Almost every team sports league in the United States uses a playoff system to crown a champion at the end of the season. One notable exception to this is major college football where the champion is determined by a national championship game where the participants are determined by a combination of human polls and quantitative models. A four-team playoff will be introduced for the 2014 season, but many people feel that this still does not go far enough and want to replace it with a larger playoff system. Some critics of the playoff idea complain that playoffs will unduly prolong the season and increase the risk of injury to players and interfere with their academic endeavors.
The current quantitative model utilized to select the two teams to play for the national championship in college football is the Bowl Championship Series (BCS). Beginning
with the 1998 season, the six “power” conferences (ACC, Big East, Big Ten, Big Twelve, Pac-12 and SEC) devised a system that would ensure the top two teams in the country would play against each other in a national championship game. Prior to the BCS, the teams were placed in predetermined bowl games based on the finishing rank in a conference.
The BCS has been tweaked and modified since its inception in an effort to increase the accuracy of the system. Currently, the BCS is comprised of a composite score of three different variables. Two of these three variables are human polls (the Coaches Poll and the Harris Interactive Poll). These polls are a collection of either coaches or sportswriters who subjectively rank the quality of teams from 1 to 25. The third variable consists of six aggregated computer rankings. The idea behind the inclusion of these variables is that, while humans are assumed to be better equipped to gauge the quality of teams, an objective computer ranking should be added to provide objective, unbiased input into the poll.
One major criticism of the BCS system is that worthy teams, especially those from outside of the six power conferences, are left out of the mix. BCS opponents argue that not only is this unfair to student-athletes who are denied an opportunity to win a championship, but also the current BCS violates U.S. antitrust laws prohibiting monopolies and/or agreements between horizontal firms to restrain trade. The schools selected to play in the BCS national championship and the other BCS bowl games receive large monetary payouts, which consistently go to schools in the six power conferences. Between 2004 and 2010, nine teams finished the regular season undefeated without having a chance to play for the national championship. A playoff system would at least give these teams an opportunity to play for the national championship and receive the financial benefits of playing in those games.
and Oklahoma, with many voicing complaints that Auburn was the best team and deserved a chance to play for the national championship.
While a playoff system would indeed give more teams an opportunity to win a championship, it does not necessarily mean that the best team will win the championship. The best team does not win every game, and there is not even agreement as to what it means to be the best team. Is a consistently good team better than an inconsistent team that is occasionally great? Even if a “best team” actually exists, it is impossible to actually know who the best team is with or without a playoff system when the regular season consists of only 11 or 12 games.
In calling for a boycott of the BCS system by quantitative analysts, Stern (1) points out that there is no defined objective for the computer models used by the BCS. Should the model try to pick the best team over the course of the season or the best team at the end of the season? This could affect how games are weighted over the course of the season. Should it pick a team that dominates most of their games but is prone to being upset or a team that consistently ekes out victories? This could affect the inclusion of scoring margin, which the BCS specifically prohibits in its quantitative models in order to discourage teams from running up the score.
These factors mean that there could be a variety of models that could plausibly be used to rank teams. In addition to the models used by the BCS, Park and Newman (2) use a network-based model that credits teams for their own wins plus an adjusted amount for the wins of their opponents and the wins of their opponents’ opponents and so on. Gil and Keating (3) look at a fixed-effect model, a mixed-effect model, and weighted least squares to determine ranks. Both papers compare their models with the polls using historical data from past football seasons, but neither paper attempts to prove that any model is empirically better than another model.
While there are clearly problems with using quantitative models, a playoff system does not guarantee that the best team will be crowned champion. The National Football League has a playoff system and it is interesting to note how their results were to differ if they used a quantitative system similar to the BCS.
In order to examine this question, a quantitative score was calculated for each team equal to their winning percentage plus their adjusted opponent winning percentage plus their average scoring margin (where an average scoring margin of 4 points would be worth .4).
In 2012, New England had the highest quantitative score overall at 2.675. However, they were upset by Baltimore -- a team with a score of just 1.47. Baltimore went on to defeat San Francisco (2.01) in the Super Bowl.
In 2011, Green Bay had the highest quantitative score overall at 2.68. In the Super Bowl, the New York Giants ended up defeating New England (2.35) despite having a quantitative score of just 1.05. In 2010. New England had the highest quantitative score overall of 2.67 and Atlanta had the
highest score in the NFC at 2.1. However, Green Bay, with a score of 2.08, ended up beating Pittsburgh (2.13) in the Super Bowl.
This indicates that the champion resulting from a playoff system is very different than the quantitative champion. It is impossible to state with certainty which team is truly the best and which system does the better job of determining the best team.
This paper takes a different approach to determine whether a playoff system or a quantitative formula does a better job of selecting the best team as the champion. We create a stylized example in which the best team is known in advance and then run simulations using both a quantitative method and a playoff in order to compare the alternatives.
2. Materials and Methods
Our first step in comparing methods is to define our objective for choosing a champion. We do this by creating a hypothetical league composed of eight conferences (A through H) with eight teams each. Every team is randomly assigned a Power Score between 0 and 1. The Power Score is a tool used to empirically rank the actual quality of each hypothetical team. Five conferences (A-E) are labeled Power Conferences and these teams receive an additional .1 points on their Power Score. This was done to simulate the inherent recruiting, facilities, and coaching advantages the power conference teams generally have. The team with the highest power score is by definition the best team and whichever method does a better job of choosing this team as the champion is defined as the better method. These power scores were ordered in order to determine the true rank of the team where the best team had a rank of 1 and the worst had a rank of 64.
We simulated 100 seasons where each team plays the other 7 teams in conference plus three other teams. In order to examine the effect of scheduling, we had Conference A teams play three teams from the other power conference teams. Conferences B-D, F, and G played two power teams while Conference E and H teams play two non-power teams. For each game the odds of a team winning was determined using the following formula:
Team’s Power Score / (Team’s Power Score + Opponent’s Power Score) (1) The actual winner of each game and the scoring margin depended on a random number between 0 and 1 using the following formula:
Odds of Winning – Random Number = Scoring margin (2) For example, if Team 1 had a Power Score of .9 and Team 2 had a Power Score of .6, then team 1 would have a 60% chance of winning. If the random number were .7, then team 1 would have lost by .1, meaning an upset has occurred.
percentage of their opponents after adjusting for their game against each other (OWP). An additional .1 points was added to the teams from the power conferences (PC). Strength of schedule is consistently used by the computer rankings in the BCS system, such as the Colley Matrix, Billingsley Report, Anderson and Hester, and Sagarin ratings, to determine the best teams. West and Lamsal (4) found that strength of schedule is strongly correlated to bowl-game victors. While the BCS has excluded scoring margin as a potential component, West and Lamsal found that scoring margin is also a strong predictor of football game winners. The team with the highest sum of the four components was declared the qualitative champion.
At the end of each season, we also had a sixteen-team playoff that included the winner of each conference and the eight non-conference winners with the highest quantitative score as calculated before. The conference winners were determined using simple winning percentage, with a variety of head-to-head tiebreakers depending on the number of teams tied. The quantitative scores were used to select the eight non-conference “wildcard” teams because, in theory, a 16-team playoff would also have to use some method to select those teams. The outcome of playoff games was determined using power scores and random numbers as with the regular season. The winner of the playoff was declared the champion.
3. Results
The best team won the championship nine times out of 100 seasons under the quantitative model and the average true rank of the champion was 9.37. We also ran a regression using power scores as the dependent variable and independent variables of the teams winning percentage, their average scoring margin, the winning percentage of their opponents, and a dummy variable equal to 1 for teams from power conferences.
Power Score = .404 - .311* WP + 1.598*SM + .528*OWP + .071*(PC) + e
The regression model had an Adjusted R2 of .634, an F-statistic of 2770, and all of the independent variables were significant at the 1% level. Individual correlations between the variables and the Power Score were also run where Scoring Margin had a correlation of .775, Winning Percentage had a correlation of .659, Power Conference had a correlation of .165, and Opponents Winning Percentage had a correlation of .047.
Under the playoff system, the best team made the playoffs 66 times out of 100 and also won nine times. However, the average rank of the playoff champion was 12.5 because
teams with low ranks were more likely to make the playoffs and have a chance to win it all. Plus, a one-game, winner-take-all playoff means the best teams have four chances to potentially be upset, since the team with the higher power score is not guaranteed victory. A series of one-game results is more likely to eliminate good teams than does a loss in a cumulative 10 game season where a loss does not automatically eliminate a team. A team ranked in the lower half of the league (greater than 32) won the playoffs four times while the worst team to win under the quantitative system was 30.
In order to test the null hypothesis that the mean was the same under both systems, we used the Wilcoxon Signed Ranks Test as found in Conover (5). For each season, we calculated the difference in the true rank of the champion under both systems as the rank of the quantitative champion minus the rank of the playoff champion. The absolute values of these differences were then ranked from 1 to 91 (there were 9 seasons where the two systems produced the same champion). These ranked differences, Ri, are then signed where a negative rank is used when the quantitative system has a higher ranked champion and a positive rank is used when the playoff system has a higher ranked champion. The test statistic is
T = ∑𝑛𝑛𝑖𝑖=1𝑅𝑅𝑖𝑖 / �∑𝑛𝑛𝑖𝑖=1𝑅𝑅𝑖𝑖2 (3)
Our results indicate that the quantitative model does a significantly better job of choosing the best team as the champion than does the playoff system. The t-statistic for this data is -2.6417 which is significant at the 1% level using a two-tailed test.
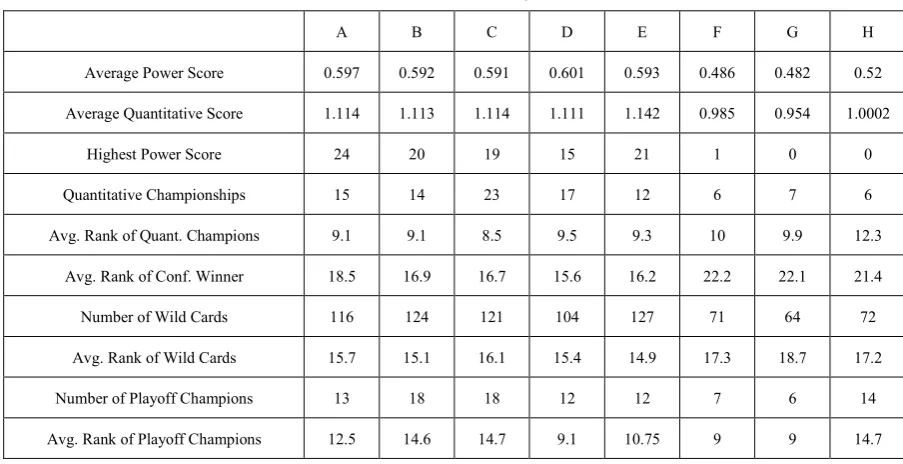
Table 1 presents the performance of teams by conference. As would be expected, teams in power conferences have a power score of approximately .6 while non-power conference teams have a power score of approximately .5. Likewise, the quantitative score is also a little bit more than .1 points for power conference teams. The best team came from a power conference in all but one season, but non-power conferences won the championship 19 times under the quantitative model and 27 times under the playoff system.
Table 1. Performance of Teams by Conference
A B C D E F G H
Average Power Score 0.597 0.592 0.591 0.601 0.593 0.486 0.482 0.52
Average Quantitative Score 1.114 1.113 1.114 1.111 1.142 0.985 0.954 1.0002
Highest Power Score 24 20 19 15 21 1 0 0
Quantitative Championships 15 14 23 17 12 6 7 6
Avg. Rank of Quant. Champions 9.1 9.1 8.5 9.5 9.3 10 9.9 12.3
Avg. Rank of Conf. Winner 18.5 16.9 16.7 15.6 16.2 22.2 22.1 21.4
Number of Wild Cards 116 124 121 104 127 71 64 72
Avg. Rank of Wild Cards 15.7 15.1 16.1 15.4 14.9 17.3 18.7 17.2
Number of Playoff Champions 13 18 18 12 12 7 6 14
Avg. Rank of Playoff Champions 12.5 14.6 14.7 9.1 10.75 9 9 14.7
Playing a soft schedule did not appear to help teams from conference E as they had fewer champions than the other power conferences. However, Conference H did have more playoff champions than the other non-power conferences and the champions from conference H had worse ranks.
4. Conclusion
By using simulations, we are able to define the objective of a champion-determining system as being the one that does a superior job of choosing the better team as the champion. We found that a fairly simple quantitative model does a better job than a playoff system. There are many models that can be used to rank teams, and a next logical step would be to determine whether other quantitative models can improve upon the performance of our simple model. This issue is left for future research.
The structure of the league and method of simulating team rankings and scores may also be adjusted. Changing the formula for determining the odds of winning a game will alter the likelihood of upsets occurring. For the extreme outcome where the best team always wins and there are no upsets, the playoff system would always choose the best team as the champion while the quantitative model may not. Changing the proposed playoff from a 16-team to an 8-team playoff would reduce the chances good teams get upset and might improve the average rank of the champion. A reduced sample found that reducing the likelihood of upsets improved both systems and that the outperformance by the quantitative system was reduced.
Additionally, it is by no means clear that crowning the “best” team as the champion is, or even should be, the goal. In college football, the goal may be to make the most money or to promote fan interest. In such a case, a system that fans like and that makes more money may be preferable even if it
results in choosing worse teams as champions. Another goal could be to maximize interest and the stakes in the regular season, because one regular season loss can be devastating to a team’s national championship hopes, while a team could absorb multiple regular season losses and still make a playoff. The playoff system may also do a better job of choosing the team that is best at the end of a season.
Finally, the goal of the college football season might simply be to give the best team access to the national championship, giving that team some control over its eventual outcome. For example, picking the best team in 2004 from among USC, Oklahoma, and Auburn was nearly impossible. A playoff system ensures all three teams get a chance to win or lose the championship on the field. However, as this paper notes, such a system that increases access also increases the likelihood of an unlucky bounce or two to knock the best team out of the playoffs.
REFERENCES
[1] Stern, HS. (2006). “In favor of a Quantitative Boycott of the Bowl Championship Series,” Journal of Quantitative Analysis in Sports: Vol. 2: Iss. 1, Article 4. http://www.bepress.com/jqas/vol2/iss1/4.
[2] Park, Juyong; Newman, M E J (2005). "A network-based ranking system for US college football." Journal of Statistical Mechanics: Theory and Experiment. 2005(10): P10014. [3] Gill, Ryan and Keating, Jerome (2009). “Assessing Methods
for College Football Rankings,” Journal of Quantitative Analysis in Sports: Vol. 5: Iss. 2, Article 3. http://www.bepress.com/jqas/vol5/iss2/3.
[image:4.595.77.529.84.316.2]Ratings” Journal of Quantitative Analysis in Sports: Vol. 4: Iss. 3, Article 3. http://www.bepress.com/jqas/vol4/iss3/3/. [5] Conover, W.J. (1980). Practical Nonparametric Statistics,