WRL
Research Report 91/6
Don’t Fidget
with Widgets,
Draw!
research relevant to the design and application of high performance scientific computers. We test our ideas by designing, building, and using real systems. The systems we build are research prototypes; they are not intended to become products.
There is a second research laboratory located in Palo Alto, the Systems Research Cen-ter (SRC). Other Digital research groups are located in Paris (PRL) and in Cambridge, Massachusetts (CRL).
Our research is directed towards mainstream high-performance computer systems. Our prototypes are intended to foreshadow the future computing environments used by many Digital customers. The long-term goal of WRL is to aid and accelerate the development of high-performance uni- and multi-processors. The research projects within WRL will address various aspects of high-performance computing.
We believe that significant advances in computer systems do not come from any single technological advance. Technologies, both hardware and software, do not all advance at the same pace. System design is the art of composing systems which use each level of technology in an appropriate balance. A major advance in overall system performance will require reexamination of all aspects of the system.
We do work in the design, fabrication and packaging of hardware; language processing and scaling issues in system software design; and the exploration of new applications areas that are opening up with the advent of higher performance systems. Researchers at WRL cooperate closely and move freely among the various levels of system design. This allows us to explore a wide range of tradeoffs to meet system goals.
We publish the results of our work in a variety of journals, conferences, research reports, and technical notes. This document is a research report. Research reports are normally accounts of completed research and may include material from earlier technical notes. We use technical notes for rapid distribution of technical material; usually this represents research in progress.
Research reports and technical notes may be ordered from us. You may mail your order to:
Technical Report Distribution
DEC Western Research Laboratory, WRL-2 250 University Avenue
Palo Alto, California 94301 USA
Reports and notes may also be ordered by electronic mail. Use one of the following addresses:
Digital E-net: DECWRL::WRL-TECHREPORTS
Internet: [email protected]
UUCP: decwrl!wrl-techreports
with Widgets,
Draw!
Joel F. Bartlett
May, 1991
Copyright
1991, Digital Equipment Corporation
Even though researchers at Digital Equipment Corporation’s Western Research Laboratory have been running the X window system [20] for more than five years, most programs make no use of graphics. While libraries and interface generators [10] have provided many interactive programs with uniform, configurable, sophisticated graphical interfaces, they have not provided programs with a way to draw. The graphical needs of many programs would be poorly served by replacing their command line arguments with a graphical equivalent. Instead, these programs would be improved by providing them with a simple way to make 2-D drawings.
A typical candidate for easy-to-use 2-D graphics is a printed circuit board router, which takes the physical location of components and a netlist describing their logical connections, and produces a wirelist showing the actual location of wires. The methods used by the grr router [8], are illustrated in the technical report by hand constructed drawings like:
If similar drawings could have been automatically made during the construction of the router, they would have greatly simplified debugging and improved the designer’s understanding of the routing heuristics. However, the designer saw adding graphical output as being too time consum-ing. Only after the router was completed were graphics added to demonstrate the router’s perfor-mance.
1
programmer. Interactive drawing programs like MacDraw and idraw [23] do this by providing users with a high-level, structured drawing model. With a few simple selection operations using the mouse, users create many kinds of device-independent graphic objects. Multiple colors, fonts, line widths, and stipples are available at the drop of a menu. As users are dealing with graphical objects instead of pixels, objects may be freely overlapped, moved, and edited; the drawing program taking full responsibility for correctly rendering them on the display.
Application programs can be offered these capabilities by providing a graphics server that replaces the drawing program’s graphical user interface with a process-to-process protocol. This server can be extended beyond the capabilities offered by a drawing program by allowing graphical objects to react to the workstation’s mouse and keyboard. For example, a network management system could draw a picture showing the host machines and their physical connec-tions. By clicking the mouse on the appropriate graphic, one could get detailed status infor-mation about a host system or communication line. One can also use these capabilities to build conventional-looking user interface objects such as push buttons or sliders.
This report describes such a graphics tool, ezd, and reports WRL’s experience with it. The challenge in constructing ezd was to make it simple enough to be readily used, yet with enough graphics capabilities and performance to be useful in a variety of applications.
2. Overview of ezd
Simple graphics should be simple. The same afternoon that one first encounters ezd, one should be able to take an existing program and produce meaningful graphics. Ezd makes this possible by providing a simple drawing model and application interface, and hiding all details of display management.
2.1. High Level Drawing Primitives
Ezd provides the application programmer with a powerful, device independent, high level drawing model. An ezd drawing is an ordered list of graphical objects. Drawings are displayed by mapping them onto windows. An object’s x,y position and size are specified using the application’s coordinate system. When drawings are displayed, the objects are drawn in the order that they were added to the drawing using the painter’s algorithm [16]: objects are opaque and later-defined objects can obscure earlier-defined objects. Objects may be given symbolic names. The first time a named object is defined establishes the object’s position in the list of objects making up the drawing. A named object is changed by simply redefining it.
When a drawing is mapped onto a window, ezd transforms the application’s coordinate system to X’s coordinate system and displays the graphical objects in the drawing. Operations such as panning and zooming are done by changing the mapping of the drawing onto the window. Mul-tiple drawings can be displayed in a window, and mulMul-tiple windows can display a drawing.
A drawing is made interactive by making objects in it sensitive to events like mouse motion, button clicks or keystrokes. The application controls whether the events are logged to the ap-plication or handled within ezd by programs written in ezd’s extension language, Scheme [1, 18].
2.2. Loosely Coupled to the Application Program
A simple drawing model is not enough. The graphics system should not restrict the application’s choice of programming language nor dictate control flow.
Like the X window system, an application interacts with ezd by sending requests to a server process. Unlike X, the application does not do this by calls to a language specific low-level library, but directly issues text-based client-server requests. Since virtually any language can send text commands, ezd does not dictate a choice of programming language.
Client programs constructed using conventional X tools must respond to a number of events generated by the X server. When a window is initially created and then made visible, a program may not draw in it until it receives an expose event from the server. At any time, the user may cover and reexpose part of the window. The X server will then prompt the associated program with an expose event, signaling the need to redraw the damaged portion of the window. Failure to do this correctly or in a timely manner will be painfully obvious to the user.
Ezd eliminates the need for the application to execute in an event-driven manner by executing as a separate process and filtering all X server events. The only events sent to the application are ones that the application has expressed an interest in. While interactive applications must still be responsive to the user, many useful graphics can be displayed without handling any events.
2.3. Automatically Rendered to the Display
Once a drawing is mapped onto a window, the application program need not further concern itself with the window as ezd takes full responsibility for displaying the contents of the window. When a drawing is changed by the application, all views of it are automatically updated. Display updates are deferred until a natural break in the application command stream. The changed por-tions of each window are then determined, rendered to an off screen buffer, and copied onto the display. Simple animation is implicit in this display handling method as multiple changes to a drawing are reflected as one smooth, flicker-free change to the window(s) displaying it.
3. An Interactive Clock Face
time
drifts
by
This section describes a C implementation of this program. The commentary focuses on the 2
program’s control structure and the ezd commands used to create the clock face . 3
The first phase of the program creates a separate ezd process with a pipe [13] namedoutfor requests to the ezd server, and a pipe namedinfor event notifications from the ezd server.
The second phase of the program issues commands to ezd to define the clock face and recog-nize user mouse actions on it. The first commands issued create a window named
clock-windowand a drawing namedclock, and map the drawing onto the window.
(window clock-window 200 200 fixed-size) (set-drawing clock)
(overlay clock-window clock)
(origin clock-window clock 100 100) (scale clock-window clock 1 -1 1)
Theorigincommand sets the origin of the drawing in the center of the window. The scale
command changes the default X coordinate system (positive Y goes down) to one in which posi-tive Y goes up and declares that one unit in the drawing is one pixel on the screen.
The next group of commands define the objects making up the clock face. As later-defined objects can overlap earlier-defined objects, objects are defined from back to front.
(object back (fill-arc -100 -100 200 200 0 360 gray95) (arc -100 -100 200 200 0 360 gray85)) (object minute)
(text -60 -60 120 120 left up "time" grey60 "times_italic24")
(text -60 -60 120 120 right center "drifts" grey60 "times_italic24") (text -60 -60 120 120 left down "by" grey60 "times_italic24")
(object hour)
(fill-arc -5 -5 10 10 0 360 black) (object cover)
2Readers interested in the details of the implementation should consult the appendices, which contain complete source for C and Scheme implementations.
The first object defined is the background of the clock. It consists of a filled circle edged in a slightly darker gray and is given the name back. Each drawing command specifies the x,y position and size of the object it defines in terms of the application’s coordinate system. Next, the minute hand is defined as a null graphical object. Although the command causes nothing to be displayed, it does establish the order of the object named minutein the list of objects in the drawing. Following this come thetextcommands that display the string "time drifts by". Text is positioned by specifying a position, a rectangle, and two keywords indicating left-right posi-tion and up-down posiposi-tion within the rectangle. Finally, the hour hand’s order in the drawing is established, the hands’ drive shaft is defined, and the null objectcoveris defined.
The hands are defined by calls to the following procedure, where out is the pipe to the ezd server.
void draw_hand( name, length, angle ) char *name;
int length; double angle; {
fprintf( out,
"(object %s (fill-polygon 0 0 %f %f %f %f %f %f))", name,
25*cos( angle+.25 ), 25*sin(angle+.25 ), length*cos( angle ), length*sin( angle ), 25*cos( angle-.25 ), 25*sin(angle-.25 ) ); }
Each time a named object is defined, the new graphical object replaces the previous one. Just as with an interactive drawing package, other objects are automatically redisplayed when an object is moved or deleted.
Time is set by dragging either of the hands with the mouse. A drag operation is started by depressing mouse button 1 with the mouse on either of the hands. The hands are made mouse-sensitive by issuing thewhencommands:
(when minute button1down (begin (log-event),
(ezd ’(object cover
(fill-rectangle -100 -100 200 200 clear))))) (when hour button1down
(begin (log-event)
(ezd ’(object cover
(fill-rectangle -100 -100 200 200 clear)))))
Each command is of the form(whenobject event action). Object is the name of an object in the drawing, event is the type of event, and action is a Scheme expression to evaluate. The event action is a sequence of two procedure calls. The first,(log-event), causes an event record to be written on ezd’s default output file that can be read on the program’s pipe in. The second redefines the objectcoveras a clear filled rectangle that covers the entire window.
The drag operation is continued by the user moving the mouse over the window with button 1 held down. Defining cover over all other objects in the drawing and making it sensitive to mouse motion by the command:
(when cover motion (log-event))
coverwere not defined, then mouse motion would be seen as occurring in either hand or in the background during the drag. While the application could make those objects sensitive to mouse motion, it is often easier to observe mouse motion by using a clear object as is done here.
The drag completes when the user release mouse button 1. The next twowhencommands:
(when cover button1up (ezd ’(object cover)))
(when cover enter (if (not *mouse-button1*) (ezd ’(object cover))))
detect the completion of the drag and are explained with the third phase of the program.
Once these commands have been sent to the ezd server, the program starts its third phase, event monitoring. This is done by reading text messages from in, the pipe from ezd. Note that the only events reported by ezd are those that the application has explicitly asked for.
To illustrate the interaction between the application and ezd, the actions taken when a user sets the time are explained. When the user presses mouse button 1 down on one of the hands, ezd logs the event to the application and redefines the object cover. The application detects this event by reading the text:
(BUTTON1DOWN CLOCK-WINDOW CLOCK HOUR 2 34 102 66)
from the pipe from ezd.
As cover is now the top object on the drawing, mouse motion events are reported to it. Ezd’slog-eventprocedure sends events to the application as strings of the form:
(MOTION CLOCK-WINDOW CLOCK COVER 4 34 104 66)
Using the hand from the button-1-down event, and the mouse position from subsequent motion events, the application redefines both hands to reflect the new time. This process continues as the user drags the mouse until button 1 comes up.
Cover is sensitive to enter events as the application wishes to allow the drag to continue if the mouse leaves the window and then reenters with mouse button 1 down. When button 1 comes up, the drag is complete and cover is redefined as a null object. Note that neither the button up nor the enter event are logged to the application.
Two additionalwhencommands issued during the second phase of the program allow genera-4
tion of PostScript [2] output and terminate the program:
(when back button2down (postscript clock-window "clock.psf")) (when back button3down (log-event))
The illustration for this section was created by moving the hands into an appealing position and then pressing mouse button 2 to make a PostScript rendering of the contents of the window.
Running this application displays ezd’s ability to do animation. As the mouse is dragged, the application simply redefines the hands in their new positions and they appear to move smoothly.
4. Ezd Details
This section examines ezd’s concepts in more detail, and compares ezd to other X-based tools. Many X applications use Xt [3], a toolkit built on top of Xlib, X’s low-level C library. In con-junction with the toolkit, one uses a library of widgets such as Motif [17]. A widget is a predefined component of a user interface that typically consists of both a graphical "look" and an interactive "feel", e.g. a push button or pop-up menu. An alternative to the X toolkit is InterViews [14], a C++ user interface library. Finally, other window systems such as NeWS [9] have been based on the page description language PostScript.
4.1. Drawing Primitives
Ezd provides a simple, powerful drawing model: graphic objects are ordered into drawings, and drawings are displayed by mapping them onto windows.
Graphic objects are created using commands that create lines, rectangles, polygons, arcs, and text in arbitrary colors, stipples, and fonts. The x,y position, size, and line width of each object is specified in a device-independent coordinate system using either integer or floating point num-bers.
(line 10 10 100 100 5 red)
(fill-polygon .2 .2 10.7 20.6 20 0 magenta)
Zero or more of these drawing primitives can be grouped together to form a named object.
(object a)
(object quit (fill-rectangle 10 10 50 30 yellow) (rectangle 10 10 50 30)
(text 10 10 50 30 center center "OK"))
The order in which objects are defined is important as later defined objects may obscure ear-lier defined objects. When a named object is first defined, its position in the drawing order is established. Drawings may be edited by simply redefining the object. When the object is redefined, its position in the drawing order is retained. For example, a program could redefine the objectquitwith a wider rectangle around it by:
(object quit (fill-rectangle 10 10 50 30 yellow) (rectangle 10 10 50 30 4)
(text 10 10 50 30 center center "OK"))
Objects can be hidden from view by defining them as a null object with no graphics commands. A program could hide thequitobject by issuing the command:
(object quit)
Finally, an object’s position in the drawing order can be changed. Objects may be brought to the top of a drawing, sunk to the bottom, or placed above or below another object in the drawing.
In order to display an ezd drawing, the application first creates a window. Window size and 5
position are specified in either points or pixels (the default). For example, the following com-mand creates a window namedmy-windowthat is 400 points on a side and may not be resized:
(window my-window 400 400 fixed-size points)
A drawing is then mapped onto the window by a command like:
(overlay my-window a-drawing)
Explicit commands are not required to make windows appear or disappear. Instead, this occurs as a side effect of mapping or unmapping drawings on them. The simple notion of mapping a drawing onto a window provides many graphical effects.
The contents of a window can be zoomed or panned by changing the translation of the drawing’s device-independent coordinate system. When a drawing is mapped onto a window, the drawing’s coordinate system is transformed using the following functions, wherescale_x,
scale_y, andscale_line_widthare initially equal to one:
X_x = drawing_x * scale_x + origin_x X_y = drawing_y * scale_y + origin_y
X_line_width = drawing_line_width * scale_line_width
The result is a one-to-one translation between the drawing coordinate system and X’s. To change the mapping, the application issues scale and origincommands. For example, the following commands place the drawing’s origin in the center of the window and make one unit of the drawing equal to 100 pixels:
(origin my-window a-drawing 200 200) (scale my-window a-drawing 100 100 1)
Device-independent origin and scale factors may also be specified in terms of points.
Mapping a drawing onto multiple windows provides multiple views of a drawing. Each view may be independently zoomed or panned. As changes are made to a drawing, they are visible in all of the windows that show that portion of the drawing. Multiple drawings may in turn be mapped onto a window. For example, when constructing a viewer for a VLSI chip, one might put each layer of the chip in a separate drawing. Layers can be selectively added or deleted from a window by simply mapping or unmapping the appropriate drawing.
Window borders provide a natural "view finder" for producing a PostScript rendering of the contents of a window. Once the drawings’ mappings and the window size have been adjusted, a command like:
(postscript my-window "my-window.psf")
is issued to produce a PostScript file that can be printed or included in another document such as this report. Even though the graphics primitives are similar to X’s, they are device-independent and are easily translated to PostScript. This results in an image that has more resolution than a pixel-based screen dump.
By hiding the mechanism for translating application drawings to images in windows, ezd is able to translate a simple drawing model into a high quality display. Applications generally do not concern themselves with when the display is updated. Changes to drawings are typically buffered until a natural pause in the application when it stops issuing commands. As a result, the incremental nature of the changes made by the application is not visible.
Finally, to eliminate the flicker that can occur when a portion of the window is cleared and then redrawn, updates are typically rendered to an off-screen buffer and then copied to the win-dow. The result of these display management optimizations are the smooth, atomic screen up-dates required for animation, without any effort by the application programmer. Many of these effects could be implemented more efficiently by programming directly with Xlib. However, there is sufficient power in today’s 10 MIPS or faster workstations for ezd’s structured graphics to have good visual performance.
A major difference between ezd and other X-based toolkits is that the latter provide little sup-port for any form of structured graphics. An exception to this is the C++ toolkit, InterViews. It provides a class of structured graphics objects with behavior similar to those found in ezd and supports a more general graphics capability by allowing objects to be defined by splines. However, it does not have ezd’s simplicity as it does not define all objects using structured graphics. While application-defined objects may be defined using structured graphics, user in-terface interactors such as push buttons are not.
By far the richest graphics primitives are those found in PostScript-based systems such as NeWS [9]. They allow arbitrary scaling and rotation of all graphics, including text. However, such systems do not directly support structured graphics.
4.2. Graphics Server
Ezd is visible to an application program as a structured graphics server using a simple text-based protocol. Unlike most X-text-based toolkits including Xt and InterViews, ezd issues no event requests that must be handled by the application program, and thus imposes no requirements on the application’s control flow. Ezd only notifies the application program when an event occurs in which the application has explicitly designated interest.
When building an interactive program, this may have little effect on the program’s design. For example, the clock face program in Section 3 requires an event loop. However, the event han-dling code is simpler than would be required for most other X-based implementations as there are fewer events to handle and the static portions of the drawing never need to be redrawn. Eliminating mandatory event monitoring allows any program that can print text to produce graphics as well.
The protocol for communication between ezd and the application was chosen with an eye toward minimizing restrictions on the application programming language. Commands are text strings, where each command is an open parenthesis, a command name, the command’s ar-guments separated by spaces, followed by a close parenthesis. Since ezd’s drawing model is much simpler than that used by PostScript, ezd has no notion of a current graphics state holding color, font, line, and clipping information. Instead, all information required to draw each object is found in its command. While this makes command sequences a little bulkier than they might be, it simplifies the language and makes debugging easier.
#! /bin/csh -f ezd -p <<END
(window vr297help 20 5 400 400 "VR297 Adjustment Instructions") (set-drawing help)
(overlay vr297help help)
(text 10 30 "Turn contrast control to maximum position. Set H-STAT") .
. .
(rectangle 475 375 80 80 blk)
(text 475 375 80 80 center center "R G B" blk "9x15") (object clear (fill-rectangle 0 0 1000 1000 clear)) (click clear 1 (ezd ’(quit)))
END
Figure 1: Color monitor calibration tool
The disadvantage of structuring ezd as a text-based server between the application and the X server is the additional processor costs for interprocess communication and process dispatching and additional memory required for the ezd process. Message and process dispatch costs are not significantly more expensive than with Xt as the bulk of the message traffic is between ezd and the X server. Where additional message latency costs occur is in the few requests that require a round trip between the X server and the application via ezd. These requests can be minimized by adding application-specific code to ezd, and 10 MIPS workstations have sufficient power to provide good performance for requests that must make this round trip.
The major cost for using ezd is the memory used by each ezd process’ heap. Running a simple ezd script on a DECstation 3100, a workstation that uses a MIPS R2000 processor [12], takes 1 MB of data space; similar to that used by idraw to draw the same graphics. Even as drawing complexity increases, most applications fit in a 4MB heap. Some of this cost is due to ezd’s use of a generational compacting garbage collector, but some of it is inherent in ezd’s support of a structured drawing model.
4.3. Interaction Model
Drawn objects are turned into user interface interactors by making them sensitive to mouse and keyboard events. The events reported by ezd are similar to those returned by X, with one key difference: X events are associated with windows, whereas ezd events are associated with application-defined graphical objects.
As the mouse is moved across a window, ezd continuously translates the mouse position on the display to a position in an object in a drawing. This translation is done by finding the top-most object in the toptop-most drawing mapped into the window that contains the mouse. When an object needs to detect the mouse entering it, exiting it, or moving within it, the application issues one or morewhencommands:
(when object enter action) (when object motion action) (when object exit action)
When a mouse button or keyboard key is pressed or released, the event is reported to the object currently containing the mouse. For example, the commands:
(when ok-button button1down (log-event)) (when ok-button button1up (log-event)) (when ok-button keyrelease (log-event))
make the object ok-button sensitive to mouse button 1 and keystrokes. The event action,
(log-event), forwards the event notification to the application program.
The ezd event model does not support X’s notion of a "pointer grab." That is, when a mouse button is pushed, the ezd object containing the mouse does not automatically track the mouse until the button is released. Instead, irrespective of the state of the mouse buttons, all events are always reported to the topmost object that contains the mouse. This mechanism is an adequate replacement for pointer grabs as the mouse position is translated to an object in a drawing using the current definition of the drawing, not the pixels on the display. When an event handler run-ning in the ezd server makes a change to a drawing, the change is immediately reflected in the drawing. Changes to the area of a drawing under the mouse immediately generate any needed object exit and enter events before ezd processes further X events.
One application of this property is tracking mouse motion for dragging objects. In the ex-ample in Section 3, pressing mouse button 1 generates an X event. The event handler logs it to the application and redefines the objectcover as a clear rectangle over the entire window. As far as ezd is concerned, this caused the mouse to move from the hand to cover. As long as the mouse button is held down,coverremains in place and accepts mouse motion events. Redefin-ing the hands in their new positions does not affect cover as the hands are under it. When button 1 comes up, the event action redefinescoveras a null object, moving the mouse to some other object.
Another example where a pointer grab is required with X is when an application wishes to draw an object under the mouse when a mouse button is pressed. With ezd, irrespective of the speed that the mouse is moved after the button is pressed, the application sees the mouse entering the object. While the application programmer has a simple event model, the user is allowed to "mouse-ahead."
Ezd does not provide the event translation mechanism found in the X toolkit and its associated 6
widget sets. These tools allow the easy definition of keyboard shortcuts and multiple event se-quences such as double mouse clicks, and are oriented towards the construction of predefined, uniform user interfaces. While event handling in such precompiled interfaces may take a more global view and be more efficient than that done by ezd, such systems do not have its simplicity and flexibility.
Ezd objects can communicate with each other via the event mechanism. The application or an object’s event handler may send a get-attributes event to get information from an object, or a set-attributes event to set information in an object. This message-passing capability allows user interface interactors to be adapted to new tasks. For example, a check-button is a button that is
clicked with the mouse to set it, and clicked again to clear it. Often a group of these buttons is arranged in a radio button set, where exactly one of them can be set at any one time (see Figure 6 in Section 5.3). When a member of a radio button set is set, it tells the other members of the radio button set to clear themselves via the event mechanism. Interface objects like this are usually constructed by programming them in ezd’s extension language, rather than in the ap-plication.
4.4. Extension Language
Intertwined with event handling is ezd’s extension language, Scheme. When an event is reported to an object, the event handler (a Scheme procedure or expression) is evaluated. The simplest event handler, used in the example in Section 3, is the expression (log-event). When it is evaluated, it sends a text message containing the event type, window, drawing and object names, and the mouse coordinates to the application program via a pipe.
If the user is willing to learn Scheme, many events can be handled in the server without any interaction with the application. This results in a faster response to the event, and may result in simpler control structures in the application. For example, an application may want the origin of a drawing to always be centered in the window displaying it. When the window is resized, the origin can be moved with the following command:
(when * resize
(ezd ‘(origin ,*user-event-window* ,*user-event-drawing* ,(quotient (list-ref *user-event-misc* 2) 2) ,(quotient (list-ref *user-event-misc* 3) 2))))
The values of the variables*user-event-window*and*user-event-drawing*are the name of the window and the name of the drawing where the event occurred. The value of
*user-event-misc* is dependent upon the type of event. In this case, it is a list of four items: the old window width, the old window height, the new window width, and the new win-dow height. The procedureezd takes as its arguments one or more lists that are ezd commands, then executes the commands.
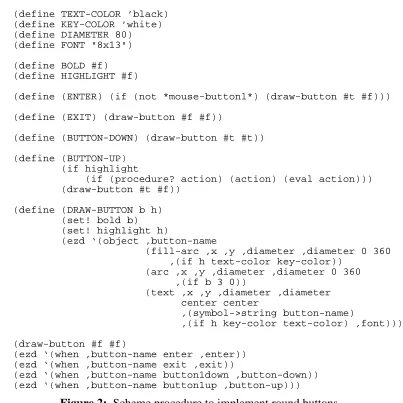
More sophisticated extensions can be done by adding new Scheme procedures to ezd. The example in Figure 2 shows the Scheme code required to implement round push buttons. When the mouse is inside a button, the button’s border thickens. When mouse button 1 is depressed inside the button, the button colors reverse, and when the mouse button comes up the button action is executed. When the proceduremake-round-buttonis executed, it defines the but-ton object in its normal state and installs four event handlers that implement this behavior.
(define (MAKE-ROUND-BUTTON button-name x y action) (define TEXT-COLOR ’black)
(define KEY-COLOR ’white) (define DIAMETER 80) (define FONT "8x13") (define BOLD #f) (define HIGHLIGHT #f)
(define (ENTER) (if (not *mouse-button1*) (draw-button #t #f))) (define (EXIT) (draw-button #f #f))
(define (BUTTON-DOWN) (draw-button #t #t)) (define (BUTTON-UP)
(if highlight
(if (procedure? action) (action) (eval action))) (draw-button #t #f))
(define (DRAW-BUTTON b h) (set! bold b) (set! highlight h)
(ezd ‘(object ,button-name
(fill-arc ,x ,y ,diameter ,diameter 0 360 ,(if h text-color key-color))
(arc ,x ,y ,diameter ,diameter 0 360 ,(if b 3 0))
(text ,x ,y ,diameter ,diameter center center
,(symbol->string button-name)
,(if h key-color text-color) ,font)))) (draw-button #f #f)
(ezd ‘(when ,button-name enter ,enter)) (ezd ‘(when ,button-name exit ,exit))
[image:17.612.125.528.82.485.2](ezd ‘(when ,button-name button1down ,button-down)) (ezd ‘(when ,button-name button1up ,button-up)))
Figure 2: Scheme procedure to implement round buttons
The round button code, found in the file round.sc, is tested by running ezd as an interactive Scheme system:
csh 149 >ezd -i
Scheme->C -- 28sep90jfb -- Copyright 1989 Digital Equipment... > (load "round.sc")
MAKE-ROUND-BUTTON "round.sc"
> (make-round-button ’button1 10 10 ’(log-event)) #F
> (make-round-button ’button2 110 10 ’(log-event)) #F
> (make-round-button ’button3 220 10 ’(log-event)) #F
This session produces a window containing three buttons. When the mouse is in button1, the drawing looks like:
BUTTON1 BUTTON2 BUTTON3
Clicking each button results in the following messages:
(BUTTON1UP EZD EZD BUTTON1 64 67 64 67) (BUTTON1UP EZD EZD BUTTON2 165 59 165 59) (BUTTON1UP EZD EZD BUTTON3 231 61 231 61)
Once tested, the same buttons can be built with the following ezd commands:
(include "round.sc")
(scheme (make-round-button ’button1 10 10 ’(log-event)) (make-round-button ’button2 110 10 ’(log-event)) (make-round-button ’button3 220 10 ’(log-event)))
where the schemecommand allows a sequence of Scheme expressions to be embedded in the ezd command stream. The user could go one step further and add a round-buttoncommand to ezd. This is done by adding a call to define-ezd-command to the round.sc file with the following arguments: a pattern to parse the command, a string showing the correct form of the command, and the procedure that implements the command.
(define-ezd-command
‘(round-button ,symbol? ,number? ,number?) "(round-button button-name x y)"
make-round-button)
This allows an ezd application to build the same buttons with the commands:
(include "round.sc")
(round-button button1 10 10) (round-button button2 110 10) (round-button button3 220 10)
Other graphics systems have found that Lisp dialects make excellent graphics extension lan-guages. Scheme is used by SCIX [11], an object oriented interface to the X window system protocol, and by a shell for GL [5]. WINTERP [15], an interactive environment for prototyping with the OSF/MOTIF Toolkit, uses a subset of Common Lisp.
5. Applications of ezd
The true test of any graphics system is not the elegance (or lack thereof) of its drawing model or implementation, but the applications that users are able to construct with it and their ease of construction. This section describes four applications representative of work done at WRL. They demonstrate that ezd has been easy to use and can be used for real problems.
5.1. Heap Memory Map for Garbage-Collected C++
A generational garbage collector for C++ [4] is able to do significant heap compaction in spite of the fact that the roots are ambiguous. An excellent way to demonstrate the collector’s perfor-mance is to display a map of the heap as the program runs. Each 512-byte page of the garbage-collected heap is represented by a small rectangle whose color denotes the state of the page: free, a member of the stable set, or recently allocated to the current generation. As each page is allocated, the associated rectangle is defined. During garbage collection, retained data is com-pacted by copying it from recently allocated pages to newly allocated pages in the stable set. At the end of garbage collection all pages not in the stable set are marked free.
Free space Recently Allocated Stable set Starting Garbage Collection
In order to provide a heap map for arbitrary C++ programs, it is important that the map’s presence not affect the control flow of the program. Ezd supports this because it is a graphics server rather than a graphics library. The C++ program never receives a request from ezd as ezd handles all X events and user interaction. Even though the user may stop the display and step it through a garbage collection via a pop-up menu, the only effect on the C++ program is that it may block if it fills the pipe to ezd.
To avoid time-consuming redraws, such as marking previously allocated pages free, X ap-plications sometimes allocate a private color cell in the display’s color map. Changing the RGB value of the color cell changes the color of all pixels displayed in the color. Ezd provides this capability via the notion of a variable color; a color whose RGB value can be changed by the application at any time.
the free color. At this point, nothing on the screen is displayed using the next color in the set of four, so it is set to the recently allocated color and pages are defined using it as they are al-located.
This application is typical of the type of "quick and dirty" drawing that one can produce with ezd: take an existing program and quickly modify it to draw a picture about some aspect of its computation. In this case, the heap map was implemented in part of an afternoon using less than 100 lines of C++.
5.2. High Density Data Representation
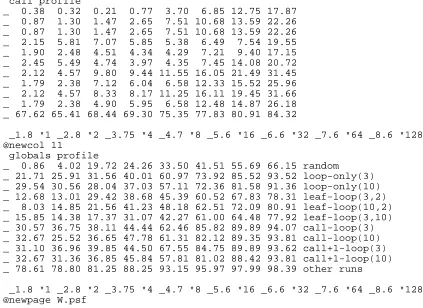
While ezd was designed to be a program-driven drawing system for displays, its ability to generate PostScript images makes it valuable for document graphics as well. David Wall ex-amined how well estimated and real program execution profiles predict program behavior [24]. He compared five types of profiles produced by eleven different methods against the actual profiles for multiple runs of eleven programs. In order to reduce this volume of information to something from which he and his readers could draw conclusions, he devised a graphical
nota-7
tion (shown in Figure 3) consisting of arrays of pie charts . Each row of the graph represents the results for one method of estimating profiles and each column shows how well the top "n" items of the real and estimated profiles matched. The fraction of the circle that is filled in indicates how well the estimated profile matched the actual profile, i.e. the blacker the pie, the better the match.
call profile
1 2 4 8 16 32 64 128
globals profile
random loop-only(3) loop-only(10) leaf-loop(3,2) leaf-loop(10,2) leaf-loop(3,10)
call-loop(3) call-loop(10) call+1-loop(3) call+1-loop(10) other runs
[image:20.612.69.513.390.617.2]1 2 4 8 16 32 64 128
Figure 3: Program execution profile estimates
In order to easily produce the 2,508 pie-charts found in his paper, Wall created a little
8
guage to specify them . The compiler is a several-hundred-line Modula-2 program that converts a chart specification like that found in Figure 4 to into the ezd command file in Figure 5 which was used to produce Figure 3.
call profile
_ 0.38 0.32 0.21 0.77 3.70 6.85 12.75 17.87 _ 0.87 1.30 1.47 2.65 7.51 10.68 13.59 22.26 _ 0.87 1.30 1.47 2.65 7.51 10.68 13.59 22.26 _ 2.15 5.81 7.07 5.85 5.38 6.49 7.54 19.55 _ 1.90 2.48 4.51 4.34 4.29 7.21 9.40 17.15 _ 2.45 5.49 4.74 3.97 4.35 7.45 14.08 20.72 _ 2.12 4.57 9.80 9.44 11.55 16.05 21.49 31.45 _ 1.79 2.38 7.12 6.04 6.58 12.33 15.52 25.96 _ 2.12 4.57 8.33 8.17 11.25 16.11 19.45 31.66 _ 1.79 2.38 4.90 5.95 6.58 12.48 14.87 26.18 _ 67.62 65.41 68.44 69.30 75.35 77.83 80.91 84.32
_1.8 "1 _2.8 "2 _3.75 "4 _4.7 "8 _5.6 "16 _6.6 "32 _7.6 "64 _8.6 "128 @newcol 11
globals profile
_ 0.86 4.02 19.72 24.26 33.50 41.51 55.69 66.15 random
_ 21.71 25.91 31.56 40.01 60.97 73.92 85.52 93.52 loop-only(3) _ 29.54 30.56 28.04 37.03 57.11 72.36 81.58 91.36 loop-only(10) _ 12.68 13.01 29.42 38.68 45.39 60.52 67.83 78.31 leaf-loop(3,2) _ 8.03 14.85 21.56 41.23 48.18 62.51 72.09 80.91 leaf-loop(10,2) _ 15.85 14.38 17.37 31.07 42.27 61.00 64.48 77.92 leaf-loop(3,10) _ 30.57 36.75 38.11 44.44 62.46 85.82 89.89 94.07 call-loop(3) _ 32.67 25.52 36.65 47.78 61.31 82.12 89.35 93.81 call-loop(10) _ 31.10 36.96 39.85 44.50 67.55 84.75 89.89 93.62 call+1-loop(3) _ 32.67 31.36 36.85 45.84 57.81 81.02 88.42 93.81 call+1-loop(10) _ 78.61 78.80 81.25 88.25 93.15 95.97 97.99 98.39 other runs
[image:21.612.111.534.126.434.2]_1.8 "1 _2.8 "2 _3.75 "4 _4.7 "8 _5.6 "16 _6.6 "32 _7.6 "64 _8.6 "128 @newpage W.psf
Figure 4: Little language for pie charts
(window pies 600 50 600 720) (set-drawing pies)
(overlay pies pies) (clear)
(text 30 20 "call profile" black "6x12") (arc 40 36 12 12 270 360 black)
(pie-arc 40 36 12 12 270 1.4 black) (arc 60 36 12 12 270 360 black) (pie-arc 60 36 12 12 270 1.2 black) (arc 80 36 12 12 270 360 black)
. . .
(pie-arc 80 36 12 12 270 0.8 black) (text 342 228 "32" black "6x12") (text 362 228 "64" black "6x12") (text 382 228 "128" black "6x12") (postscript pies "W.psf")
Figure 5: Ezd for pie charts
N & Central California
DISC ZONE WARN EXTEND HELP QUIT
CLOUDY AND BREEZY. SNOW LEVEL AS LOW AS 1000 TO 2000 FEET. HIGHS IN THE 50S AND LOWER 60S. NORTHWEST WIND 15 TO 25 MPH WITH OCCASIONAL HIGHER GUSTS ALONG THE COAST AND IN THE HILLS THIS MORNING.
.TONIGHT...CLEAR...LOWS IN THE MID 30S TO MID 40S. NORTHWEST EVENING WIND 15 TO 25 MPH DECREASING DURING THE NIGHT.
.SATURDAY...INCREASING CLOUDINESS. HIGHS IN THE MID 50S TO LOW 60S. $$
CAZ003-151700-CENTRAL COAST - MONTEREY TO PT CONCEPTION
3 AM PST FRI MAR 15 1991 ...DO NOT USE AFTER 9.30 AM FRIDAY
.TODAY...SCATTERED SHOWERS AND A SLIGHT CHANCE OF THUNDERSTORMS WITH SMALL HAIL THIS MORNING. SHOWERS TAPERING OFF DURING THE AFTERNOON. HIGHS IN THE 50S AND LOWER 60S. NORTHWEST WIND 15 TO 30 MPH WITH OCCASIONAL HIGHER GUSTS NEAR THE OCEAN.
$$
CAZ002-151700-SAN FRANCISCO BAY REGION ...UPDATE...
[image:22.612.67.543.71.424.2]6.15 AM PST FRI MAR 15 1991 ...DO NOT USE AFTER 9.30 AM FRIDAY .TODAY...WIDELY SCATTERED EARLY MORNING SHOWERS...OTHERWISE PARTLY
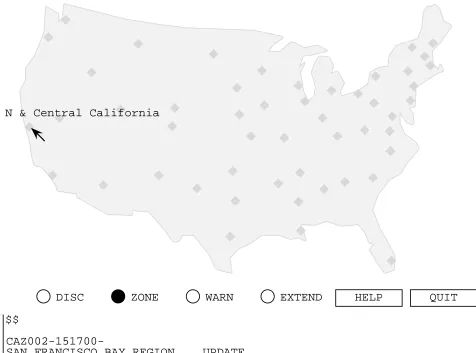
5.3. Weather Forecasts
National Weather Service forecasts for the United States are sometimes available for network access. The ezd application shown in Figure 6 was constructed to fetch such forecasts for the contiguous 48 states. The mouse-sensitive diamonds on the map identify cities that issue forecasts. When the mouse is positioned over a diamond, text describing the region covered by the forecast is displayed. When the mouse is clicked on a diamond, the forecast is obtained via the network and displayed in the text area at the bottom of the window. The text is scrolled using the scroll bar on the left of the text. The mouse can be used to select areas of text for copying into other X applications. The radio buttons DISC,ZONE,WARN, and EXTEND select the type of forecast, theHELPpush button replaces the forecast text with help text, and theQUIT
push button terminates the application.
Every graphical element of this application, a 300 line Scheme program running entirely in the ezd server, is constructed using ezd. The text area, slider, check buttons, and push buttons are drawn with a library of interactors that use the basic ezd drawing capabilities. A simple ezd-based drawing tool was used to collect the 133 line segments and 50 city locations defining the the map by tracing a newspaper weather map (copied onto a transparency and taped over the display) and then positioning the cities on it.
The application graphics are automatically positioned based upon the size of the window. This is done by grouping the graphics into three drawings: one containing the map, one contain-ing the buttons, and one containcontain-ing the text area and slider. When the window is initially created or resized, the drawings are overlayed onto the window by centering the map at the top of the window, attaching the buttons to the right side of the window, and using the rest of the window below the buttons for the text area. Even though ezd does no automatic window layout, explicit layout requires only 5 ezd commands, generated by a 22 line Scheme procedure.
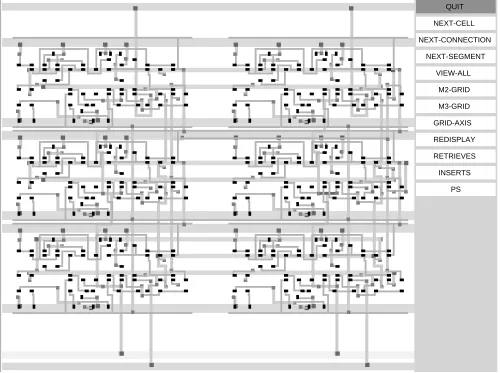
5.4. BIPS Router
For the last two years, the majority of researchers at WRL have been working on BIPS, a custom bipolar processor with arithmetic unit, floating point unit, address translation buffers, memory management unit, and first level cache all on one die. The CAD tools being constructed for this project allow schematics and hints about layout to be automatically converted to a chip. As can be expected, automatically routing the chip is a difficult problem. Early on in the project, Jeremy Dion and Louis Monier reached the limits of their patience with debugging using con-ventional tools and chose to try graphics to observe the router in action. Their initial efforts took less than a day to implement and produced pictures similar to that show in Figure 7, which con-tains over 2000 graphical objects.
QUIT NEXT-CELL NEXT-CONNECTION
NEXT-SEGMENT VIEW-ALL
M2-GRID M3-GRID GRID-AXIS REDISPLAY RETRIEVES INSERTS
[image:24.612.54.554.96.469.2]PS
Figure 7: BIPS router
Ezd graphics have proven to be an essential part of the router development. The implementers of the router estimate that about one-half their debug time is spent watching the router in action to gain insight in both the problem and how their heuristics attempt to solve it. When changes to the router are made, regression tests are run over a special set of small, difficult test cases. Any tests that fail are visually examined to understand why they failed.
6. Ezd’s Limits
Second, it is important to differentiate ezd from user interface toolkits designed for X. While it is easy to learn and straightforward to develop many classes of applications, there are also many that it is unsuited for. For example, ezd completely ignores two things considered critical in most toolkits: automatic window layout and customization.
While most graphical user interface tools illustrate their function by showing how well they can arrange and support push-buttons, ezd’s strengths are in drawing and can be illustrated by its four line solution to the following problem. Draw three overlapping circles; when mouse button 1 is clicked on a circle, raise it to the top of the drawing.
(object red (fill-arc 0 0 60 60 0 360 red)) (object green (fill-arc 30 0 60 60 0 360 green)) (object blue (fill-arc 15 30 60 60 0 360 blue)) (click * 1 (ezd ‘(float ,*user-event-object*)))
7. The Return of Interactive Structured Graphics
Given WRL’s positive experience with ezd, it is natural to ask: why haven’t others provided simple access to a structured graphics server? The record suggests that they have, but there were problems. In the early 80’s, there were attempts to build graphical interface systems using GKS [10]. Two things probably contributed to their demise. First, there were both functional and performance limitations to making systems using structured graphics interactive. The graphics systems were focused towards high-quality output, rather than toward rapid display and handling user interaction. Second, while these systems thought in terms of a single application window, systems done at Xerox PARC encouraged people to think in terms of multiple interactive win-dows sharing the screen.
For low-performance machines and simple interactive objects like buttons, a policy of dif-ferentiating between structured graphics and interactive interface objects makes sense. As com-puters get faster and interactive objects more ornate, there is less reason to draw interactive inter-face objects not using structured graphics. For example, Xerox PARC’s "Embedded Buttons" architecture hints at what is possible when text and graphics editors can be used to construct user interfaces [7]. Work at Stanford on Unidraw [23] has been toward building a framework for constructing application specific graphical editors.
Interactive structured graphics will become more common as systems such as PEX [19], the PHIGS/PHIGS+ extension to X, that embed structured graphics within a base window system, become more common.
8. Conclusion
would not confuse the speed and detail of the circuit drawing with one produced by a "real" VLSI CAD tool, its speed is adequate and the information presented by it has proven to be in-valuable to the construction of the router.
By executing within a distributed window system, ezd does not have to solve all graphics problems. The processor performance is available in today’s 10 MIPS or faster workstations to get good interactive graphics performance from a structured drawing model. Ezd has success-fully taken advantage of these resources to offer application programs a simple but visually satis-fying way to draw.
9. Acknowledgements
I. Clock Face Example Implemented in C
/* A Clock face. Drag either of the hands with mouse button 1 to set the value. The clock face is drawn with its center at 0,0 in a cartesian (Y goes up) coordinate system. Click button 3 on the background to quit. To run:
csh >cc -o clock clock.c -lm csh >clock
*/
#include <stdio.h> #include <math.h> #include <string.h>
/* start_ezd process connects the read side to the "toezd" pipe to stdin and the write side of the "fromezd" pipe to stdout, and then exec’s ezd. */
int toezd[ 2 ], /* Used to send commands to ezd */ fromezd[ 2 ]; /* Used by ezd to report events */
FILE *out, /* ezd commands are written on this stream */ *in; /* ezd events are read from this stream */
void start_ezdprocess() {
pipe( toezd ); pipe( fromezd ); if (fork() == 0) {
/* Child process */
close( 0 ); /* Move stdin */ dup( toezd[ 0 ] );
close( toezd[ 0 ] ); close( toezd[ 1 ] );
close( 1 ); /* Move stdout */ dup( fromezd[ 1 ] );
close( fromezd[ 0 ] ); close( fromezd[ 1 ] );
execlp( "ezd", "ezd", 0 ); /* Start ezd & transfer control */ exit( 1 ); /* Error exit */
}
/* Parent process */ close( toezd[ 0 ] );
out = fdopen( toezd[ 1 ], "w" ); close( fromezd[ 1 ] );
in = fdopen( fromezd[ 0 ], "r" ); }
/* Move an angle value specified in radians into the 0-2PI range. */
double zero_2pi( x ) double x; {
if (x < 0) return x+M_PI*2; return x;
/* Convert time in minutes to an angle in radians in the range 0-2pi. */
double minute_angle( minute ) int minute;
{
return zero_2pi( M_PI_2 - (minute/30.0)*M_PI ); }
/* Convert an angle in radians into a time in minutes */
int angle_minute( a ) double a; {
return (15 - (int)((a*30)/M_PI)) % 60; }
/* Convert an x,y position in the drawing to an angle in radians. */
double xy_angle( x, y ) int x, y;
{
return zero_2pi( atan2( (double)y, (double)x ) ); }
/* Draws a hand on the clock face. */
void draw_hand( name, length, minute ) char *name;
int length, minute; {
double angle = minute_angle( minute );
fprintf( out,
"(object %s (fill-polygon 0 0 %f %f %f %f %f %f))", name,
25*cos( angle+.25 ), 25*sin(angle+.25 ), length*cos( angle ), length*sin( angle ), 25*cos( angle-.25 ), 25*sin(angle-.25 ) ); }
/* Draws both hands on the clock face. */
void draw_hands( time ) int time;
{
draw_hand( "minute", 85, time % 60 ); draw_hand( "hour", 55, (time / 12) % 60 ); }
/* Collect events here. */
void handle_events( ) {
int quit = 0, /* Set when button 3 is pressed. */ time = 23, /* Initial time. */
delta_t, /* Change in time in minutes. */ x, /* X coordinate in drawing. */ y, /* Y coordinate in drawing. */ ignore; /* Dummy variable for sscanf. */ char event[ 1000 ]; /* Event buffer */
double mark_angle, /* Angle of last mouse position. */ new_angle, /* Angle of current mouse position. */ delta_angle; /* Change in angle. */
draw_hands( time ); while (quit == 0) {
fflush( out );
if (fgets( event, 1000, in ) == NULL) abort(); if (sscanf( event,
"(BUTTON1DOWN CLOCK-WINDOW CLOCK MINUTE %d %d %d %d)", &x, &y, &ignore, &ignore ) == 4) {
/* Start moving the minute hand. */ mark_minute = 1;
mark_angle = minute_angle( time % 60 ); } else if (sscanf( event,
"(BUTTON1DOWN CLOCK-WINDOW CLOCK HOUR %d %d %d %d)", &x, &y, &ignore, &ignore ) == 4) {
/* Start moving the hour hand */ mark_minute = 0;
mark_angle = minute_angle( (time/12)%60 ); } else if (sscanf( event,
"(MOTION CLOCK-WINDOW CLOCK COVER %d %d %d %d)", &x, &y, &ignore, &ignore ) == 4) {
/* Move the hands */
new_angle = xy_angle( x, y );
delta_angle = mark_angle-new_angle;
if (delta_angle < -M_PI) delta_angle = delta_angle+M_PI*2; if (delta_angle > M_PI) delta_angle = delta_angle-M_PI*2; delta_t = delta_angle*(30/M_PI)*((mark_minute) ? 1 : 12); if (delta_t != 0) {
time = (time+delta_t) % 720;
mark_angle = minute_angle( ((mark_minute) ? time : time/12) % 60 );
draw_hands( time ); }
} else if (sscanf( event,
"(BUTTON3DOWN CLOCK-WINDOW CLOCK BACK %d %d %d %d)", &ignore, &ignore, &ignore, &ignore ) == 4) { /* Quit */
quit = 1; } else {
/* Unexpected event, so log it on stderr. */ fprintf( stderr, "%s", event );
/* Initial command stream. */
char* ezd_commands[] = {
"(window clock-window 200 200 fixed-size)", "(set-drawing clock)",
"(overlay clock-window clock)",
"(origin clock-window clock 100 100)", "(scale clock-window clock 1 -1 1)",
"(object back (fill-arc -100 -100 200 200 0 360 gray95)", " (arc -100 -100 200 200 0 360 gray85))",
"(object minute)",
"(text -60 -60 120 120 left up \"time\" grey60 \"times_italic24\")", "(text -60 -60 120 120 right center \"drifts\" grey60",
" \"times_italic24\")",
"(text -60 -60 120 120 left down \"by\" grey60 \"times_italic24\")", "(object hour)",
"(object cover)",
"(fill-arc -5 -5 10 10 0 360 black)", "(when back button2down",
" (ezd ’(postscript clock-window \"clock.psf\")))", "(when back button3down (log-event))",
"(when minute button1down (begin (log-event)", " (ezd ’(object cover",
" (fill-rectangle -100 -100 200 200 clear)))))", "(when hour button1down (begin (log-event)",
" (ezd ’(object cover",
" (fill-rectangle -100 -100 200 200 clear)))))", "(when cover enter",
" (if (not *mouse-button1*) (ezd ’(object cover))))", "(when cover button1up (ezd ’(object cover)))",
"(when cover motion (log-event))", NULL };
main() {
int i; /* Loop index. */
/* Start ezd. */ start_ezdprocess();
/* Issue initial ezd commands. */
for (i = 0; ezd_commands[ i ] != NULL; i++) fprintf( out, ezd_commands[ i ] );
/* Handle ezd events. */ handle_events();
II. Clock Face Example Implemented in Scheme
;;; A Clock face. Drag either of the hands with mouse button 1 to set the ;;; value. The clock face is drawn with its center at 0,0 in a cartesian ;;; (Y goes up) coordinate system. Click button 3 on the background to quit. ;;; To run:
;;;
;;; csh >ezd -i
;;; Scheme->C -- 28sep90jfb -- Copyright 1989 Digital Equipment ... ;;; > (load "clock.sc")
;;; CLOCK ;;; "clock.sc" ;;; > (clock 45) ;;; #F
;;; > > ^D ;;; csh >
(define (CLOCK time)
(define PI 3.14159)
(define PI*2 (* 3.14159 2)) (define PI/2 (/ 3.14159 2))
(define (ZERO-2PI x) (if (< x 0) (+ x pi*2) x))
(define (MINUTE->ANGLE minute) (zero-2pi (- pi/2 (* (/ minute 30) pi))))
(define (ANGLE->MINUTE angle) (modulo (- 15 (/ (* 30 angle) pi)) 60))
(define (XY->ANGLE x y) (zero-2pi (atan y x)))
(define (DRAW-HAND name length minute)
(let ((angle (minute->angle minute))) (ezd ‘(object ,name
(fill-polygon 0 0
,(* 25 (cos (+ angle .25))) ,(* 25 (sin (+ angle .25))) ,(* length (cos angle)) ,(* length (sin angle)) ,(* 25 (cos (- angle .25))) ,(* 25 (sin (- angle .25))))))))
(define (DRAW-HANDS)
(draw-hand ’minute 95 (remainder time 60))
(draw-hand ’hour 65 (remainder (/ time 12) 60)))
(define MARK-HAND #f) (define MARK-ANGLE #f)
(define (MARK)
(set! mark-hand *user-event-object*) (set! mark-angle (minute->angle
(remainder (if (eq? mark-hand ’hour) (/ time 12)
time) 60)))
(define (COVER-ENTER) (if (not *mouse-button1*) (ezd ’(object cover))))
(define (COVER-BUTTON1UP) (ezd ’(object cover)))
(define (COVER-MOTION)
(let* ((new-angle (xy->angle *user-event-x* *user-event-y*)) (delta-angle (cond ((< (- mark-angle new-angle) (- pi))
(+ (- mark-angle new-angle) pi*2)) ((> (- mark-angle new-angle) pi)
(- (- mark-angle new-angle) pi*2)) (else (- mark-angle new-angle)))) (delta-t (inexact->exact
(* delta-angle (/ 30 pi)
(if (eq? mark-hand ’hour) 12 1))))) (unless (zero? delta-t)
(set! time (modulo (+ time delta-t) 720)) (if (eq? mark-hand ’hour)
(set! mark-angle (minute->angle (/ time 12))) (set! mark-angle (minute->angle
(remainder time 60)))) (draw-hands))))
(ezd ’(window clock-window 200 200 fixed-size) ’(set-drawing clock)
’(overlay clock-window clock)
’(origin clock-window clock 100 100) ’(scale clock-window clock 1 -1 1)
’(object back (fill-arc -100 -100 200 200 0 360 gray95) (arc -100 -100 200 200 0 360 gray85))
’(object minute)
’(text -60 -60 120 120 left up "time" grey60 "times_italic24") ’(text -60 -60 120 120 right center "drifts" grey60
"times_italic24")
’(text -60 -60 120 120 left down "by" grey60 "times_italic24") ’(object hour)
’(fill-arc -5 -5 10 10 0 360 black) ’(object cover)
’(when back button2down (ezd ’(postscript clock-window "clock.psf"))) ’(when back button3down (ezd ’(quit)))
‘(when minute button1down ,mark) ‘(when hour button1down ,mark) ‘(when cover enter ,cover-enter)
References
[1] Harold Abelson and Gerald Jay Sussman with Julie Sussman. Structure and
Interpreta-tion of Computer Programs. The MIT Press, 1985.
[2] Adobe Systems Incorporated. Postscript Language Reference Manual - 2nd edition. Addison-Wesley Publishing Company, Inc., 1990.
[3] Paul J. Asente and Ralph R. Swick. X Window System Toolkit. Digital Press, 1990. [4] Joel F. Bartlett. Mostly-Copying Garbage Collection Picks Up Generations and C++. Technical Note TN-12, Digital Equipment Corporation Western Research Laboratory, October, 1989.
[5] Brian Beckman. A Scheme for Little Languages in Interactive Graphics.
Software-Practice and Experience 21(2):187-207, February, 1990.
[6] Jon Bentley. More Programming Pearls. Addison-Wesley Publishing Company, Inc., 1988.
[7] Eric A. Bier and Aaron Goodisman. Documents as User Interfaces. In EP90,
Proceed-ings of the International Conference on Electronic Publishing, Document Manipulation, and Typography, pages 249-262. Cambridge University Press, 1990.
[8] Jeremy Dion. Fast Printed Circuit Board Routing. Research Report 88/1, Digital Equip-ment Corporation Western Research Laboratory, March, 1988.
[9] James Gosling, David S. H. Rosenthal, Michelle J. Arden. The NeWS book: an
intro-duction to the Networked Extensible Window System. Springer-Verlag, 1989.
[10] H. Rex Hartson and Deborah Hix. Human-Computer Interface Development: Concepts and Systems for Its Management. ACM Computing Surveys 21(1):5-92, March, 1989.
[11] Hakan Huss and Johan Ihren. SCIX A Scheme Interface to the X Window System. Royal Institute of Technology, Stockholm, March 1990, available from [email protected] or [email protected].
[12] Gerry Kane. MIPS R2000 RISC Architecture. Prentice Hall, Inc., 1987.
[13] Brian W. Kernighan, Rob Pike. The UNIX Programming Environment. Prentice-Hall, Inc., 1984.
[14] Mark A. Linton, John M. Vlissides, and Paul R. Calder. Composing User Interfaces with Interviews. IEEE Computer 22(2):8-22, February, 1989.
[15] Niels P. Mayer. The WINTERP Widget INTERpreter - A Lisp Prototyping and Exten-sion Environment for OSF/Motif-based Applications and User-Interfaces. LISP Pointers 4(1):45-60, July-March, 1990.
[16] William M. Newman, Robert F. Sproull. Principles of Interactive Computer Graphics,
Second Edition. McGraw-Hill Book Company, 1979.
[17] Open Systems Foundation. OSF/Motif Series (5 Volumes): Motif Style Guide;
3
[18] Jonathan Rees, William Clinger (Editors). Revised Report on the Algorithmic Lan-guage Scheme. SIGPLAN Notices 21(12):37-79, December, 1986.
[19] Randi J. Rost, Jeffrey D. Friedberg, Peter L. Nishimoto. PEX: A Network-transparent Three-dimensional Graphics System. IEEE Computer Graphics and Applications Magazine 9(4), July, 1989.
[20] Robert W. Scheifler and James Gettys with Jim Flowers, Ron Newman, and David Rosenthal. X Window System. Digital Press, 1990.
[21] Edward R. Tufte. The Visual Display of Quantitative Information. Graphics Press, 1983. [22] Edward R. Tufte. Envisioning Information. Graphics Press, 1990.
[23] John M. Vlissides and Mark A. Linton. Unidraw: A Framework for Building
Domain-Specific Graphical Editors. Technical Report CSL-TR-89-380, Stanford University, July, 1989.
WRL Research Reports
‘‘Titan System Manual.’’ ‘‘MultiTitan: Four Architecture Papers.’’
Michael J. K. Nielsen. Norman P. Jouppi, Jeremy Dion, David Boggs, Mich-WRL Research Report 86/1, September 1986. ael J. K. Nielsen.
WRL Research Report 87/8, April 1988. ‘‘Global Register Allocation at Link Time.’’
David W. Wall. ‘‘Fast Printed Circuit Board Routing.’’ WRL Research Report 86/3, October 1986. Jeremy Dion.
WRL Research Report 88/1, March 1988. ‘‘Optimal Finned Heat Sinks.’’
William R. Hamburgen. ‘‘Compacting Garbage Collection with Ambiguous WRL Research Report 86/4, October 1986. Roots.’’
Joel F. Bartlett.
‘‘The Mahler Experience: Using an Intermediate WRL Research Report 88/2, February 1988. Language as the Machine Description.’’
David W. Wall and Michael L. Powell. ‘‘The Experimental Literature of The Internet: An WRL Research Report 87/1, August 1987. Annotated Bibliography.’’
Jeffrey C. Mogul.
‘‘The Packet Filter: An Efficient Mechanism for WRL Research Report 88/3, August 1988. User-level Network Code.’’
Jeffrey C. Mogul, Richard F. Rashid, Michael ‘‘Measured Capacity of an Ethernet: Myths and
J. Accetta. Reality.’’
WRL Research Report 87/2, November 1987. David R. Boggs, Jeffrey C. Mogul, Christopher A. Kent.
‘‘Fragmentation Considered Harmful.’’ WRL Research Report 88/4, September 1988. Christopher A. Kent, Jeffrey C. Mogul.
WRL Research Report 87/3, December 1987. ‘‘Visa Protocols for Controlling Inter-Organizational Datagram Flow: Extended Description.’’
‘‘Cache Coherence in Distributed Systems.’’ Deborah Estrin, Jeffrey C. Mogul, Gene Tsudik,
Christopher A. Kent. Kamaljit Anand.
WRL Research Report 87/4, December 1987. WRL Research Report 88/5, December 1988.
‘‘Register Windows vs. Register Allocation.’’ ‘‘SCHEME->C A Portable Scheme-to-C Compiler.’’
David W. Wall. Joel F. Bartlett.
WRL Research Report 87/5, December 1987. WRL Research Report 89/1, January 1989.
‘‘Editing Graphical Objects Using Procedural ‘‘Optimal Group Distribution in Carry-Skip
Ad-Representations.’’ ders.’’
Paul J. Asente. Silvio Turrini.
WRL Research Report 87/6, November 1987. WRL Research Report 89/2, February 1989.
‘‘The USENET Cookbook: an Experiment in ‘‘Precise Robotic Paste Dot Dispensing.’’ Electronic Publication.’’ William R. Hamburgen.
Brian K. Reid. WRL Research Report 89/3, February 1989.
‘‘Simple and Flexible Datagram Access Controls for ‘‘Link-Time Code Modification.’’
Unix-based Gateways.’’ David W. Wall.
Jeffrey C. Mogul. WRL Research Report 89/17, September 1989. WRL Research Report 89/4, March 1989.
‘‘Noise Issues in the ECL Circuit Family.’’ Jeffrey Y.F. Tang and J. Leon Yang. ‘‘Spritely NFS: Implementation and Performance of
WRL Research Report 90/1, January 1990. Cache-Consistency Protocols.’’
V. Srinivasan and Jeffrey C. Mogul.
‘‘Efficient Generation of Test Patterns Using WRL Research Report 89/5, May 1989.
Boolean Satisfiablilty.’’ Tracy Larrabee.
‘‘Available Instruction-Level Parallelism for
Super-WRL Research Report 90/2, February 1990. scalar and Superpipelined Machines.’’
Norman P. Jouppi and David W. Wall.
‘‘Two Papers on Test Pattern Generation.’’ WRL Research Report 89/7, July 1989.
Tracy Larrabee.
WRL Research Report 90/3, March 1990. ‘‘A Unified Vector/Scalar Floating-Point
Architec-ture.’’
‘‘Virtual Memory vs. The File System.’’ Norman P. Jouppi, Jonathan Bertoni, and David
Michael N. Nelson. W. Wall.
WRL Research Report 90/4, March 1990. WRL Research Report 89/8, July 1989.
‘‘Efficient Use of Workstations for Passive Monitor-‘‘Architectural and Organizational Tradeoffs in the
ing of Local Area Networks.’’ Design of the MultiTitan CPU.’’
Jeffrey C. Mogul. Norman P. Jouppi.
WRL Research Report 90/5, July 1990. WRL Research Report 89/9, July 1989.
‘‘A One-Dimensional Thermal Model for the VAX ‘‘Integration and Packaging Plateaus of Processor
9000 Multi Chip Units.’’ Performance.’’
John S. Fitch. Norman P. Jouppi.
WRL Research Report 90/6, July 1990. WRL Research Report 89/10, July 1989.
‘‘1990 DECWRL/Livermore Magic Release.’’ ‘‘A 20-MIPS Sustained 32-bit CMOS
Microproces-Robert N. Mayo, Michael H. Arnold, Walter S. Scott, sor with High Ratio of Sustained to Peak
Perfor-Don Stark, Gordon T. Hamachi. mance.’’
WRL Research Report 90/7, September 1990. Norman P. Jouppi and Jeffrey Y. F. Tang.
WRL Research Report 89/11, July 1989.
‘‘Pool Boiling Enhancement Techniques for Water at Low Pressure.’’
‘‘The Distribution of Instruction-Level and Machine
Wade R. McGillis, John S. Fitch, William Parallelism and Its Effect on Performance.’’
R. Hamburgen, Van P. Carey. Norman P. Jouppi.
WRL Research Report 90/9, December 1990. WRL Research Report 89/13, July 1989.
‘‘Writing Fast X Servers for Dumb Color Frame Buf-‘‘Long Address Traces from RISC Machines:
fers.’’ Generation and Analysis.’’
Joel McCormack. Anita Borg, R.E.Kessler, Georgia Lazana, and David
WRL Research Report 91/1, February 1991. W. Wall.