Process Capability Analysis of High Pressure Die
Casting Process for Cap Manufacturing
Santosh S. Dabhole1, Chaitanya A. Kurundwad2, Sujit R. Prajapati3
1Assistant Professor, 2,3 UG Student Department of Mechanical Engineering,
Nutan Maharashtra Institute of Engineering and Technology, Talegaon Dabhade, Maharashtra.
Abstract: Process capability of any process is measure of ability of process to produce components as per specifications required. Components manufactured from high pressure die casting (H.P.D.C.) process shows defects like porosity, blow hole, non-filling etc. These defects are minimized by either controlling process parameters or by changing existing design of die. It is standard practice to verify the process capability for better production. In this work, H.P.D.C. process is analyzed for various process parameters. Numerical values for same are obtained from die casting machine setup run. Initially value of capability indices, such as Cp and Cpk are calculated then, using thumb rules, process capability is checked for H.P.D.C. process.
Keywords: High pressure die casting, Porosity, Process capability, Process potential (Cp), Process capability performance (Cpk)
I. INTRODUCTION
High pressure die casting (H.P.D.C.) is a specialized casting process in which molten metal is forced by applying external force into a metal die cavity. This process uses reusable permanent metal mould. In this process, metal is melted at high temperature and then it is injected at high pressure into cavity of metal mould. There are two kinds of die casting machines viz; hot chamber die casting machine which is used for non-ferrous alloy having low melting point such as Zinc and cold chamber die casting machines which is used for non-ferrous alloy having high melting point such as Aluminium etc. Like all other manufacturing process, H.P.D.C. process also shows defects. Any unwanted shift of any parameter from its specified value leads to cause defects in die casted parts. In die casting, some defects are tolerated up to certain limit, whereas some can be easily rectified by performing additional processes [1]. Porosity, blow holes, blisters, hot tears and non-fillings are some of commonly occurring defects.
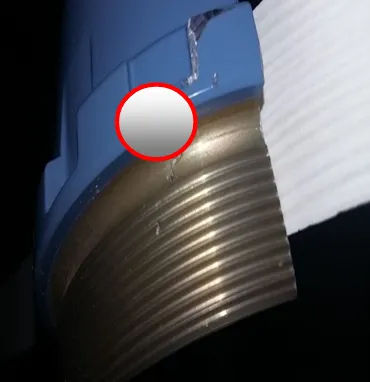
[image:2.612.213.398.456.647.2]Key defects such as blow holes, porosity, and non-filling are seen in products due to many reasons. These are mostly due to uncontrolled process and lacunas in tool design. In concerned study, porosity defect is observed in die casted cap see figure 1.
Fig. 1 : Cap manufactured by H.P.D.C. Process having blow holes
Fig. 2: Pareto chart of porosity for September 2016.
Fig. 3: Trend chart of porosity defect for four months.
Process capability is the ability of process to manufacture parts within the standard limits. Process capability is technique applied in many stages of product lifecycle helps to determine capability of process to produce components within upper and lower tolerance limits [2]. Process capability is long term performance of process once it is brought under statistical control. Also it is range over which natural variation of process parameters occurs over standard limits [3]. Process capability is method of analysing process with the help of statistical tools such as control charts, histogram, etc. developed from normal curve with good engineering judgment [4]. Process capability is analysed by determining values of process capability indices such as process potential index (Cp), process
performance index (Cpk). Cp is capability index which considers overall process variations with respect to specified designed
tolerance. It only plots product quality characteristics. Cpk is a mean of process variations but, it does not clarify on-target and off-
target process [2]. Cp is process capability index used to measure fitment within upper and lower control limits. Cpk is centering
capability index used to measure how data is centered within specified limits [3]. Cp relates process capability with specified range.
Cpk considers average of process and tells where the process is located with respect to specifications [4].
II. PROCESSCAPABILITY
A. Assumption in process capability analysis
Following assumptions are made in process capability analysis 1) Process under consideration is under control.
2) Process performances are normally distributed.
3) During trial effect of external factors such as environmental effects is neglected.
B. Process capability determination:
Process capability of any process is determined by determining values of capability indices Cp and Cpk [3]. Formulae required to
compute these indices which are given as below,
Cp = ( (U.S.L.) - (L.S.L.) ) / 6σ (1)
Cpk = min ( (U.S.L.-μ) / 3σ ,(μ-L.S.L) / 3σ ) (2)
[image:3.612.212.410.253.383.2]U.S.L. = Upper specified limit, L.S.L. = Lower specified limit,
σ = Process standard deviation, μ = Process mean.
All above data can be found out from sample of observations obtained by taking trial.
Once all parameters mentioned above are calculated, then it is necessary to analyse them to determine capability of process.
C. Some thumb rules obtained for checking process capability are as follows 1) If Cp > 1; process is capable to produce parts.
2) If Cpk > 1; process is centered between U.S.L. and L.S.L. and capable for producing parts.
3) If Cp = Cpk; process is centered at midpoint of specification limits.
4) If Cp > Cpk; process is off-centered from specified limits.
5) If Cpk = 1; process is barely capable.
6) If Cpk < 1; process is not capable [4].
D. Some additional rules are also given as follows 1) If 1 ≤ Cpk< 1.33; then process is adequate.
2) If Cp≥ 1.66; process used is very satisfactory.
3) If Cp≠ Cpk; process is out of control and for that process new set of process parameters must be obtained [2].
Analysis of process capability is carried out by using above thumb rule.
III.METHODOLOGY
[image:4.612.259.364.431.718.2]The purpose of this work is to focus on capability of process parameters and to analyse capability of H.P.D.C. process to manufacture die casted product by using statistical tools such as histogram and process capability curve. For this work input data is directly obtained by die casting machine setup run. At the end it needs to be suggested whether to continue with existing process parameters or there needs to modify process parameters to minimize defects occurring in product? Figure 4 shows steps followed in determination of process capability.
IV.PROCESSCAPABILITYANALYSIS
The study was conducted on die casted component. For analysing process capability of die casting process, process capability indices are calculated. An experimental trial of 100 casting shots was taken and respective 100 readings for different parameters were obtained. Table 1 shows process parameters examined and their specified U.S.L. and L.S.L.
TABLE I
SPECIFIED LIMITS FOR PROCESS PARAMETERS
Low velocity
(V1)
(m/s)
High velocity
(V2)
(m/s) Velocity- rise time (ms) Intensify pressure (kg/cm²) Pressure- rise time (ms) Biscuit thickness (m) Casting pressure (kg/ cm²) Feed metal temperature
(⁰C)
U.S.L. 0.28 4.3 25 300 65 0.025 850 680
L.S.L. 0.18 3.3 15 260 15 0.005 750 640
[image:5.612.192.423.319.466.2]Next step is to determine numeric value of process capability indices. For this, histograms for every parameter are prepared. From these values for capability indices are calculated for each parameter mentioned in table 1. Complete data analysis is done using Minitab® software.
Figure 4 to 11 shows histograms plotted for 100 observations and results of process capability analysis.
Fig. 5: Histogram and process capability analysis for low velocity.
A. For low velocity, Cp = 6.65 and Cpk = 2.78 thus following observations are made: see figure 5
1) Cp≥ 1.66; hence process is satisfactory for low velocity.
2) Cpk ≥ 1; hence process is capable and centered between L.S.L. and U.S.L. for low velocity.
3) Cp > Cpk ; hence process is off-centered from midpoint of specified limits for low velocity.
[image:5.612.198.417.548.712.2]B. For high velocity Cp = 3.92 and Cpk = 2.86 thus following observations are made: see figure 6
1) Cp≥ 1.66; hence process is satisfactory for high velocity.
2) Cpk≥ 1; hence process is capable and centered between L.S.L. and U.S.L. for high velocity.
[image:6.612.202.427.312.474.2]3) Cp > Cpk; hence process is off-centered from midpoint of specified limits for high velocity.
Fig. 7: Histogram and process capability analysis for velocity-rise time.
C. For velocity-rise time Cp = 1.31 and Cpk = 0.90 thus following observations are made: see figure 7
1) Cp≤ 1.66; hence process is not enough satisfactory for velocity-rise time.
2) Cpk≤ 1; hence process is not capable and centered between L.S.L. and U.S.L. for velocity-rise time.
3) Cp > Cpk; hence process is off-centered from midpoint of specified limits for velocity-rise time.
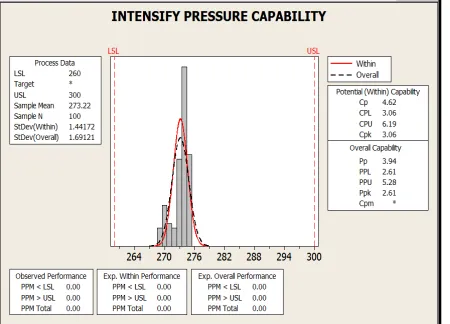
Fig 8: Histogram and process capability analysis for intensify pressure.
D. For intensify pressure Cp = 4.62 and Cpk = 3.06 thus following observations are made for intensify pressure: see figure 8
1) Cp≥ 1.66; hence process is satisfactory for intensify pressure.
2) Cpk≥ 1; hence process is capable and centered between L.S.L. and U.S.L. intensify pressure.
[image:6.612.205.424.558.709.2]3) Cp > Cpk; hence process is off-centered from midpoint of specified limits intensify pressure.
E. For Pressure-rise time Cp = 0.88 and Cpk = 0.71 thus following observations are made: see figure 9
1) Cp≤ 1.66; hence process is not satisfactory for Pressure-rise time.
2) Cpk≤ 1; hence process is capable and centered between L.S.L. and U.S.L. for Pressure-rise time.
[image:7.612.197.430.130.253.2]3) Cp > Cpk; hence process is off-centered from midpoint of specified limits for Pressure-rise time.
Fig. 10: Histogram and process capability analysis for biscuit thickness.
F. For biscuit thickness Cp = 4.18 and Cpk = 3.56 thus following observations are made: see figure 10
1) Cp≥ 1.66; hence process is satisfactory for biscuit thickness.
2) Cpk≥ 1; hence process is capable and centered between L.S.L. and U.S.L. for biscuit thickness.
[image:7.612.195.435.338.492.2]3) Cp > Cpk; hence process is off-centered from midpoint of specified limits for biscuit thickness.
Fig. 11: Histogram and process capability analysis for casting pressure.
G. For casting pressure Cp = 2.17 and Cpk = 0.74 thus following observations are made: see figure 11
1) Cp≥ 1.66; hence process is satisfactory for casting pressure.
2) Cpk≤ 1; hence process is not capable and centered between L.S.L. and U.S.L. for casting pressure.
3) Cp > Cpk; hence process is off-centered from midpoint of specified limits for casting pressure.
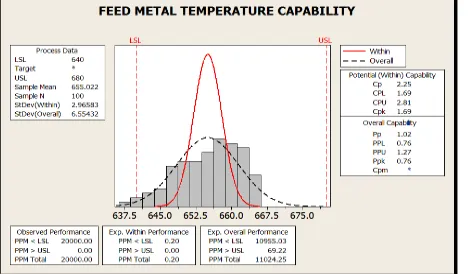
[image:7.612.198.435.576.713.2]H. For feed metal temperature Cp = 2.25 and Cpk = 1.69 thus following observations are made: see figure 12
1) Cp≥ 1.66; hence process is satisfactory for feed metal temperature.
2) Cpk≥ 1; hence process is capable and centered between L.S.L. and U.S.L. for feed metal temperature.
3) Cp > Cpk; hence process is off-centered from midpoint of specified limits for feed metal temperature.
TABLE II
CP,CPK VALUES AND REMARKS FROM HISTOGRAMS.
Process parameter Cp Cpk Remarks
High velocity 3.92 2.86 Capable & centered between L.S.L. & U.S.L.
Velocity-rise time 1.31 0.9 Capable but not centered between L.S.L. &
U.S.L.
Intensify pressure 4.62 3.06 Capable & centered between L.S.L. & U.S.L.
Pressure-rise time 0.88 0.71 Not capable & not centered between L.S.L. & U.S.L.
Biscuit thickness 4.18 3.56 Capable & centered between L.S.L. & U.S.L.
Casting pressure 2.17 0.74 Capable but not centered between L.S.L. &
U.S.L. Feed metal
temperature 2.25 1.69 Capable & centered between L.S.L. & U.S.L.
V. CONCLUSION
In this work presented, numerical values for process capability indices for various process parameters are calculated for H.P.D.C. process. By analysing those indices and using thumb rules, it can be concluded that following process parameters are within control of specified limits.
A. Low velocity.
B. High velocity. C. Intensify pressure. D. Biscuit thickness.
E. Feed metal temperature.
Pressure - rise time parameter is not under control Following process parameters are just marginally capable: F. Velocity - rise time.
G. Casting pressure.
So, new numerical values of process parameter value must be set for Pressure - rise time and rest parameters are in control.
REFERENCES
[1] K. Maheshwari, J. Sureshkumar, “Die design and molten metal flow analysis for intermediate flange”, International journal of mechanical engineering and
robotics research, ISSN 2278 - 0149, Vol.2, No.4, October 2013, pp. 176 - 182.
[2] Aysun Sagbas, “Improving The Process Capability Of A Turning Operation By The Application Of Statistical Techniques”, professional article, UDK
621.941.311.2, ISSN 1580-2949, material in technology 43 (2009) 1, pp.55-59.
[3] Adeoye Akeem. O., Adedoyin, Salami. I. and Alawaye Anthonia. I., “Process Capability Analysis as a Means of Decision Making in Manufacturing
Company”,International Journal of Advanced Research in Computer Science & Technology (IJARCST),Vol. 1 Issue 1 Oct-Dec 2013, pp. 15-18.
[4] Yerriswamy Wooluru, Swamy D. R. and P. Nagesh, “The Process Capability Analysis - A Tool For Process Performance Measures And Metrics - A Case