Improvement Techniques in Manufacturing
Industry
B. Naveen1, T. Ramesh Babu2
1, 2
Industrial Engineering, 1,2Anna University, Chennai.
Abstract— In today’s increasingly competitive world, it is important to constantly improve, be it a manufacturing or service industry. Quality with quantity is a main characteristic which helps a company stay in the competition. Technology has taken leaps of development lately and this has brought about an increase in the customer demands. The main aim is to study the current capacity, analyze it to find areas of improvement and make an improvement proposal to meet the forecasted increase in demand. This paper presents the current performance of outputs and capacity of the plant calculated using continuous data collected in shop floor. The longest time consumption workstation will be identified as a bottleneck workstation. The identified bottleneck station will be analyzed to reduce the processing time which increases production rate.
Keywords: Productivity, Cause and effect analysis, Pareto analysis, Capacity Management
I. INTRODUCTION
Productivity however, is broadly evaluated mostly through service volume, delivery processes and customer-perceived quality in services offered. In the context of the real world, productivity is mostly examined and evaluated with reference to businesses or an economy. Accordingly, it is essential to study productivity in order
to:-• Understand the processes of a business • Control the business processes • Continuously improve processes • Assess performance of a business
• Determine a business ability to sustain in the long run
Productivity is also confused with terms like efficiency and effectiveness and these terms are wrongly considered synonymous to productivity. Efficiency and effectiveness are two different terms such that efficiency indicates how well the resources are utilized to accomplish a
result. Alternatively, effectiveness refers to the degree of accomplishing the objectives.
Productivity becomes the dominant issues in the market place where customers make their buying decisions based on product quality, sometimes they can pay more for what they consider as high quality product.
A Productivity Improvement
Productivity improvement is one of the core strategies towards manufacturing excellence and it also is necessary to achieve good financial and operational performance. It enhances customer satisfaction and reduce time and cost to develop, produce and deliver products and service. Productivity has a positive and significant relationship to performance measurement for process utilization, process output, product costs, and work-in-process inventory levels and on-time delivery. Improvement can be in the form of elimination, correction (repair) of ineffective processing, simplifying the process, optimizing the system, reducing variation, maximizing throughput, reducing cost, improving quality or responsiveness and reducing set-up time.
B Capacity Management
Capacity management is responsible for all aspects of operations capacity. It is generally responsible for matching the long-term capacity of a process to the demand for its products. It does this through capacity planning, which describes more specific methods for achieving this match.
C Mean Time Between Failure
MTBF is the sum of the operational periods divided by the number of observed failures. If the "Down time" refers to the start of "downtime" and "up time" refers to the start of "uptime".
D Mean Time To Repair
mathematically, it is the total corrective maintenance time divided by the total number of corrective maintenance actions during a given period of time.
E Cause and Effect Analysis
Common use of Ishikawa diagram is product design and quality defect prevention, to identify potential factors causing an overall effect. Each cause or reason for imperfection is a source of variation. Causes are usually grouped into major categories to identify these sources of variation.
2.0 PROCESS DESCRIPTION
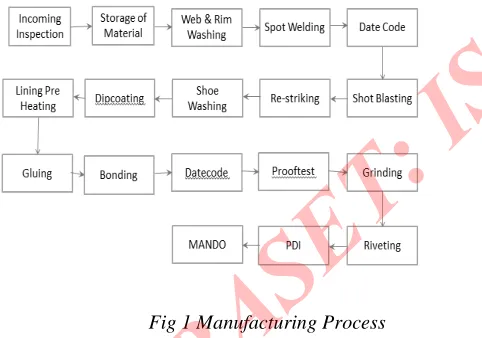
[image:3.612.49.290.375.544.2]The brake shoe manufacturing process at brakes & automotive industries is a 14 step process. The web & rim are manufactured from sheet metal and the raw material is shipped to the plant. This raw material is washed to remove any impurities. The web and rim are passed on to the welding station where both the washed raw material are spot welded. Post welding, the welded shoe is allowed to cool down and then moved to the date coding station, where the date coding process takes place.
Fig 1 Manufacturing Process
The date coded welded shoe is then shot blasted again to increase the strength of the part. After shot blasting, the part is taken to the striking zone, were the welded shoe is re-striked and then it is washed again. Parallel process of lining pre heating keeps going on the pre heating area. While the welded shoe is dip coated and moved to the gluing station where the lining is glued and kept ready for the bonding to take place.
The welded is shoe is bonded with the lining and this part is again taken to a date coding machine. The finished shoe date coded again before being put to a shear test. Once the
where the grinding process takes place. The grinded brake shoe is paired with another brake shoe with the help of the riveting process which takes place in the riveting station. These finished products are then accumulated and stored. Based on the daily demand, the products are shipped to Mando India.
3.0 PROBLEM DEFINITION
Now a days, many company want to improve their output and productivity to achieve their yearly target by eliminating some causes and production time that affect profit for company. In flow line production the product moves to one
workstation due to time restriction. Once it’s get stuck due to
accumulation in certain workstation, it exceeds the cycle time in that station. Faster station is limited by slowest station. Thus, decreasing the rate of productivity. As the demand are not met by the company, productivity improvements techniques are used to identify the bottleneck process in production line and eliminate them to achieve the goal of the company.
4.0 DATA COLLECTION
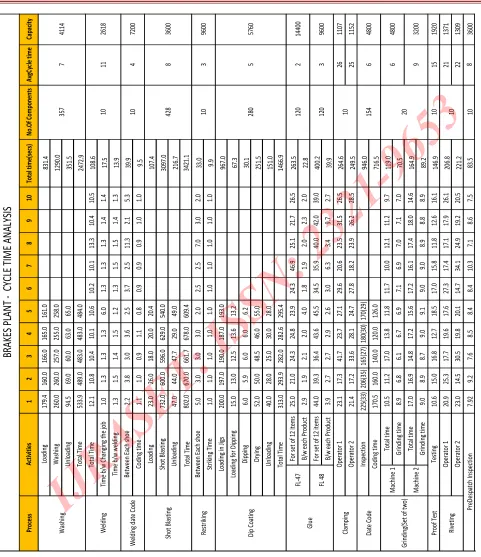
The purpose of data collection is to provide a basis for analysis, in other words, to turn data into information that is used by, and useful to, decision-makers. However, before data can be collected, a data collection plan needs to be developed. The data is collected to identify the bottleneck station in manufacturing plant and to analyze and eliminate them. The collected data is of direct observation in shop floor using stop watch by continuous assessment of each machine. Data collected is shown in (table 1) below.
5.0 METHODOLOGY
A productivity improvement technique is the methodology chosen to carry out to increase the production of brake shoe manufacturing
.
A framework of the work to be carried is given as follows From the direct continuous observation data collected the
capacity has been calculated. Identification of bottleneck process. Analyzing bottleneck process. Reducing cycle time.
Reducing takt time.
From the data collected it was found that there were few bottleneck stations. Data analysis was made in-order to eliminate bottleneck station and to improve takt time. Data analysis is shown in table2.
Table 2 Data Analysis
Activity AvgCycle timeCapacity(100%)Capacity(80%)
Washing 7 4114 3291
Welding 11 2618 2095
Welding Date code 4 7200 5760
Shot Blasting 8 3600 2880
Restriking 3 9600 7680
Dip Coating 5 5760 4608
FL-47A 2 14400 11520
FL-48 3 9600 7680
Clamping1 26 1108 886
Clamping2 25 1152 922
Date Code 6 4800 3840
Grinding1 6 4800 3840
Grinding2 9 3200 2560
Proof Test 15 1920 1536
Riveting1 21 1371 1097
Riveting2 22 1309 1047
Predespatch Inspection 8 3600 2880
6.0 Quality Analysis
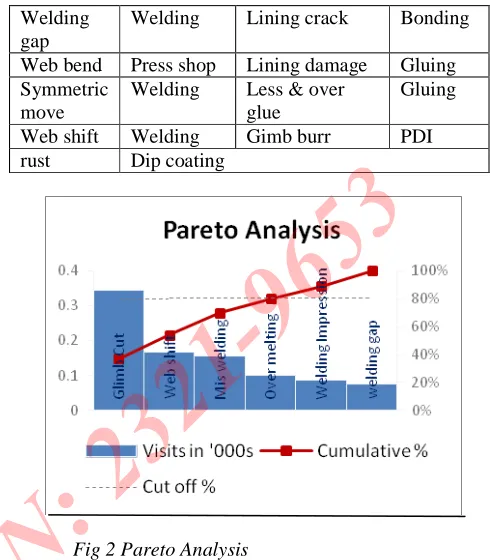
From the data of rejection rate some quality losses are identified
Table 3 Quality losses
Quality loss
Work station
Quality loss Work
Station Glimb cut Press Shop,
restriking Operations missing Riveting Miss welding
Welding Opposite side Riveting
over /under melt
Welding End cutting Riveting
Line mark, plating
Riveting Lining radius mismatch
Grinding
Welding impression
Welding Lining shift Bonding
gap
Web bend Press shop Lining damage Gluing Symmetric
move
Welding Less & over glue
Gluing
Web shift Welding Gimb burr PDI rust Dip coating
Fig 2 Pareto Analysis
Based on pareto analysis few major losses was identified. Why-Why analysis is used to list remedial measures to reduce the effect of the problem.
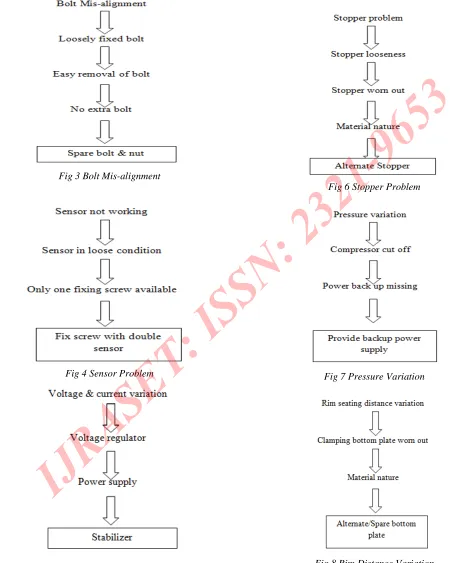
B WHY-WHY Analysis.
It is a method of questioning that leads to the identification of the root cause(s) of problem. Why-Why analysis has been used to find solutions for few quality loss factors to address its root causes
List of major losses are listed below Lining shift
Symmetrical move Web shift
[image:5.612.43.560.106.690.2]Fig 3 Bolt Mis-alignment
Fig 4 Sensor Problem
Fig 5 Voltage Variation
Fig 6 Stopper Problem
[image:6.612.64.514.109.672.2]Fig 7 Pressure Variation
C Gains of the study
After implementation of these measures there is an anticipated change in production rate. From this study we came to know that there will be about 1% increase in production rate. The change in production rate is shown in table below.
Table 4 Increase in production rate
Quality loss Current
production
Increase in production rate
%
Gimb Cut 34655 0.995527
Mis-Welding 34833 0.99044
Over Melting,
Under Melt 34845 0.990099
Line Mark,
Plating 34900 0.988539
Welding
Impression 34914 0.988142
Welding Gap 34925 0.987831
7.0 CONCLUSION
From the collected data it has been identified that the production time is less than the takt time for the case study organization hence in order to meet the demand it is important to implement the suitable industrial engineering tools. By implementing, it can reduce the cycle time and work-in-progress. Reduction of waste can also improve productivity. Improving quality at the source will not affect any station, but reduces scrap and rework. Manufacturing defect less product will help to meet the demand. After collection of data the bottleneck station was identified. Cause and effect diagram was used to identify the causes which reduces the production rate and the remedial measures has been noted to reduce the causes.
1. KA Tenah, Introducing management information systems in medium-sized construction companies, International Journal of Project Management, Volume 3, Issue 3, August 1985, Pages 169-176, ISSN 0263-7863.
2. Wemin , A systematic procedure for the selection of bulk material handling equipment, International Journal of Production Economics, Volume 27, Issue 3, October 1990, Pages 233-240, ISSN 0925-5273.
3. Harrington. (1991). Continuous versus breakthrough improvement. Business Process Re-engineering & Management Journal , 1 (3), 31-49.
4. R.H.A. Seidel, G. Arndt, Productivity Improvement in Job Shop Production, CIRP Annals - Manufacturing Technology, Volume 37, Issue 1, 1998, Pages 421-424, ISSN 0007-8506.