6
I
January 2018
Testing of HVDC Transmission using SMC System
in Relation to PI Controller
B. Prasanna Lakshmi1, K. Ramesh2, R. Kiranmayi3 1
Research Scholar, Electrical Engineering, JNTUCE, Ananthapur, India 2
Professor, EEE, Kuppam Engineering College, Kuppam, AP, India 3
Professor, Dept. of EEE, JNTUCE, Ananthapur, AP, India
Abstract: This paper presents a nonlinear controller for High Voltage DC Transmission system using sliding mode control strategy. It is expected that in future the use of High Voltage DC technology will be expanded. The conventional proportional-integral type control system loops for the current and extinction angle controllers in high voltage DC converters are replaced with Sliding Mode based control. The two approaches are compared on CIGRE benchmark model using Matlab/ Simulink. A method to further refine the sliding mode control to improve the transient response is presented. The results show that the sliding mode control based approach can provide, at the minimum, a marginal improvement over the P-I based controller. Keywords: HVDC technology, Propagation Integral (PI) controller, Sliding Mode Controller (SMC)
I. INTRODUCTION
In a general power system, the generated electrical runs to customers through the transmission and distribution network. High voltage is used for electric power transmission to reduce the energy lost in the resistance of the wires. For a given quantity of power transmitted, doubling the voltage will deliver the same power at only half the current. Since the power lost as heat in the wires is proportional to the square of the current for a given conductor size, but does not depend on the voltage, doubling the voltage reduces the line losses per unit of electrical power delivered by a factor of 4. While power lost in transmission can also be reduced by increasing the conductor size, larger conductors are heavier and more expensive. High voltage cannot readily be used for lighting or motors, so transmission-level voltages must be reduced for end-use equipment. There are three types of DC transmission lines. They are mono polar, bi polar and homopolar.
This paper aim is to control nonlinearities in the system and insensitive to parameter variations.
II.BENCHMARK MODEL
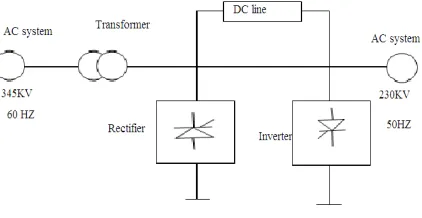
The Benchmark Simulation Model No 2 (BSM2) is a detailed protocol for implementing, analyzing and evaluating the impact and performance of both existing and novel control strategies applied to wastewater treatment plants (WWTPs). The basic block diagram of bench mark model -2 is shown below fig.1.
[image:2.612.209.420.539.648.2]
Fig 2.1: Basic block diagram for Bench mark model-2
having rectifier and inverter. Generally, rectifier can be converts the AC power into DC power and inverter converts DC to AC power. In this way we are interfacing between the two AC systems. In rectifier we are having more harmonics to reduce the harmonics we are using the transformer. Generally transformers are mainly used for varying voltage and harmonic nullify components elimination and filter purpose also we are using the transformer.
III. CONTROLLERS OF HVDC SYSTEM
The HVDC system is represented by the CIGRE first. HVDC Benchmark model which is mainly used for the simulation study of the HVDC transmission systems .The CIGRE HVDC system is mono-polar and each rectifier and inverter station is rated 500kV, 1000MW.The rectifier side is connected to a relatively strong AC system. The rectifier and the inverter are interconnected through a 300 km distributed parameter line and two 0.5H smoothing inductor.
A.Rectifier and inverter control
Mainly, the CIGRE HVDC benchmark system consists of two control model. The rectifier control is provided with a Constant Current (CC) controller to maintain the DC link current constant and the inverter is equipped with a Constant Extinction Angle (CEA) controller and the CC controller. The DC link current at the rectifier end is compared with reference current which obtained from the inverter controller output to produce error signal. By subtracting the measured current with reference current and input signal u1 , the error signal is obtained. The error signal is then passed through the PI controller to produce required firing angel α at rectifier valves. The current controller block diagram for rectifier is shown in Figure 1. The rectifier, moreover, is provided with an α limit control. In the CC control mode, tap changer control of the converter transformer brings α within range of 10° to 20°.
The rectifier fringe angle decreases until it reach the min limit, if there is a reduction in voltage at the rectifier end. Under normal conditions, nominal angle in rectifier control (α ) is regulated to a value of about 15°.
FIG.3.1.Rectifier current controller
Generally, there are many controllers in the control systems. In this HVDC we can use two types controls according to the efficiency, accuracy we can choose sliding mode control and proportion and integral control.
IV. HVDC USING PI CONTROL
Integrator will decrease the stability of the system. And variation of gain is toughest task in control system. So we use different types of controllers. In roportion control oscillations are decreases, tr (rise time) increases, and then peak over shoot is decreases.
shown in fig.4.1 and fig.4.2.At rectifier side we are controlling current whereas at inverter side controlling voltage. 1 pulses Id_ref (pu) Vd (pu) Id_ref_lim Vd_filt VDCOL (Discrete) Voltage dependent Current Order Limiter
Y
D
Min=0 Max = 10
0.1 Id_margin VdL_R -T-Vabc_R Id_R Stop_R -T-t 0.1 s boolean error PI alpha
Control
Current Control " PI Control "
-K-A->pu 1 -K-A->pu alpha_ord (deg) Vabc (pu) Block PulsesY PulsesD Freq 3 Vabc 2 Vd 1 Id Y D FIG.4.1.PI control at rectifier side
1
pulses
flliters
e PI alpha
Control
Voltage Control
Y
D Min=0
Max = 10
alpha_ord_I Vabc_I Id_I VdL_I Stop_I Vd_ref_I t 0.1 s boolean 0 -K-A->pu -K-A->pu alpha_ord (deg) Vabc (pu) Block PulsesY PulsesD Freq
12-pulse Firing Control 3 Vabc 2 VdL 1 Id Y D
FIG.4.2.PI controller at inverter side
V.SLIDING MODE CONTROL
Generally sliding mode control is a mathematical control. And it is a first order system. And in sliding mode control, no. of types is there. But here we can use the Global Sliding Mode Control for an Uncertain System method is used for HVDC transmission system.
A.Global Sliding Mode Control for an Uncertain System
Global sliding mode control can be obtained by designing an equation of dynamic nonlinear sliding surface. Global sliding mode control eliminates the attaining motion phase and ensures that the whole process of system response is robust. Thus, the drawback of the traditional sliding mode variable structure which has no robustness in the attaining mode is overcome.
Fig.5.1. Digital control system structure
Fig.5.2.Program diagram of digital control algorithm
B.Global Sliding Mode Design
)
(
t
f
dt
de
ce
S
---( 1 )Where s = output of sliding
dt
de
= derivative of error = e’
f(t) = sliding surface c = surface gain e = error
Where c must satisfy Hurwitz condition c > 0. The tracking error and its derivative value is
),
(
)
(
t
r
t
e
e
1(
t
)
r
1
1(
t
)
Where r = desired quantity or ideal position signal.
= measured quantity.dt
de
t
e
c
[image:6.612.196.420.269.403.2]S
.
(
)
---( 2 )Fig .5.4. Block diagram of global sliding mode
The global sliding mode controller is designed as
---(3)
where,
---(a)
Let the Lyapunov function be
V=
2
1
s2 --
From Eq. (2), we have
)
)
(
)
(
[
)
(
)
(
)
(
)
(
1 1d
u
d
c
d
b
f
c
b
b
d
c
d
f
c
bd
bu
f
d
C
d
f
e
c
e
s
-(4)
=
---(5) Therefore,
---(6)
From Eq. (a), we get
Therefore,
---(7) i.e.,
----( 8)
In order to reduce the chattering phenomenon, the saturated function can be Used, i.e.,
---( 9 )
Simulation Example Let the plant be
where J =1.0 + 0.2sin t, d(t) =0.1+sin(2
).The use of saturated function can reduce the chattering phenomenon effectively.
Fig .5.5. Position tracking
C. Surface representation of pi and smc
Fig.5.7. Diagram of Surface Representation
D.Sliding mode control based on reaching law:
Sliding mode based on reaching law includes reaching phase and sliding phase. The reaching phase drive system is to maintain a stable manifold and the sliding phase drive system ensures slide to equilibrium. The idea of sliding mode can be described as Fig
Fig.5.8. The idea of sliding mode
Sliding surface + reaching law = sliding mode control
Fig.5.9.The idea of sliding mode
VI. RESULTS AND DISCUSSION
There are two situations are demonstrated they are steady state and step response. For Easier viewing, only the waveforms of single phase are shown.
Fig.6.1. The DC Voltage and current response in P.U system
Figure.6.1. plots are DC Voltage and Current response in p.u. These are the response at the time of starting [0 sec to 1 sec]. which show how HVDC starts and ramp up. In the above diagram of Voltage and current response we are comparing proportional and integration control & sliding mode control in per unit. Here one p.u voltage is considered as 500kv and one p.u current is considered as 2000A at the time of starting[0 sec to 1sec].
Fig.6.2. voltage and current response of the ac fault system
Fig.6.2 shows at t= 1 sec 3ph fault is created. Above are voltage and current responses. In the above diagram of AC Voltage and current response we are comparing proportional and integration control & sliding mode control in three phase system.
C.DC FAULT comparing PI and SMC
According to fig.15 at t= 2 sec DC fault is created. Above are voltage and current response with pi and Sliding Mode Control. In the above diagram of the Voltage and current response we are
D.LOAD
At t=3 sec current order changes from 1 pu to 0.5 puie., 50% change in Load and at t=4 sec current Order again increases to 1 pu. From Above Fig.16 plots sliding Mode control Shows best performance and better non linearity
III. CONCLUSION
In paper the application of the sliding mode control was studied and presented. Sliding Mode control of HVDC systems was investigated. The effectiveness of the proposed controller is tested on CIGRE benchmark model. This proposed controller takes care of nonlinearities in the system and insensitive to parameter variations. This proposed strategy is very effective and guarantees good robust performance both in steady state and transient stability. HVDC system based on sliding mode algorithm shows good performance compared with convectional control.
IV. FUTURE SCOPE
The scope of this work is the modeling and simulation of HVDC transmission system with sliding mode controller. In this sliding mode controller the drawback is chattering. We have to nullify the chattering in Experimental investigations will be done in future.
REFERENCES [1]Itkis U. Control System of Variable Structure. New York: Wiley, 197
[2]Hung JY, Gao W, Hung JC. Variable Structure Control: A Survey, IEEE Transaction on Industrial Electronics, 1993,40(1): 2 _ 22 [3]Edwards C, Spurgeon S. Sliding Mode Control: Theory and Applications, London: Taylorand Francis, 1998
[4]Choi HS, Park YH, Cho Y, Lee M. Global sliding mode control. IEEE Control Magazine,2001, 21(3): 27 _ 35
[5]Kang BP, Ju JL. Sliding mode controller with filtered signal for robot manipulators using virtual plant/controller, Mechatronics, 1997, 7(3): 277 _ 286 [6]B. R. Andersen, Lexus, P. J. Horton, and P. Cartwright, “Topologies for VSC transmission,” Power Eng. J., v16 pp. 142–150, Jun. 2002.
[7]F. A. R. Al Jowder and B. T. Ooi, “HVDC LIGHT station with SSSC characteristics,” IEEE Trans. Power Electron., vol. 19, no. 4, pp. 1053–1059, Jul. 2004. [8]G. Asplund, “Application of HVDC light to power system enhancement,” in Proc. IEEE Power Eng. Soc. Winter Meeting, Jan. 2000, vol.4, pp. 2498–2503.–22, 2002 [9]2012). “Ten-year network development plan 2012,” European Network of Transmission System Operators for Electricity (ENTSO-E), Tech. Rep.,
[10] Gene F. Franklin, J. David Powell, Abbas Emami-Naeini. Feedback Control of Dynamic Systems. 3rd edition. USA. Addison-Wesley, 1994 [11] Ashish Tewari, Modern Control Design with MATLAB and SIMULINK, John Wiley &SonsLtd, 2002